PZ Support Resistance
- Indikatoren
- PZ TRADING SLU
- Version: 6.4
- Aktualisiert: 28 April 2021
- Aktivierungen: 20
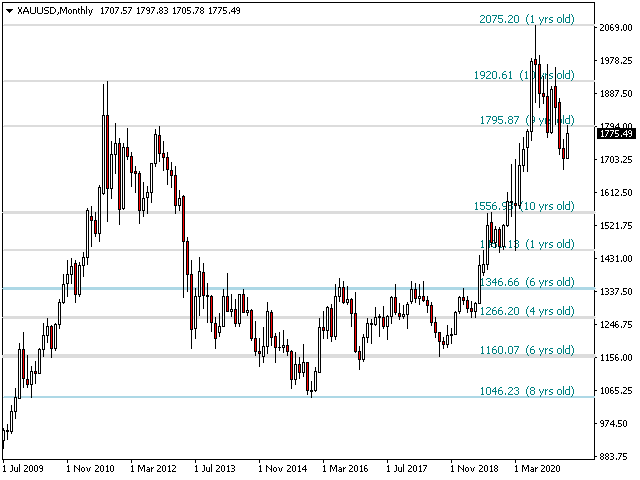
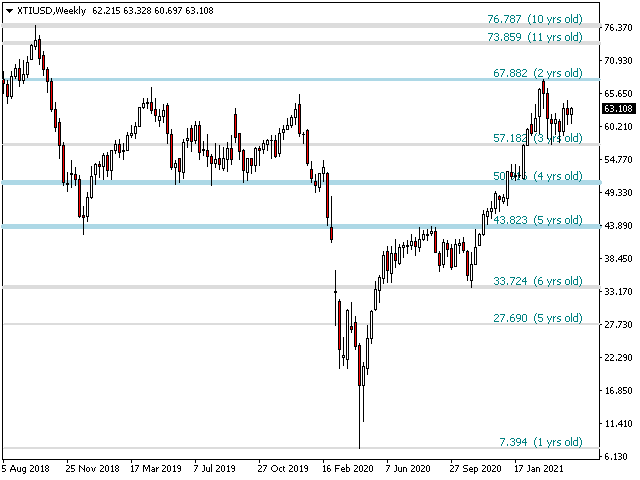
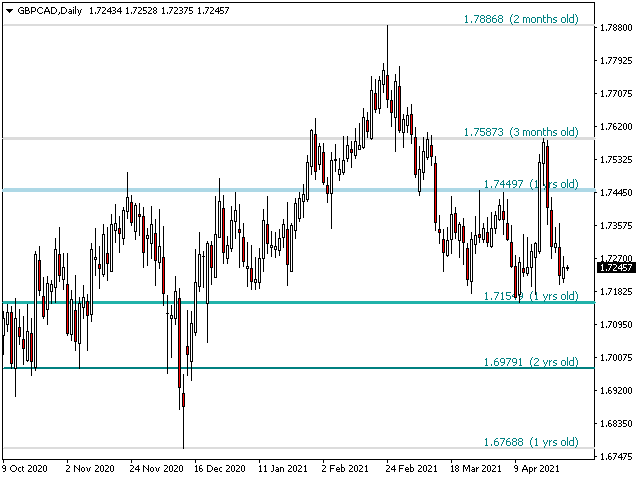
Sind Sie es leid, Unterstützungs- und Widerstandslinien zu zeichnen? Der Unterstützungswiderstand ist ein Multi-Zeitrahmen-Indikator, der Unterstützungs- und Widerstandslinien mit einer sehr interessanten Wendung automatisch erkennt und zeichnet: Wenn das Preisniveau im Laufe der Zeit getestet wird und seine Bedeutung zunimmt, werden die Linien dicker und dunkler.
[ Installationsanleitung | Update-Anleitung | Fehlerbehebung | FAQ | Alle Produkte ]
- Steigern Sie Ihre technische Analyse über Nacht
- Erkennen Sie wichtige Kursniveaus, ohne die Charts zu durchsuchen
- Erkennen Sie die relative Stärke aller Preisniveaus auf einen Blick
- Sparen Sie bis zu einer halben Stunde beim Zeichnen von Linien für jeden Trade
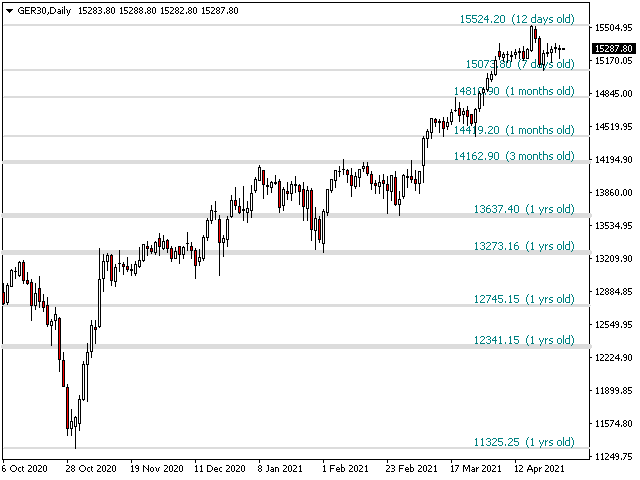
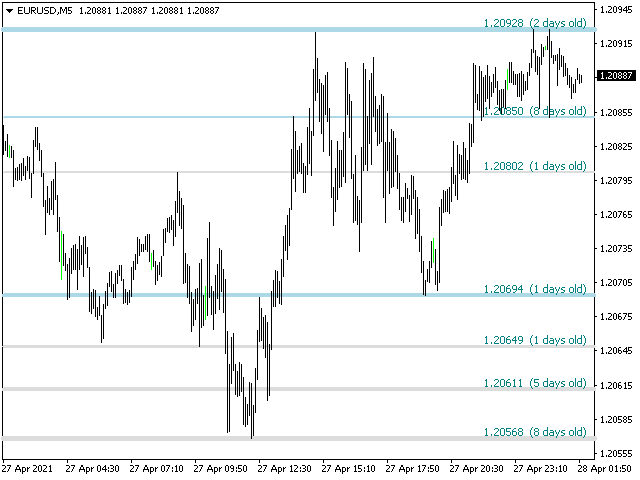
- Der Indikator zeigt das Alter aller Preisstufen an
- Der Indikator ist nicht neu lackiert
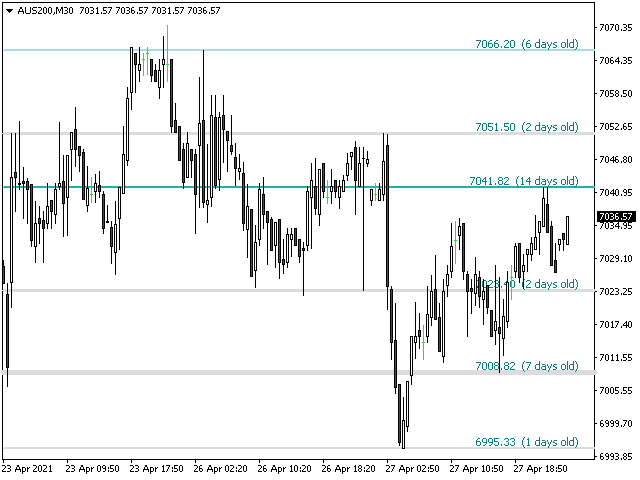
Vergangene und gegenwärtige Preisniveaus werden durch die Nähe zusammengebrochen und an die aktuellen Marktbewegungen angepasst. Linien werden dort gezogen, wo die Aktion stattfindet, und nicht unbedingt an den Spitzen.
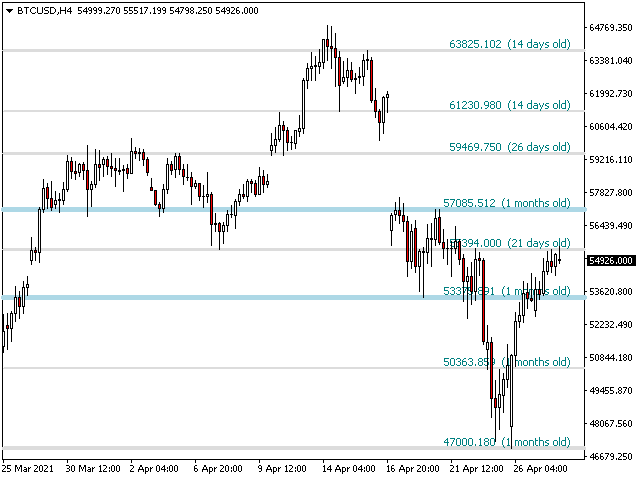
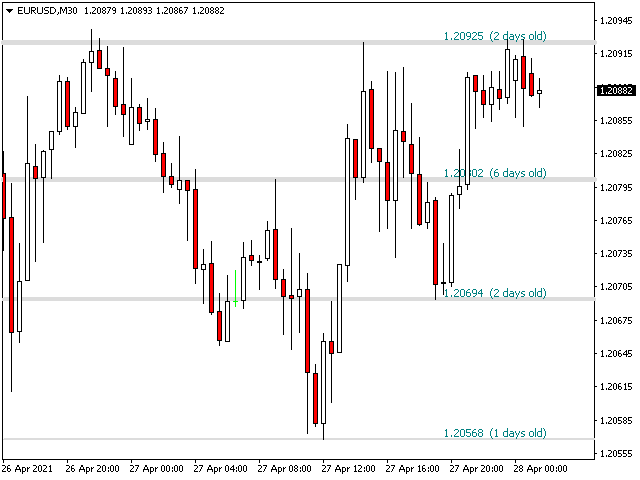
- Das Preisniveau wird dunkler und breiter, wenn es mit der Zeit abgelehnt wird
- Unwichtige Preisniveaus werden regelmäßig gelöscht, um Lärm zu vermeiden
- Anpassbare Zeitrahmenauswahl und Kollapsfaktor
- Es implementiert E-Mail- / Sound- / Push-Warnungen für Ausbrüche
Eingabeparameter
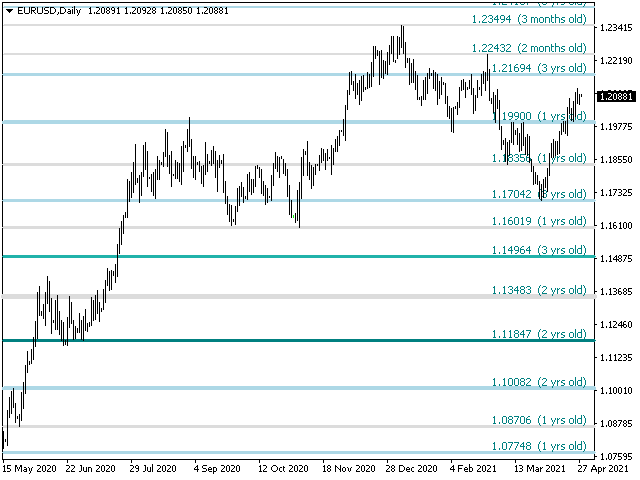
- Indikatoreinstellungen: Der Indikator liest den Preis aus dem aktuellen Zeitrahmen, aber Sie können optional einen anderen auswählen. Beispielsweise können Sie D1-Unterstützungs- und Widerstandslinien in H4-Diagrammen anzeigen. Sie können auch mithilfe des Dichteparameters für das Preisniveau festlegen, wie viele Preisniveaus im Diagramm angezeigt werden sollen.
- Farbeinstellungen: Geben Sie je nach Wichtigkeit die gewünschten Farben für die Unterstützungs- und Widerstandslinien ein.
- Beschriftungseinstellungen: Optional können in der Anzeige Beschriftungen angezeigt werden, die das Alter der einzelnen Unterstützungs- und Widerstandslinien anzeigen. Dies ist standardmäßig deaktiviert. Sie können die Schriftart und -größe des Etiketts auswählen.
- Warnungen: Aktivieren Sie Anzeige- / E-Mail- / Push- / Sound-Warnungen für Ausbrüche.
Autor
Arturo López Pérez, privater Investor und Spekulant, Softwareentwickler und Gründer von Point Zero Trading Solutions.
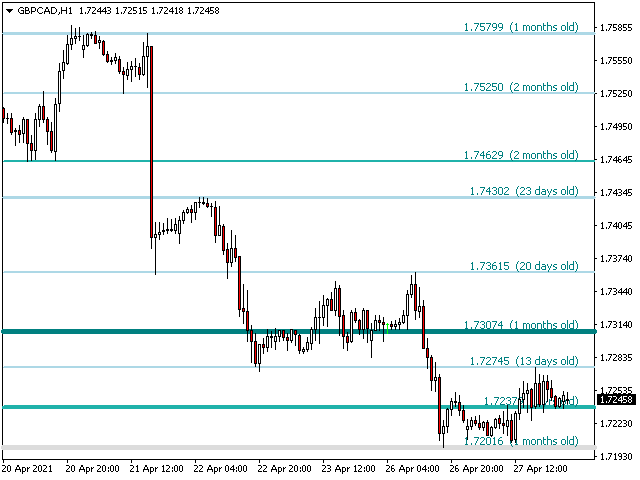
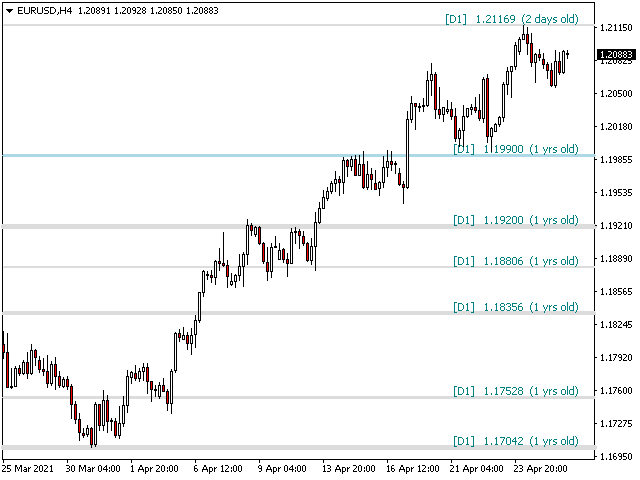


At D1 it works quite well.