Смотри обучающее видео по маркету на YouTube
Как купить торгового робота или индикатор
Запусти робота на
виртуальном хостинге
виртуальном хостинге
Протестируй индикатор/робота перед покупкой
Хочешь зарабатывать в Маркете?
Как подать продукт, чтобы его покупали
Технические индикаторы для MetaTrader 5 - 5

The Expert Advisor for this Indicator can be found here: https://www.mql5.com/en/market/product/115445 The Break of Structure (BoS) and Change of Character indicator is a powerful tool designed to identify key turning points in price movements on financial charts. By analyzing price action, this indicator highlights instances where the market shifts from a trend to a potential reversal or consolidation phase.
Utilizing sophisticated algorithms, the indicator identifies breakouts where the str
FREE

Fair Value Gaps (FVG) and Liquidity Voids are price ranges you can exploit for better entries and exits on your trades. They're similar concepts, so let's look at them from the top and break it down. Think of FVG and Liquidity voids as soft-spots in the market. They are paths of least resistance. That doesn't mean price will go through them, but price could go through them more easily.
To find and locate it is easy but tidiest to repeat the same thing all over again. This helps to boost your
FREE

Индикатор "Sniper MACD" представляет собой улучшенную версию классического индикатора MACD, оптимизированную с использованием нескольких методов для достижения максимальной эффективности торговли. Этот индикатор обладает дополнительной фильтрацией и несколькими уровнями сглаживания, что позволяет получить более точные сигналы. Особенности: Дополнительная фильтрация: Внедрена дополнительная фильтрация для улучшения качества сигналов, что помогает избежать ложных сигналов и повышает точность прог
FREE

Модифицированный осциллятор MACD. Классический индикатор, соединяющий в себе трендовый индикатор с осциллятором для обнаружения точек входа. Имеет мультитаймфреймовую панель, а также 3 типа уведомлений
Преимущества:
Работает на всех инструментах и таймсериях Трендовый индикатор с осциллятором для входов Мультипериодная панель на всех таймфреймах Подключаемые стрелки при появлении сигналов Три типа уведомлений: push, email, alert
MT4 версия -> ЗДЕСЬ / Наши новости -> ЗДЕСЬ
Как работат
FREE

Introduction
The Bounce Zone indicator is a cutting-edge non-repainting technical tool built to identify key areas on the price chart where market sentiment is likely to cause a significant price reversal. Using advanced algorithms and historical price data analysis, this indicator pinpoints potential bounce zones. Combined with other entry signal, this indicator can help forex traders place the best trades possible
Signal
A possible buy signal is generated when price is in the green zo
FREE

"Hunttern harmonic pattern finder" base on the dynamic zigzag with the notification and prediction mode
This version of the indicator identifies 11 harmonic patterns and predicts them in real-time before they are completely formed. It offers the ability to calculate the error rate of Zigzag patterns depending on a risk threshold. It moreover sends out a notification once the pattern is complete.
The supported patterns:
ABCD BAT ALT BAT BUTTERFLY GARTLEY CRAB DEEP CRAB CYPHER SHARK THREE
FREE

This indicator automatically identifies demand and supply zones on a number of 1000 candles or more, and you can change that number of settings.
It also carries a high level of accuracy in describing the type of each zone, as it contains:
Weak areas .
Untested areas . Strong areas . Role-taking areas . Areas tested + number of times visited . Areas to which a return is expected, depending on the direction . The indicator contains alert zones.
For signals and more free indicators, you ca
FREE

For those who struggle with overbloated Volume Profile/Market Profile indicators, here is a solution that contains only the Point of Control (POC) information. Super-fast and reliable, the Mini POC indicator presents this vital information visually within your chart. Totally customizable in splittable timeframes, type of Volume, calculation method, and how many days back you need.
SETTINGS Timeframe to split the POCs within the day. Volume type to use: Ticks or Real Volume. Calculation method
FREE

Торговля пивотами:
1.pp pivot
2. r1 r2 r3, s1 s2 s3
Necessary for traders: tools and indicators Waves automatically calculate indicators, channel trend trading Perfect trend-wave automatic calculation channel calculation , MT4 Perfect trend-wave automatic calculation channel calculation , MT5 Local Trading copying Easy And Fast Copy , MT4 Easy And Fast Copy , MT5 Local Trading copying For DEMO Easy And Fast Copy , MT4 DEMO Easy And Fast Copy , MT5 DEMO
Сотрудничество QQ: 556024 "
Со
FREE

Flag Pattern pro is a Price Action (PA) analytical tool that scans the continuation patterns known as "Flag and Pennant Patterns" .
Flag and Pennant patterns are continuation patterns characterized by a move in a previous trend direction after a shallow retracement usually below 50% of the original move . Deep retracements can however be sometimes found at the 61.8 % levels. The original move is know as the flag pole and the retracement is called the flag.
Indicator Fun

Этот индикатор находит и отображает фигуры технического анализа "Двойное дно" и "Двойная вершина". Сигнализирует (выводит сообщение на экран), если фигура была сформирована недавно. Часто после появления этих паттернов, тренд поворачивает обратно или происходит коррекция. Чтобы не искать их самостоятельно, или не пропустить их появления, достаточно добавить индикатор на график. Индикатор можно использовать на разных таймфреймах и валютных парах, есть настройки для лучшего поиска на определённой
FREE

Ace Supply Demand Zone Indicator The concept of supply demand relies on the quantity mismatching between buying and selling volumes in the financial market. Supply and demand zone can provide the good entry and exit. A zone is easier to trade than a line. The supply demand zone can provide the detailed trading plan and the risk management. Its ability to predict market direction is high. There are two distinctive points about Ace Supply Demand Zone Indicator. Ace Supply Demand Zone indicator was
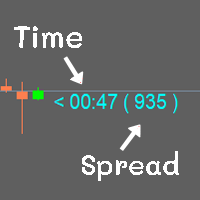
Show the time of candlesticks and spread. All data will be displayed in a rod. Can change color Can fix the size as needed
MT4 : Link https://www.mql5.com/en/market/product/102742 MT5 : Link https://www.mql5.com/en/market/product/102834
Most free code on various websites I didn't write it myself. I only do a little bit.
If you like it, please give 5 stars with it. Thank you.
FREE

Хотите стать постоянно прибыльным 5-звездочным трейдером Форекс? 1. Прочитайте базовое описание нашей простой торговой системы и ее масштабное обновление в 2020 году 2. Отправьте скриншот вашей покупки, чтобы получить персональное приглашение в наш эксклюзивный торговый чат .
Маяк - это удивительно точный и надежный индикатор поддержки и сопротивления.
Он отображает наиболее важные торговые уровни и рисует их в соответствии с их актуальностью.
Если уровень явно пробит, он меня

With Fixed Range Volume Profile,The traces left by the big players will not go unnoticed by you.
Professional Volume Profile Indicator reveals Institutional order flow. This advanced market indicator will teach you to spot the buying and selling. Dont want to say more because its well known by most professionals trader. This Indicator : - Quickly Identify the Strongest Institutional S/R Zones. - W orks with all Trading Instruments (Forex, Futures, Indexes, Commodities, Stocks, Cryptocur
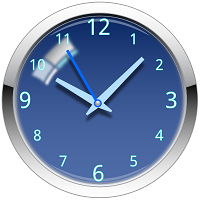
Introduction to the Candle Time Indicator The Candle Time Indicator for MetaTrader 5 (MT5), helps users know how much time on a candlestick is remaining. This is a simple but incredibly powerful and useful tool. To download the Dagangduit CandleTimer.ex5 indicator, check the bottom of this post. It’s one of the best forex time indicators in its category. The function of the indicator will not change, even if you change the name of the indicator. The candlestick countdown timer will tell you how
FREE

Усовершенствованная Мультитаймфреймовая версия скользящей средней Хала (Hull Moving Average - HMA). Особенности
Две линии индикатора Халла разных таймфреймов на одном графике. Линия HMA старшего таймфрейма определяет тренд, а линия HMA текущего таймфрейма - краткосрочные ценовые движения. Графическая панель с данными индикатора HMA на всех таймфреймах одновременно. Если на каком-либо таймфрейме HMA переключил свое направление, на панели отображается вопросительный или восклицательный знак с тек

Renko is a well-known Japanese charting technique that removes time from the chart. Instead of drawing bars in constant intervals (time) as a normal chart would, a Renko chart does so only when price moves beyond a predefined amount.
In a Renko chart, a bar is created when price exceeds the previous bar’s high or low by a predefined amount or what we call the Box Size. The result is a chart with equally sized bars running up or down in 45 degree angles. Such a chart offers the following advant

FOR CRASH 500 ONLY!! MT5
*This is a smooth heiken ashi setup meant to be used on CRASH 500 in combination with other indicators. *You are welcome to test it on other markets aswell. *I will be posting other indicators aswell to help with trading the crash 500 market. *You can use this to help smooth out price if you do struggle with reading the charts as is. * Just note heiken ashi doesnt represent real price action only smoothes it out for ease of read.
FREE

The indicator works to convert normal volume into levels and determine financial liquidity control points.
It is very similar in function to Fixed Volume Profile.
But it is considered more accurate and easier to use than the one found on Trading View because it calculates the full trading volumes in each candle and in all the brokers present in MetaTrade, unlike what is found in Trading View, as it only measures the broker’s displayed prices.
To follow us on social media platforms:
tel
FREE

This is just a MACD with multi symbols, multi timeframes, and multi colors. features. different symbols and timeframes from the main chart. draw main line, signal line, and histogram. each line can be erased. the ascent and descent can be distinguished. Due to the above features, this MACD is suitable for multiple lineups in a single chart. This can be used in the same way as MiniCandles.
FREE

Индикатор Renko Chart позволяет отображать графики "ренко" в окне индикатора. Тип графиков "ренко" показывает лишь движения цены, большие заданного (box size). Он помогает устранить шум и сосредоточиться на основных трендах.
При построении графика время не учитывается, используются лишь ценовые движения. По этой причине графики "Ренко" не похожи на графики цены.
Индикатор работает в 2 режимах: CLOSE - при построении графика "ренко" используются только цены Close; HIGH_LOW - при построении граф
FREE

Time Session OPEN-HIGH-LOW-CLOSE This Indicator Will Draw Lines Of OHLC Levels Of Time Session Defined By User. It Will Plot Floating Lines On Current Day Chart. Time Session Can Of Current Day Or Previous Day. You Can Plot Multiple Session Lines By Giving Unique ID To Each Session. It Can Even Show Historical Levels Of Time Session Selected By User On Chart To Do Backdating Test. You Can Write Text To Describe The Lines.
FREE

The Breakout Indicator That Has Been Proven & Tested! Breakout Analyzer uses an advanced algorithm based on high probability price patterns. Each trade is analyzed on the statistics panel to help you evaluate the best breakout setups.
Bonus Strategy 1
Breakout Analyzer with Volume Critical Watch Video: (Click Here)
Bonus Strategy 2
Breakout Analyzer with Strength Meter
Watch Video: (Click Here)
Features Universal compatibility to different trading systems Analyzes statistics of breako

This is Wilder's ADX with cloud presentation of DI+ & DI- lines. Features
4 standard lines of the ADX indicator: DI+, DI-, ADX, ADXR cloud presentation of DI+/DI- lines with transparent colors applicable to all time-frames and all markets
What Is ADX
J. Welles Wilder Jr., the developer of well-known indicators such as RSI, ATR, and Parabolic SAR, believed that the Directional Movement System, which is partially implemented in ADX indicator, was his most satisfying achievement. In his 1978 boo
FREE

Easy Trend , as the name implies, is an indicator that easily shows the prevailing trend by bringing several indicators into one. The strategy is: when all indicators point in the same direction a signal is triggered. When red, is a signal to sell, when blue, signal to buy. It is that simple :) There are a total of 9 indicators: Moving Average, RSI, CCI, Parabolic SAR, William's Range, Stochastic, MACD, ADX and Heiken Ashi. It is possible to configure each of these indicators to suit your way of

Engulfing Candle Detector
Detectable pattern Double Candlestick Patterns Bullish Engulfing
The first candle is black candle. The second candle opens with a gap below the real body of the black candle but rallies upwards to close above the real body of the black candle. In other words, the second candle's real body completely engulfs the first candle's real body Bearish Engulfing
The first candle is white candle. The second candle opens with a gap above the real body of the white candle but
FREE

YOU CAN NOW DOWNLOAD FREE VERSIONS OF OUR PAID INDICATORS . IT'S OUR WAY OF GIVING BACK TO THE COMMUNITY ! >>> GO HERE TO DOWNLOAD
More About Advanced Currency Meter Every good forex system has the following basic components: Ability to recognize the trend direction. Ability to identify the strength of the trend and answer the basic question Is the market trending or is it in a range? Ability to identify safe entry points that will give a perfect risk to reward (RR) ratio on every position
FREE

Скринер поддержки и сопротивления находится в одном индикаторе уровня для MetaTrader, который предоставляет несколько инструментов внутри одного индикатора. Доступные инструменты: 1. Скринер структуры рынка. 2. Зона бычьего отката. 3. Зона медвежьего отката. 4. Ежедневные опорные точки 5. еженедельные опорные точки 6. ежемесячные опорные точки 7. Сильные поддержка и сопротивление, основанные на гармоническом паттерне и объеме. 8. Зоны уровня берега. ПРЕДЛОЖЕНИЕ ОГРАНИЧЕННОЕ ВРЕМЯ: Индикатор подд

Necessary for traders: tools and indicators Waves automatically calculate indicators, channel trend trading Perfect trend-wave automatic calculation channel calculation , MT4 Perfect trend-wave automatic calculation channel calculation , MT5 Local Trading copying Easy And Fast Copy , MT4 Easy And Fast Copy , MT5 Local Trading copying For DEMO Easy And Fast Copy , MT4 DEMO Easy And Fast Copy , MT5
DEMO
砖图 Renko PRO->>>
The display of the brick map on the main map.
The Renko chart ideal
FREE

Это четкий индикатор для оценки максимумов и минимумов, и он хорошо работает для колеблющегося рынка.
Акционная цена 49$ → 59$
функции хорошо оценивает верх и низ Без перерисовки, без дрейфа Быстрый расчет, без задержек Богатый режим напоминания Можно настроить несколько параметров и цветов
параметр "======== Главная ========" HighLowPeriod1 = 9 HighLowPeriod2 = 60 HighLowPeriod3 = 34 HighLowEMAPeriod = 4 MASignalPeriod = 5 "======== Уведомить ========" UseAlertNotify = истина; UseMetaQuo

Симметричный треугольный паттерн представляет собой период сокращения и консолидации, прежде чем цена вынуждена совершить прорыв вверх или пробой. Пробой нижней линии тренда указывает на начало нового медвежьего тренда, а прорыв верхней линии тренда указывает на начало нового бычьего тренда.
Версия MT4 доступна здесь: https://www.mql5.com/en/market/product/68709/
Этот индикатор идентифицирует эти паттерны и предупреждает вас, когда формируются 4 ключевые точки и цена снова возвращается в тр
MT4 Version Available Here: https://www.mql5.com/en/market/product/43528
Telegram Channel & Group : https://t.me/bluedigitsfx
V.I.P Group Access: Send Payment Proof of any of our Paid Products to our Inbox
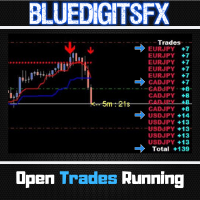
Recommended Broker: https://eb4.app/BDFXOsprey * The Most Sought After Pip Counter for Metatrader ! Features
Will show Currency Symbol in BLUE for Buy positions. Will show Currency Symbol in RED for Sell positions. Will Show pips in BLUE Color for Positive Pips Will Show pips in
FREE

Structure Blocks: a structured way to analyze market structure
This indicator is for you if you are a price action or smart money concept trader. It identifies market trends' ultimate highs and lows and intermediaries' swing lows and highs. It adjusts based on candles' body where most of the volume is, disregarding wicks. Need help or have questions? I am Lio , don't hesitate to reach out! I am always available to respond, help, and improve. How it works:
Each block consists of a move wit
FREE

ADX индикатор используется для определения тренда и его силы. Направление цены показывают значения +DI и -DI, а величина ADX показывает силу тренда. Если +DI находится выше -DI, то на рынке восходящий тренд, если же наоборот, то нисходящий. Если ADX ниже 20 то на рынке нет определенного движения. Как только индикатор пробивает этот уровень, начинается средней силы тренд. Значения выше 40 говорит о наличии сильной тенденции, будь то нисходящей или восходящей.
Мультивалютный и мультитаймфреймо
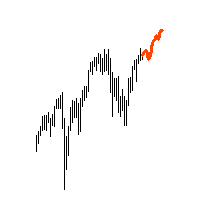
"AV Forecast MT5" is a preview or forecast indicator for MetaTrader 5, which draws forecast future price changes on the chart based on historical data. To do this, it primarily uses the everyday rhythm and the seasonality of the year. For timeframes below H1 closer dates can be selected. The lines for calculation can be made visible.
Settings:
- Draw line for x candles: draw x candles in the future
- Show all lines: yes/no
- Look back years or mixed (> H1 same): one year back or less b

KT Momentum Arrows Indicator is based on a momentary breakout which is calculated using the bands deviation and emerging volatility in a certain direction. A buy signal is generated when the price closes above the upper band and a sell signal is generated when the price closes below the lower band. A magnitude coefficient is used as the input which affects the band deviation and volatility at the same time. The coefficient value should be carefully selected and analyzed based on the instrument a

BUY INDICATOR AND GET EA FOR FREE AS A BONUS + SOME OTHER GIFTS! ITALO LEVELS INDICATOR is the best levels indicator ever created, and why is that? Using high volume zones on the market and Fibonacci the Indicator works on all time-frames and assets, indicator built after 7 years of experience on forex and many other markets. You know many levels indicators around the internet are not complete, does not help, and it's difficult to trade, but the Italo Levels Indicator is different , the Ital

This Engulfing Candle Indicator as the name implies can detect engulfing candlestick patterns on the chart. The indicator alerts the user of the presence of an engulfing candle (Bearish engulfing candle and Bullish engulfing candle) by using visual representation of arrows on the chart. - Blue arrow for Bullish engulfing - Red arrow for Bearish engulfing Extra modifications can be added based on request.
FREE

A scalping indicator based on mathematical patterns, which on average gives signals with relatively small SL, and also occasionally helps to catch big moves in the markets (more information in the video)
This indicator has three main types of notifications: The first type warns of a possible/upcoming signal on the next bar The second type indicates the presence of a ready signal to enter the market/open a position The third type is for SL and TP levels - you will be notified every time price r

Range Bars для MetaTrader 5 - это уникальный инструмент для проведения технического анализа непосредственно на графиках, так как индикатор накладывается на основной график, а рейндж-бары рассчитываются с использованием реальных тиковых данных. Трейдеры могут устанавливать и модифицировать ордера прямо на графике рейндж-баров (даже при использовании торговли в один клик) Кроме рейндж-баров данный индикатор также включает в себя наиболее часто используемые инструменты технического анализа, которым

Индикатор отображает линии пивот, уровни максимума, минимума и закрытия предыдущего дня, а также минимум и максимум предыдущего часа. Нужно просто установить этот индикатор на график, чтобы отобразить все эти важные линии, нет необходимости настраивать множество отдельных индикаторов.
Почему важны определенные линии Максимум и минимум предыдущего дня : эти уровни используются для торговли на дневном графике. Очень часто, если цена становится выше или ниже минимума/максимума предыдущего дня, пр
FREE

(Перевод Google) Стандартное представление свечи Heikin Ashi имеет значение открытия, эквивалентное экспоненциальному показателю. Скользящее среднее (EMA) от Общей цены , из которых альфа значение EMA является фиксированным с периодом 0,5 (эквивалентно периоду EMA 3,0). В этой динамической версии период может быть изменен на любое значение, которое вы хотите использовать, что также позволяет приблизительный анализ нескольких таймфреймов или используйте минимальное или максимальное значение в кач
FREE

Этот мультииндикатор / осциллятор (далее индикатор), мульти-таймфрейм и мультисимвольный индикатор определяет, когда происходит расхождение между ценой и одним, двумя или тремя индикаторами. Он определяет как обычные / классические (разворот тренда), так и скрытые (продолжение тренда) дивергенции. Он имеет опции фильтра тренда RSI и MA, что позволяет отфильтровать только самые сильные настройки. В сочетании с вашими собственными правилами и методами этот индикатор позволит вам создать (или улучш

non-repaint free MT5 technical indicator works on all timeframes 1 minute to the monthly timeframe the trade vision buy and sell arrow is a multi currency and synthetic indicator Trade vision buy and sell arrow comes with Push Alerts purple arrow look for selling opportunities white arrow look for buying opportunities. wait for candle to close and arrow to appear before taking any trades.
FREE

Boom and crash Gold Miner v2 trend histogram which works in conjunction with the indicator above that has arrows as shown in the video. PLEASE Note: That the top indicator and the bottom indicator are two separate indicators. the top indicator is https://www.mql5.com/en/market/product/98066 the bottom one is free. which is the histogram at the bottom. the trend histogram trading tool that helps to easy detect the trend blue color indicates an uptrend. Orange color is a down trend.
FREE

Индикатор Accurate Gold - это удобный инструмент, который интуитивно понятен и прост в использовании, независимо от уровня опыта трейдера. Он предназначен для трейдеров, ищущих точные сигналы на временном интервале M5 на рынке золота. Этот индикатор использует передовые математические алгоритмы для анализа движения цен и динамики объема, генерируя точные сигналы на покупку и продажу. Отличительные особенности этого индикатора, включая его нерепейнтовый характер, предоставляют трейдерам ценны

OBV MACD
Calculating MACD based on OBV data Features
3 outputs: MACD & Signal & Histogram 4 Colored Histogram Smoothing factor show/hide option for MACD & Signal lines Description
Among the few indicators developed for working with volume data, OBV (On Balance Volume) is the simplest yet most informative one. Its logic is straightforward: when the closing price is above the previous close, today's volume is added to the previous OBV; conversely, when the closing price is below the previous cl
FREE

This is a conventional volume indicator, which displays the ticks or real volume (if available from your broker). But it has others features like: 5 color schemes: single, when crossing with moving average, when crossing a specific level, when having different volume between bars and when candle change color. Being hable to have a customizable moving average. Being hable to have a value indicator line. Many thanks to Diego Silvestrin for the ideas to version 1.1 and Konstantin Demidov for
FREE

Оптимизируйте свои торговые решения с помощью нашего индикатора силы и настроения рынка и больше не торгуйте против тренда!
Тщательно разработанный для серьезных трейдеров, которые ценят точную и своевременную информацию, наш индикатор предоставляет обзор 28 основных пар с высоты птичьего полета в очень простой форме. Этот инструмент способен ранжировать валютные пары по популярности, силе бычьего или медвежьего тренда и проценту покупателей и продавцов / версия MT4 .
Особенности Сил

Индикатор анализирует шкалу объёмов и разделяет её на две компоненты - объёмы продавцов и объёмы покупателей, а также вычисляет дельту и кумулятивную дельту. Индикатор не мерцает и не перерисовывает, вычисления и отрисовку производит достаточно быстро, используя при этом данные с младших (относительно текущего) периодов. Режимы работы индикатора переключаются с помощью входной переменной Mode : Buy - отображает только объёмы покупателей. Sell - отображает только объёмы продавцов. BuySell - отобр
FREE

Особенности
Индикатор для проверки объема по цене. В основном работает для EURUSD, на других валютных парах может не работать или расчет займет много времени. Для плавного использования включите опцию "Сдвинуть правую границу графика от правой границы", как показано на скриншоте. При появлении новой бара данные сбрасываются.
Переменные COlOR: Настройка цвета индикатора WIDTH: Настройка ширины индикатора PERIOD: Определение периода времени для расчета данных
FREE

Свинг-трейдинг - это первый индикатор, предназначенный для обнаружения колебаний в направлении тренда и возможных разворотов. Он использует базовый подход свинговой торговли, широко описанный в торговой литературе. Индикатор изучает несколько векторов цен и времени для отслеживания направления совокупного тренда и выявляет ситуации, когда рынок перепродан или перекуплен и готов к исправлению. [ Руководство по установке | Руководство по обновлению | Устранение неполадок | FAQ | Все продукты ]

Это очень простой индикатор, которым может пользоваться каждый. Тем не менее, это очень наглядно, полезно и эффективно. Он подходит для каждого символа Форекс и любого таймфрейма. Но из своего тестирования и исследования, я не рекомендую использовать его с таймфреймами М1, М5, М15.
Параметр.
- Выберите оповещение Вкл/Выкл (по умолчанию ВКЛ).
- Выберите время (секунды) между 2 предупреждениями. По умолчанию 30 секунд
Как это работает?
- Восходящий тренд — когда цвет бара зеленый. - Нис
FREE

Full implementation of Directional Movement System for trading, originally developed by Welles Wilder, with modifications to improve profitability, to reduce the number of unfavorable signals, and with Stop Loss lines.
No re-paint
Features
Buy/sell signals displayed on the chart Stop levels visually indicated on the chart Profit-taking points presented in the indicator window Exit points for unfavorable positions presented in the indicator window Signal confirmation through high/low swing c

Volumes with Moving Average - это простой и понятный индикатор объема, дополненный скользящей средней. Как использовать? Хорошо подходит для фильтрации сигналов при входе в сделку как от уровней поддержки/сопротивления, так и при прорывах волатильности трендовых каналов. Так же может являться сигналом на закрытие позиции по объему. Входные параметры: Volumes - объем реальный или тиковый. MA_period - период скользящей средней.
FREE

The Expert Advisor for this Indicator can be found here: https://www.mql5.com/en/market/product/115567 The Contraction/Expansion Breakout Lines with Fair Value Gaps (FVGs) Indicator for MetaTrader 5 (MT5) is a powerful technical analysis tool designed to help traders identify and visualize breakouts at critical levels of contraction and expansion in financial markets. By incorporating Fair Value Gaps (FVGs), this indicator enhances traders' ability to gauge market sentiment and anticipate poten
FREE

Metatrader 5 version of the famous Andre Machado's Tabajara indicator. If you don't know Andre Machado's Technical Analysis work you don't need this indicator... For those who need it and for those several friend traders who asked this porting from other platforms, here it is...
FEATURES
8-period Moving Average 20-period Moving Average 50-period Moving Average 200-period Moving Average Colored candles according to the inflexion of the 20-period MA
SETTINGS You can change the Period of all M
FREE

VR Sync Charts это утилита для синхронизации разметки между окнами. ИНДИКАТОР НЕ РАБОТАЕТ В ТЕСТЕРЕ СТРАТЕГИЙ!!! Как получить триал версию с тестовым периодом, инструкции, обучение читайте в блоге https://www.mql5.com/ru/blogs/post/726504 . С помощью VR Sync Charts Ваши трендовые урони, горизонтальные уровни, разметка Фибоначчи будут синхронизированы со всеми графиками. Утилита позволяет синхронизировать все стандартные графические объекты в терминале MetaTrader, все Ваши тренды, линии Ганна, и

Spike Catch Pro 22:03 release updates Advanced engine for searching trade entries in all Boom and Crash pairs (300,500 and 1000)
Programmed strategies improvements Mx_Spikes (to combine Mxd,Mxc and Mxe), Tx_Spikes, RegularSpikes, Litho_System, Dx_System, Md_System, MaCross, Omx_Entry(OP), Atx1_Spikes(OP), Oxc_Retracement (AT),M_PullBack(AT) we have added an arrow on strategy identification, this will help also in the visual manual backtesting of the included strategies and see h
FREE

The indicator shows bullish and bearish divergence. The indicator itself (like regular stochastic) is displayed in a subwindow. Graphical interface : In the main window, graphical objects “trend line” are created - produced from the “Low” price to the “Low” price (for bullish divergence) and produced from the “High” price to the “High” price (for bearish divergence). The indicator draws in its window exclusively using graphic buffers: “Main”, “Signal”, “Dot”, “Buy” and “Sell”. The "Buy" and "

This indicator builds upon the previously posted Nadaraya-Watson Estimator. Here we have created an envelope indicator based on kernel smoothing with integrated alerts from crosses between the price and envelope extremities. Unlike the Nadaraya-Watson Estimator, this indicator follows a contrarian methodology. Please note that the indicator is subject to repainting. The triangle labels are designed so that the indicator remains useful in real-time applications.
Settings
Window Size: Dete

Ichimoku Trend Alert is the Ichimoku Kinko Hyo indicator with Alerts and signal filters.
Ichimoku Trend Alert features: Optional check of Ichimoku cloud, Tenkan sen(Conversion Line), Kijun sen(Base Line), Senkou span A, Senkou span B, and Chikou span relative to price, and more. Popup, email, and phone notification alerts for selected symbols and timeframes.
There are 9 classic Ichimoku trend filters you can enable/disable in settings: Price/Cloud Order: Checks the price position relative
FREE

This indicator finds Three Drives patterns. The Three Drives pattern is a 6-point reversal pattern characterised by a series of higher highs or lower lows that complete at a 127% or 161.8% Fibonacci extension. It signals that the market is exhausted and a reversal can happen. [ Installation Guide | Update Guide | Troubleshooting | FAQ | All Products ] Customizable pattern sizes
Customizable colors and sizes
Customizable breakout periods Customizable 1-2-3 and 0-A-B ratios
It implements visua
FREE

Documentation for connecting Metatrader 5 with Python with a simple drag and drop EA.
A full end-to-end solution ,fully tested ,fast and efficient!
The Pytrader ecosystem consists of a python script and a MT5 or MT4 version EA.
Further for the licensing an indicator is used.
The communication between the python script and the EA is based on sockets.
EA is the Server and the python script the Client .
It is always query(function / python script) and output(data / serv

Мультивалютный и мультитаймфреймовый индикатор ZigZag. Отображает текущее направление рынка, высоту последнего движения, количество баров в этом движении и пробитие предыдущей точки ЗигЗага.
В параметрах вы можете указать любые желаемые валюты и таймфреймы. Также панель может отправлять уведомления при изменении направления ЗигЗага или когда произошел пробой предыдущей точки. По клику на ячейке с периодом будет открыт данный символ и период.
Параметры Depth — минимум свечей, на котором инди

This indicator is very useful for day traders or short term traders. (MT5 version) No need to calculate the number of pips manually, just look at the chart and you will see the Virtual Take Profit / Virtual Stop Loss target line and evaluate whether the entry point is feasible to reach the intended target or not.
Enter the intended Take Profit / Stop Loss pips for your trade. The indicator will display Virtual Take Profit / Virtual Stop Loss lines for you to easily see if the target i
FREE
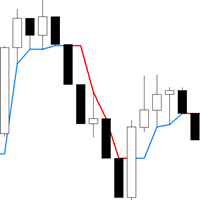
Trend following indicator to assist you in trend trading , analysis or risk management. Non Repainting and works on all timeframes. Robust alert system Benefits: Never redraws the results, the signal is strictly at the close of the candle It can be used in an adviser A great addition to a trading strategy or an independent strategy Market noise filtering algorithm Suitable for any tools Why chose for MetaTrader 5 : Enhanced Precision : Utilize accurate trend analysis to enhance your trading dec
FREE

Just another Auto Fibonacci Retracement indicator . However, this is the most Flexible & Reliable one you can find for FREE. If you use this indicator and you like it, please leave a review/comment. If you are looking for a more advanced Fibo indicator, check this Free Trend-Based Fibo indicator . ### FEATURES ### Auto-calculate up to 7 Fibonacci levels on your customized frame. Adjust levels as your need. Use High/Low price or Open/Close price to calculate. Freeze the levels and don
FREE

Индикатор VR Donchian - это улучшенный вариант канала Дончиана. Улучшения коснулись практически всех функций канала, но при этом был сохранен основной алгоритм работы и построение канала. В индикатор бала добавлена смена цвета уровней в зависимости от текущей тенденции - это явно показывает трейдеру смену тренда, флета. Была добавлена возможность информировать трейдера о пробитии одного из двух уровней канала на смартфон, электронную почту или в самом терминале MetaTrader. Были добавлены ценовые
FREE
Узнайте, как легко и просто купить торгового робота в MetaTrader AppStore - магазине приложений для платформы MetaTrader.
Платежная система MQL5.community позволяет проводить оплату с помощью PayPal, банковских карт и популярных платежных систем. Кроме того, настоятельно рекомендуем протестировать торгового робота перед покупкой, чтобы получить более полное представление о нем.
Вы упускаете торговые возможности:
- Бесплатные приложения для трейдинга
- 8 000+ сигналов для копирования
- Экономические новости для анализа финансовых рынков
Регистрация
Вход
Если у вас нет учетной записи, зарегистрируйтесь
Для авторизации и пользования сайтом MQL5.com необходимо разрешить использование файлов Сookie.
Пожалуйста, включите в вашем браузере данную настройку, иначе вы не сможете авторизоваться.