Смотри обучающее видео по маркету на YouTube
Как купить торгового робота или индикатор
Запусти робота на
виртуальном хостинге
виртуальном хостинге
Протестируй индикатор/робота перед покупкой
Хочешь зарабатывать в Маркете?
Как подать продукт, чтобы его покупали
Технические индикаторы для MetaTrader 4 - 33
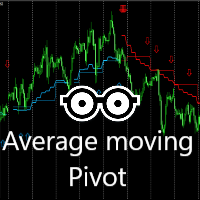
Этот индикатор очень эффективен для повседневной торговли.
Комбинация скользящих средних и расчета 2X Pivots для получения очень убедительного сигнала каждый день.
Синий цвет сигнализирует о возможности покупки. Следуйте стрелкам для возможных точек покупки. Синие опорные точки и средняя линия, служит возможной поддержкой. Красный цвет сигнализирует о возможности продажи. Следуйте стрелкам для возможных точек продажи. Красные точки разворота и средняя линия, служит возможным сопротивлением.
FREE

Индикатор анализирует все символы из окна "Обзор рынка" и выбирает подходящие для торговли. В работе использутся пять наиболее эффективных и популярных индикаторов: Скользящая средняя ADX RSI Parabolic SAR MACD Для анализа рассчитываются два бара. Для работы достаточно запустить индикатор на одном графике. После запуска на графике отображаются блоки с данными по каждому из символов. Если блок окрашивается в коралловый или синий цвет, это указывает на изменение тренда, достаточное для совершения
FREE

TG MTF MA MT5 is designed to display a multi-timeframe moving average (MA) on any chart timeframe while allowing users to specify and view the MA values from a particular timeframe across all timeframes. This functionality enables users to focus on the moving average of a specific timeframe without switching charts. By isolating the moving average values of a specific timeframe across all timeframes, users can gain insights into the trend dynamics and potential trading opp
FREE

The ICT Silver Bullet indicator is inspired from the lectures of "The Inner Circle Trader" (ICT) and highlights the Silver Bullet (SB) window which is a specific 1-hour interval where a Fair Value Gap (FVG) pattern can be formed. A detail document about ICT Silver Bullet here . There are 3 different Silver Bullet windows (New York local time):
The London Open Silver Bullet (3 AM — 4 AM ~ 03:00 — 04:00)
The AM Session Silver Bullet (10 AM — 11 AM ~ 10:00 — 11:00)
The PM Session Silver Bullet

Этот индикатор отображает уровни открытия, максимума, минимума и закрытия предыдущего месяца на нижних таймфреймах текущего месяца.
Эти уровни действуют как хорошие уровни поддержки и сопротивления.
Большую часть времени цена колеблется в пределах уровней.
дождитесь, пока цена достигнет этих уровней и действуйте соответственно.
Обратите особое внимание на слияние уровней.
Согласно моим наблюдениям, если уровень Close (White) находится в слиянии с любыми другими уровнями,
FREE

Set TP and SL like Financial Institutions
Traders' TP expectations do not often occur and their SL often hits when they only rely on primitive indicators like pivot-points and Fibonacci or classic support or resistance areas. There are a variety of indicators for support/resistance levels, whereas they are seldom accurate enough. Classical support/resistance indicators, often present miss levels and are not noteworthy based on current market volatility dynamic. Fibonacci is good but not enou

Принцип работы индикатора.
Индикатор Asummetry позволяет предсказывать начала изменения направления трендов, задолго до их визуального проявления на графике цены. Автором было статистически выявлено , что перед изменением направления тренда функция распределения вероятности цены делается максимально асимметричной, точнее, движение цены в какую-либо сторону всегда вытягивает вбок функцию ее распределения, но когда корень третей степени из асимметрии деленн
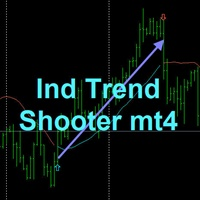
TREND SHOOTER Without alerts
It is a trend indicator based on moving averages that very efficiently calculates changes in market direction.
This has the ability to anticipate changes of direction very early.
FEATURES
This indicator particularly draws two moving averages that are used only to show color changes. they can wear these moving stockings as they wish as they do not affect the color change behavior bullish blue color
bearish red color where the line is interrupted it is not
FREE
REVERSAL FINZEN LEVELS More than a regular indicator is a complete system with Entry levels, Stoploss, AND TakeProfits Levels. This System indicator is Based on Our Private Strategy that has been using During A while with our Private FUNDS, this indicator can be used in stocks, FOREX CFD but mainly use with amazing results in FOREX Markets.
This indicator will detect in some specific levels when market reversal so you try to sell when market is OVERBOUGHT and Sell when market is OVERSOLD wit

SmartStochasticMt4 - универсальный индикатор для принятия торговых решений. Незаменимый инструмент для начинающих трейдеров, так как не имеет настроек и полностью готов к работе после установки.
Преимущества индикатора:
1. Работает с любым торговым символом
2. Работает на любом временном периоде
3. Не имеет настраиваемых параметров
4. Представляет полную картину торговой ситуации с разных временных периодов
5. Не запаздывает
Работа с индикатором
1. Установить индикатор
2. Исключить из
FREE

Smart Mone Liquidity Zone
Overview : Smart Mone Liquidity Zone is a sophisticated MetaTrader 4 indicator meticulously crafted to illuminate crucial liquidity zones on price charts, amplifying traders' capacity to discern optimal trading opportunities. Engineered by Yuri Congia, this indicator empowers traders with profound insights into market dynamics, enabling astute decision-making within various timeframes.
Limited-time Special Opportunity:
Seize the moment! Be among the first 10 (Pu

This indicator idea comes from Tushar Chande called Qstick.
Technical indicators quantify trend direction and strength in different ways.
One way is to use the difference between close and open for each bar and to sum it up over a period of time.
The formual is:
Qstick (period ) = Average ((close-open ), period )
In this indicator, we can choose how to calculate body by two famous chart types. The first and default indicator settings are based on Heiken Ashi chart, and the second i
FREE

Мультивалютный, Мультитаймфреймовый индикатор, позволяющий увидеть тренд основанный на пересечении 2 EMA без дополнительных кликов, он ищет последнее пересечение на всех таймфреймах сразу и пишет в левом верхнем углу в какую сторону направлен тренд открытой валютной пары, а также как давно было последнее пересечение. На основе этого индикатора вы можете открывать ордера если все большинство трендов направлены в 1 сторону и выходить из сделок когда ситуация меняется. Индикатор не рисует на график
FREE
WONNFX iSTATS - information indicator showing profit/loss on your MT4 account (pips, lots, currency, percentage) current profit profit for today profits for the current week profits for the current month profit for the current quarter profit for the current year
A convenient format for displaying statistics of your trading account in real time. (the indicator can be installed on any MT4 terminal chart)
FREE

Индикатор отмечает на графике, в виде прямоугольника, волатильные участки движения цены согласно заданных настроек.
Описание настроек TrendPips - значение фильтра в пунктах TrendBars - значение фильтра в количестве баров signal_shift - сдвиг относительно текущего бара на указанное количество периодов назад, для сигналов CountBars - количество баров для отображения индикатора Color_1 - один из цветов чередования прямоугольников Color_2 - второй цвет прямоугольников Alerts - отображает диалогово
FREE

Necessary for traders: tools and indicators Waves automatically calculate indicators, channel trend trading Perfect trend-wave automatic calculation channel calculation , MT4 Perfect trend-wave automatic calculation channel calculation , MT5 Local Trading copying Easy And Fast Copy , MT4 Easy And Fast Copy , MT5 Local Trading copying For DEMO Easy And Fast Copy , MT4 DEMO Easy And Fast Copy , MT5 DEMO MACD называется скользящей средней конвергенции и расхождения, которая создается на основе дво
FREE

Индикатор анализирует изменение минимальных и максимальных цен предыдущих баров фиксируя вход больших игроков. В случае роста изменения (дельты) на график выводится сигнал в виде стрелки. При этом осуществляется виртуальная торговля на истории. В бесплатной версии виртуальная торговля осуществляется без доливок в случае повторения сигнала. Результаты виртуальной торговли в виде потерь/убытков, прибыльности, просадки и линий сделок выводятся на график цены и в поле комментария.
Параметры Индика
FREE

Система анализа индикаторов ZhiBiJuJi использует мощный внутренний цикл для вызова собственных внешних индикаторов, а затем вызывает анализ до и после цикла. Расчет данных этой системы анализа индикатора очень сложен (вызов до и после цикла), поэтому гистерезис сигнала уменьшается, и достигается точность предварительного прогноза. Этот индикатор может использоваться во всех циклах на МТ4 и наиболее подходит для 15 минут, 30 минут, 1 часа, 4 часов. Купить: Когда появляется линия пурпурный

GMMA indicator that looks like a cloud. The GMMA indicator is easy to read, but to make it even more visually pleasing, we made it look like an Ichimoku Chart cloud. Colors have been changed where short-term and long-term overlap.
My other products https://www.mql5.com/ja/users/studiotam/seller
Please reduce the character limit a bit. I have nothing more to write.
FREE

Реализация импульсной системы, описанной доктором Александром Элдером. Индикатор красит бары в соответствии со следующим паттерном: Скользящая средняя и гистограмма MACD возрастают - зеленый бар, запрещено продавать; Скользящая средняя и гистограмма MACD разнонаправлены - синий бар, запрещение снято; Скользящая средняя и гистограмма MACD убывают - красный бар, запрещено покупать.
Параметры индикатора EMA - Период скользящей средней индикатора MACD Fast - Период быстрой скользящей средней индик
FREE

Variable Index Dynamic Average (VIDYA) developed by Tushar Chande by default is contained in MT5 but not in MT4 platform and it is a dynamic EMA (Exponential Moving Average) that adjusts its Length (LB Period) automatically in response to Market Volatility originally measured through the Chande Momentum Oscillator(CMO). CMO value is used as the ratio to the smoothing factor of EMA ( The New Technical Trader by Tushar Chande and Stanley Kroll, John Wiley and Sons, New York, 1994). The higher th
FREE
Highly configurable Osma indicator.
Features: Highly customizable alert functions (at levels, crosses, direction changes via email, push, sound, popup) Multi timeframe ability Color customization (at levels, crosses, direction changes) Linear interpolation and histogram mode options Works on strategy tester in multi timeframe mode (at weekend without ticks also) Adjustable Levels Parameters:
Osma Timeframe: You can set the lower/higher timeframes for Osma. Osma Bar Shift: Y ou can set
FREE
The Variations Moving Average indicator has eight types of non-standard moving averages.
Double MA - DMA Triple MA - TMA Hull MA - HMA Jurik MA - JMA Adaptive MA - AMA Fractal Adaptive MA - FAMA Volume Weighted MA - VWMA Variable Index Dynamic MA - VIDMA
Works as a trend indicator. Indicator settings Type MA Shift MA Show Trend Period MA Method MA Applied Price MA Color MA
FREE

This indicator is a histogram showing the trend based on 3 different moving averages. When all averages are set in ascending order, the indicator is green, and when in descending order, it is red. If the averages do not show a trend, the color is yellow. Additionally, each average can have different settings, such as Mode MA and Price MA. You can also set an alert and receive notifications on your phone.
To enable the alert and push notification, you need to activate them first in the MT4 setti
FREE

KF Trix V1.00 The triple exponential average (TRIX) indicator is an oscillator used to identify oversold and overbought markets and is also a momentum indicator. The triple smoothing of moving averages is designed to filter out price movements that are considered insignificant or unimportant. About Software details and MQL login link Copyright 2022, Forex KRAL
FREE

FIBO ALERT https://www.mql5.com/en/market/product/34921
This indicator draws a fibonacci retracement (high and low) of a candle. It alerts and notifies the user whenever price touches or crosses the fibonacci levels. INPUTS ON Alert: set to true will alert pop up whenever price crosses levels at chart time frame. ON Push: set to true will send push notification to phone whenever price crosses levels at chart time frame. ===== FIBO (High & Low) ===== Time Frame: indicator draws fibonacci lev
FREE
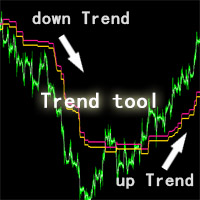
Этот инструмент ZhiBiQuShi подходит для всех сортов и подходит для более 5 минут. Это хороший инструмент для оценки тенденций!
Цена - нисходящий тренд ниже двух линий, а цена - восходящий тренд выше двух линий.
ОПИСАНИЕ НАСТРОЕК
till_breakeven_rate: определяет, насколько близко канал будет следовать за ценой, пока сделка не станет безубыточной. РЕКОМЕНДУЕМ 1 space1: Определяет ширину канала от начала сделки до тех пор, пока прибыль не превысит start_at_pips_profit2. РЕКОМЕНДУЕМ 3-5
FREE

Этот индикатор рассчитывается непосредственно значение индекса доллара по формуле ICE и строит диаграмму, что может помочь вам в качестве справочной информации. Нет необходимости искать брокера, предоставляющего ICE DX дл\ его использования - индикатор сам рассчитывает необходимые значения. Могут быть мелкие расхождения между точными значениями свечи или времени из-за времени закрытия на торговой площадке и разницы знаков после запятой, но в целом индикатор дает хорошую информацию. Необходимо,
FREE

Если вам нравится этот проект, оставьте 5-звездочный обзор. Следуйте на instagram: borelatech Как институционалы торгуют большими объемами, для них не должно пытаться
защищать свою позицию на определенных процентных уровнях. Эти уровни будут служить естественной поддержкой и устойчивостью, которую вы
можете использовать
либо войти в торговлю или быть в курсе возможных опасностей против вашей
позиции. Этот осциллятор покажет вам вариацию процент для: День. Неделя. Месяц. Квартал. Год. В под
FREE

Candle Counter This product counts the candles and shows the result according to the configuration defined by the user. Professional traders use it to emphasize a specific candlestick.
Settings Position - Choose whether the numbers will be displayed above or below the candle Distance - The distance that the number will have from the candle, referring to the minimum or maximum Font Size - Font Size Color - Font Color
FREE

Индикатор High Trend Lite (высокий тренд, простая версия) мониторит 5 символов на 3 таймфреймах одновременно и определяет силу сигнала. Индикатор сообщает, когда происходит совпадение сигналов на разных таймфреймах. При этом индикатор может быть запущен на одном графике. Таким образом, High Trend Lite - это мильтивалютный и мультитаймфреймовый индикатор. С индикатором High Trend Pro , доступным по этой ссылке , у вас будет неограниченное количество символов, 4 таймфрейма, раскрашенный график осн
FREE

Necessary for traders: tools and indicators Waves automatically calculate indicators, channel trend trading Perfect trend-wave automatic calculation channel calculation , MT4 Perfect trend-wave automatic calculation channel calculation , MT5 Local Trading copying Easy And Fast Copy , MT4 Easy And Fast Copy , MT5 Local Trading copying For DEMO Easy And Fast Copy , MT4 DEMO Easy And Fast Copy , MT5 DEMO
The homeopathic indicator is also called the CCI indicator. The CCI indicator was propos
FREE

Just Currency Strength is a simple, and easy to use as a market analysis tool. It could helps trader to understand the broder view of the market and forcasting the movemt of each currency symbol and trend direction of each specific currency pair. Parameters Timeframe (Move Timeframe box to move the pannel) Currency (Must NOT be less than 5 currencies) Refreshtime in second Colors Strong//Weak//Neutrial Alerts setting Alert On/Off Push notification On/Off Happy Trading...
FREE

Hello. Another free indicator from Sepehr! ;) You can determine the trend with this tool. Using crosses of two Moving averages, you can say that the trend is going to be bullish or bearish; A fast-moving average and a slow one. When the fast-moving crosses up the slow-moving, it's going to be an uptrend and when it crosses down the slow-moving, it means that you are going to have a downtrend. That's easy ;) Hope to enjoy it Sepehr(Faran)
FREE

Simple indicator that shows external ( outside ) bars. In certain cases, external bars can be seen as strong trend bars instead of range bars. This can be observed when a with-trend external bar occurs at a reversal from a strong trend. It will help you notice more easily different patterns like - Inside-outside-inside, Inside- Inside -inside, outside - Inside -outside, etc. Works perfectly with my other free indicators Internal bar and Shadows
Inputs: How many history bars to calculate on l
FREE

This indicator will monitor all open trades in the account, no matter how many Symbols there are. It will also show the total lotsize for all open trades, and total Profit & Loss for all open trades. It's a very handy tool when you have multiple open trades for multiple symbols. It's mostly to give you a list view of all your open trades in real time, with real time P&L. It will also give you an idea the total lot size that's used in comparison to the account balance.
FREE

Индикатор пригодится тем, кто использует кластеры Фибоначчи в торговле и применяет построения с разными наборами уровней. Каждый набор уровней применителен как к уровням Retracement , так и к Expansion (выбирается в настройках). Уровни задаются перечислением в формате "0;50;61.8;100". Настройки индикатора: Fibonacci #1 – Набор уровней #1 Fibonacci – Тип уровней : Retracement или Expansion Levels – Набор уровней в формате "0;23.6;38.2;50;61.8;100" Color line – Цвет линии Style line – Стиль линии
FREE

EMA Separation Coefficient отражает разделение между краткосрочным и долгосрочным сопротивлением тренда экспоненциальной скользящей средней, а также направление текущего движения. Обратите внимание на потенциальные точки пересечения при приближении коэффициента к нулю. Это может свидетельствовать о предстоящем пробое или развороте. Ждите подтверждения тренда перед открытием сделки, а выходите, когда коэффициент образует максимум (для колл) или минимум (для пут). Это небольшой инструмент для помо
FREE

Yuri Congia Market Info Indicator
Description: The Yuri Congia Market Info Indicator is a tool for traders, providing a wide range of key data directly on the chart. Developed by Yuri Congia, this indicator offers detailed information on the current price, spread, daily highs and lows, remaining time before candle close, and more. It's an essential tool for traders who want immediate access to crucial information during their trading operations. Join me in the exciting world of financial trad
FREE

Мультитаймфреймовый индикатор RSI с возможностью определения тренда, зон перекупленности и перепроданности, всех пересечений сигнальных линий с разных таймфреймов на одном графике в виде стрелок и звуковых оповещений. Работая со стандартным индикатором RSI, мы можем столкнуться с необходимостью того, что хочется видеть данные сразу со всех необходимых таймфреймов. Поэтому был создан индикатор RSI 7TF . Если вам необходимо иметь возможность получения только звуковых сигналов при пересечении сигна
FREE
Simple Trading System Update !!! Follow this link to see our 2024 Strategy !!! ( Download the EAs scanner)
Deal trading trend indicator is a useful indicator tool predicting the market movement, easy-to-use due to obviously showing trend line, arrow and target point. You can consider the direction of the market for going up or going down by using this indicator. For free version, some function is restricted such as trend line and arrow.
Parameters In this section, we are explaining the ma
FREE

Macd Predictor Macd's main chart indicator If you like this indicator , Dinapoli Levels Expansion and Retracement Demo is a helpful tool: https://www.mql5.com/en/market/product/35884
1. You can determine the price at which the MACD will change from buy to sell, and vice versa. It is the cousin of the oscillator predictor. If you know a position at the time, then the exact price, current and next (future) columns will need to reach the MACD crossover. You can also see how far the market has t
FREE

Supreme Stoploss is an indicator for metatrader 4 that is based on the ATR indicator , it gives stoploss/takeprofit as lines drawn above and below the price , this indicator does not repaint/back paint and is not delayed. can be used to determine the stop loss or take profit of a trade using ATR value multiplied by the number set by user. ====================================================================================================== Parameters : ATR SL period : ATR period identity : leave
FREE

Welcome to the world of trading and technical analysis. In today's fast-paced markets, understanding market sentiment and identifying potential entry and exit points is crucial for
successful trading.
One essential tool in a trader's arsenal is the Relative Strength Index, or RSI. And now, we introduce the Free RSI Heat Map, a powerful visualization tool that brings RSI data to life.
RSI Heat Map offers a comprehensive overview of the RSI values across multiple instruments, allowing trade
FREE
To download MT5 version please click here . Metatrader users are limited to few moving average types. Therefor I decided to create a package consisting of all MAs I knew. This package suggests 12 different types: { SMA, EMA, DEMA, TEMA, WMA, VWMA, SMMA(RMA), HullMA, LSMA, ALMA, SSMA, TMA } You can configure them via input tab. This is a non-repaint indicator with light load. To implement them I referred to standard libraries of pine script.
FREE

Индикатор Multiple RSI работает на основе стандартного индикатора RSI. Этот индикатор отобразит индикатор RSI с разных таймфреймов на одном экране. Вы сможете следить за значениями индикатора RSI со всех таймфреймов на одном экране. Этот индикатор освобождает вас от необходимости постоянно переключать графики. В то же время вы сможете отслеживать состояние других графиков относительно друг друга.
Особенности И1ндикатор показывает график RSI таймфрейма, на котором вы работаете, а также графики
FREE

iRSI in iMA - индикатор для изменения цвета iMA, когда iRSI пересекает уровень вверх (растущий тренд) или пересекает уровень вниз (падающий тренд). Это полезный инструмент для отслеживания растущего и падающего iRSI на iMA.
Параметры MA_Periods — период iMA. MA_Method — метод расчета iMA. RSI_Periods — период iRSI. RSI_ApliedPrice — цена для построения iRSI. RSI_LevelsUp — уровень iRSI для растущего тренда. RSI_LevelsDN — уровень iRSI для падающего тренда. BarsCount — количество баров для пока
FREE

Данный сканер показывает значения тренда по известному индикатору Parabolic SAR для нескольких инструментов (до 30) и 8 таймфреймов. Уведомляет о смене направления тренда в терминале MetaTrader 4, по email и push-уведомлением. Это бесплатная версия индикатора Advanced Parabolic SAR Scanner Бесплатная версия работает только на EURUSD и GBPUSD!
Важная информация Для максимального использования потенциала сканера прочитайте полное описание (на английском языке): www.mql5.com/en/blogs/post/718074
FREE

ZhiBiScalping - это настоящая ручная скальперская торговая система, которая подходит для любого цикла графика и подходит для всех разновидностей рынка.
После того, как рыночная цена пробьет линию Aqua, вы можете сделать ордер Buy, продолжить разбивать линию Aqua и увеличить сумму Buy.
Если рыночная цена пробивает красную пунктирную линию, вы можете сделать сингл Sell, продолжить пробивать красную сплошную линию и увеличить сингл Sell.
Настройка параметров:
[SPPeriod]: основной цикл ZhiBi

The Price Volume Trend Oscillator (PVTO) is a powerful technical analysis tool designed to provide insights into the relationship between price movements and trading volumes. This indicator offers a unique perspective on market trends, helping traders identify potential buying and selling opportunities. Parameters: EMA Short Period: Defines the short EMA period for calculating the PVTO. Default 3 EMA Long Period: Specifies the long EMA period for PVTO calculation. Default 10 EMA Signal Period: S
FREE
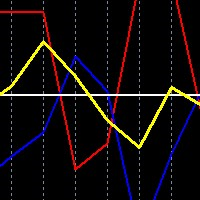
This is a simple free tool for simulating trades when trading both AUDUSD and NZDUSD in a hedge strategy, you can drop the indicator on either market chart. It is essential because you cannot tell at a glance, what a combined trade would be like, just by looking at the two individual charts separately.
New premium low cost indicator
How to use: Drop the indicator on either AUDUSD or NZDUSD chart, or any other chart, it will work.
You choose ploting period, to the number of days/weeks
FREE

This automated AK Edge Scalping Indicator can be employed to oversee trades and identify optimal entry points for all time frames and both buying and selling when the price starts trending upwards or downwards. It is designed to recognize zones for Sell/Buy trades by utilizing the Moving Average and the MACD. Additionally, it incorporates the Average True Value to fine-tune the Stop Loss and the Take Profit. It can be effectively used in conjunction with other strategies to facilitate prompt en
FREE
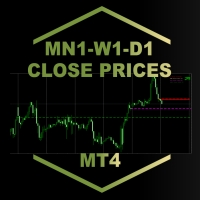
MN1-W1-D1 Close Price Indicator to Index Trading for MT4
The indicator draws lines to the close prices of the last closed bars of monthly, weekly and daily timeframes. Observably, these prices are significant support and resistance prices at major indices, like Nasdaq, DAX. The info panel always shows the prices relative to each other in the correct order. If the current price is the highest - i.e. higher than the last monthly, weekly and daily closing price - it is in the first row. The lowest
The Symbol Changer Indicator for MT4 is an amazing tool to switch and display any desired currency pair chart and any time frame. Forex traders can display the desired charts with the click of a mouse directly from any open chart. The symbol changer indicator for Metatrader is an essential tool for trend traders working with a top-down approach.
The symbol changer indicator shows all the available trading instruments in the market watch window. It also displays all the currency pairs as butto
FREE
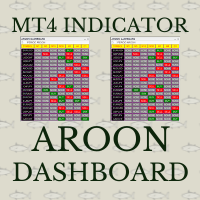
Aroon crossover Dashboard uses the value of Aroon indicator. The Aroon period can be adjusted via the Edit box of this dashboard. The monitoring pairs will be selected by adding to the Market Watch (no need to set prefixes or suffixes) , you can monitor many pairs as you like. This dashboard will check almost popular time frame (M1,M5,M15,M30,H1,H4 and D1). The colors can be customized. The Aroon indicator has been included in to this Dashboard, you do not need purchasing it. Crossover signal c

ExtremChannel - индикатор канала движения цены. Каналы строятся на основании предыдущих максимумов и минимумов, а так же уровней поддержки и сопротивления. Есть возможность отображать канал, построенный индикатором на старшем таймфрейме. Индикатор очень прост в использовании и дает наглядные представления о примерных границах будущего движения цены. Например если цена вышла за пределы канала, это может означать скорую смену тренда. Индикатор работает на любой валютной паре и на любом таймфрейме.

Представляем индикатор Maravilla Square: ваш помощник в прогнозировании трейдинга Откройте для себя индикатор Maravilla Square, ваш ключ к прогнозированию трейдинга. Этот уникальный инструмент предоставляет понимание разворотов цен, представляя линию тренда, которую можно настроить между высокими и низкими точками. Динамика Линии Тренда: Индикатор Maravilla Square представляет линию тренда, которую можно адаптировать к высоким и низким точкам на графике. Эта динамичная особенность создает прямую
FREE
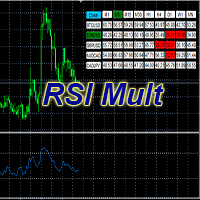
Стандартный Осциллятор RSI (Relative Strength Index) с некоторыми дополнениями. Позволяет выбрать до 5 инструментов. Отображение данных индикатора с выбранных инструментов по всем тайм-фреймам. Быстрое переключение на выбранный инструмент или тайм-фрейм . Индикатор RSI показывает неплохие сигналы, но все же его показания необходимо фильтровать. Одним из таких возможных фильтров может быть RSI с более старшего периода. Данная версия Осциллятора предназначена облегчить работу с графиками, а име
FREE

Candle size oscillator is an easy to use tool to figure out candle size from highest to lowest price of each candle. It's a powerful tool for price action analysts specifically for those who works intraday charts and also a perfect tool for short term swing traders. Kindly note that you can also edit the Bullish and Bearish candles with different colors.
#Tags: Candle size, oscillator, price action, price range, high to low, candle ticks _________________________________________________________
FREE

Bigger chart labels would allow the user to be entirely aware of which chart he/she is on. Each chart window is unique, containing different patterns and economic motives so acknowledging the chart window would be absolutely essential! There are well known Economic Time Zones included in clear view, by choice! Simple does it! Use your computing mouse scroller, clicking with the right finger on the label, in order to customize the label properties. From there, choose your preferred color,
FREE

Цель:
Функция этого индикатора - рисовать 3 линии скользящих средних (MA) на основном ценовом графике MT4.
МА взяты из 3 разных таймфреймов, указанных пользователем независимо от графика, который отображается в данный момент.
Когда вы переключаете просмотр графика через разные временные рамки, 3 МА продолжат отображать линии МА для временных рамок, указанных в свойствах.
Пример:
Настройки по умолчанию отображают три скользящие средней по 50 баров для таймфреймов H4, D1 и W1. Во время
FREE

Сканер показывает значения тренда на основе пересечения двух скользящих средних. Значения отображаются на нескольких символах (до 30) и 8 таймфреймах. Уведомляет о смене направления тренда в терминале MetaTrader 4, по email и push-уведомлением. Это бесплатная версия индикатора: https://www.mql5.com/ru/market/product/29159
Важная информация Для максимального использования потенциала сканера прочитайте полное описание (на английском языке): www.mql5.com/en/blogs/post/718074
Есть различные спос
FREE
Индикатор определяет зоны перекупленности и перепроданности на разных временных интервалах. Стрелки обозначают тенденцию рынка на разных тайм сессиях. Если рынок вышел из зоны перепроданности, то стрелка будет сигнализировать о восходящем тренде (стрелка вверх), если рынок вышел из зоны перекупленности, то стрелка будет сигнализировать о нисходящем тренде (стрелка вниз). В правом нижнем окне отображается ситуация на том тайм-фрейме, на котором установлен индикатор. В нем представлена информация
FREE

Открытие позиций в направлении тренда является одной из наиболее распространённых торговых тактик. Данный индикатор определяет направление локального движения и раскрашивает свечи на графике в соответствующий цвет. Позволяет входить в сделку в самом начале движения Благодаря гибким настройкам можно использовать на любых валютных парах, металлах и криптовалюте Можно использовать при работе с бинарными опционами
Отличительные особенности Не перерисовывается; Дополнительные параметры для точной н
FREE

"Giant" - гибкая в отношении к торговым стратегиям система. Состоит из двух качественных индикаторов, которые устанавливаются на пять разных таймфреймов одной валютной пары (см. скриншот). Она следит за трендом и даёт сигналы на открытие. Система прошла большое количество проверок и показала высокую точность. Индикаторы продаются по отдельности. Второе слово в основном названии - это сам индикатор. В данном выпуске продаётся индикатор "Nicely" .
FREE

Индикатор определяет направление тренда и раскрашивает свечи на графике в соответствующий цвет. Позволяет входить в сделку в самом начале движения Максимально простая настройка индикатора Можно использовать на любых валютных парах, металлах и криптовалюте, а так же при работе с бинарными опционами
Отличительные особенности Показывает направление тренда Не перерисовывается; Простая и точная настройка; Работает на всех таймфреймах и на всех символах; Подходит для торговли валютами, металлами, оп
FREE

indicator named "MTRADER" designed to be used with the MetaTrader 4 trading platform. It appears to be a technical analysis tool for forex or stock market trading. Here's a breakdown of its key components and functionalities: Indicator Properties and Inputs : The code begins by setting up basic properties of the indicator, such as its name, version, and drawing styles. It defines two indicator buffers with blue and red colors, likely used for graphical representation on charts. Input parameters

Это алгоритм для раннего обнаружения изменений тренда. Вы должны попробовать несколько значений для параметра мультипликатора (1 < <10 рекомендуется). На первый взгляд вы можете увидеть эффективные записи. Это, по сути, один из строк, что Гелег Faktor первоначально было. Но он был удален, потому что он больше не нужен. Других строк было достаточно для эффективности G.Faktor, но я все еще хотел поделиться этим. Всегда тест, прежде чем использовать его на живой счет, так что вы полностью понимаете
FREE

A complete NNFX algorithm in one indicator.
NEW: Inbuilt backtester shows historical trade stats on the chart to show which pairs are most profitable. Don't be fooled. It's not enough to simply match a strong and weak currency to trade successfully with a strength meter, you need to know the intimate details of the relationship between two currencies. This is exactly what we've done with NNFX Strength, giving you all the information you need to make solid trading decisions. Years in the makin
Версия для MetaTrader 5 доступна здесь : https://www.mql5.com/ru/market/product/24882 FFx Basket Scanner ищет до пяти индикаторов среди 16 доступных на всех парах и таймфреймах. Таким образом вы можете ясно увидеть торговли по каким валютам следует избегать, а на каких сосредоточить внимание.
Когда валюта переходит в экстремальную зону (например, 20/80%), вы можете торговать всей корзиной с большей уверенностью. Другая область применения индикатора – определение сильных и слабых валют для поис
MetaTrader Маркет - торговые роботы и технические индикаторы для трейдеров, доступные прямо в терминале.
Платежная система MQL5.community разработана для сервисов платформы MetaTrader и автоматически доступна всем зарегистрированным пользователям сайта MQL5.com. Ввод и вывод денежных средств возможен с помощью WebMoney, PayPal и банковских карт.
Вы упускаете торговые возможности:
- Бесплатные приложения для трейдинга
- 8 000+ сигналов для копирования
- Экономические новости для анализа финансовых рынков
Регистрация
Вход
Если у вас нет учетной записи, зарегистрируйтесь
Для авторизации и пользования сайтом MQL5.com необходимо разрешить использование файлов Сookie.
Пожалуйста, включите в вашем браузере данную настройку, иначе вы не сможете авторизоваться.