Смотри обучающее видео по маркету на YouTube
Как купить торгового робота или индикатор
Запусти робота на
виртуальном хостинге
виртуальном хостинге
Протестируй индикатор/робота перед покупкой
Хочешь зарабатывать в Маркете?
Как подать продукт, чтобы его покупали
Технические индикаторы для MetaTrader 4 - 114

By TFT Professional - Один из наших лучших продуктов для МТ4 который не рисует и не меняет позиции стрелок. появляется стрелка на текущей свече. периоды настраиваемые так же как и цвет стрелок. с данным индикатором почувствуете то что вам нужно от рынка, это стабильность и раскрытность рынка.. Мульти-таймфреймовы и мультивалютный индикатор! Протестируйте и попробуйте его в действии!

Индикатор Promining Trade Signal дополнит любую стратегию, а также может использоваться как самостоятельный инструмент. Преимущества Рекомендуемый таймфрейм M30 Легко использовать; не перегружает графику лишней информацией. Возможность использования в качестве фильтра для любой стратегии. Индикатор не меняет цвет после закрытия свечи. Он работает с акциями, индексами, нефтью, золотом и на всех таймфреймах. Имеет функцию push-уведомлений и звуковых оповещений. Alert - включить/отключить оповещени

Market Meter предназначен для изучения различных тенденций в текущем торговом символе.
с помощью Market Meter вы можете получить четкое представление о тенденциях, идущих на разных таймфреймах текущего символа. Этот индикатор использует отдельное окно для отображения своих данных.
Каждый раз, когда возникал новый тренд, Индикатор показывает его со стрелкой на соответствующей текстовой области. Очень важно определить тенденции более высоких таймфреймов, когда вы торгуете на более низких тай

Pipsurfer Dashboard is a multi-currency multi-timeframe dashboard designed to alert you to where the action is happening in the forex markets. The software trades a trend based price action and market structure strategy. Assets Supported: All Forex Metals Indices Major Crypto
Major Input Settings: Timeframe Filters - Choose which timeframe you want the Pipsurfer Dashboard to signal you on. Pair Selection - Choose To Follow All Major Pairs And Crosses or have a custom list of your choice Aler

"Scalping saham" - это уникальная, полностью готовая скальпинговая торговая система. Она показывает трейдеру, когда и где нужно открывать и закрывать сделки. Скальпинговая торговля, это одна из самых эффективных, но в тоже время и самых сложных торговых систем. По этому если Вы еще не имеете своей стратегии, Вам лучше взять уже готовую скальпинговую стратегию и работать с ней. Скальпинговая стратегия этого индикатора заключается в том, чтобы определять с высокой точностью направление тренда, п

Этот индикатор использует локальные максимумы и минимумы ценового ряда. После выделения экстремумов их значения подвергаются сглаживанию. Благодаря этому строится два канала - внешний и внутренний. Внутренний канал показывает пределы, если бы движение цены строго подчинялось линейному тренду. Внешний канал показывает границы для движения цены с логарифмическим трендом. После вычисления каналов индикатор анализирует реальное движение цены и предлагает рекомендации по открытию и закрытию позиций.

Дивергенция и Конвергенция - важные предвестники разворотов на биржевых рынках.
Индикатор "Divergence Sync" - создан для автоматического поиска дивергенций на большом количестве индикаторов с разными параметрами .
Поиск дивергенций осуществляется на этих индикаторах: (CCI, CHO, DeMarker, MACD, MFI, Momentum, OBV, OsMA, RSI, Stochastic, WPR, Awesome Oscillator ).
Для поиска дивергенций можно использовать один технический индикатор или искать одновременно на любом количестве индикаторов.

Индикатор TickCounter осуществляет подсчет тиков вверх и вниз на каждом новом баре. Подсчет начинается с момента установки индикатора на график. Столбики гистограммы отображают: Желтые столбики - общее количество тиков; Синие столбики - тики ВВЕРХ; Красные столбики - тики ВНИЗ. Если синий столбик не виден, значит тиков вниз больше и красный столбик отображается поверх синего (красный слой выше синего). MT5 version: https://www.mql5.com/en/market/product/82625 Каждая переинициализация индикатора

Trading Indicator Lab’s Trend Navigator for MT4 is an indicator that can help you reveal the underlying trends in any chart on any timeframe. Determining Trends It only takes a minute or two to analyze the indicator with its simple yet insightful methods of representing bullish, bearish and ranging price action across the chart. It forms a single line that runs in 3 directions: Upward direction – represents a significant bullish price action Horizontal direction – represents ranging price action

SL Curruncy impulse flow of this intraday Asian London New York Sessions strength.SL Curruncy impulse indicator best for intraday scalper. market powerful move time you can catch best symbol. because you'll know which currencies are best to trade at that moment. Buy strong currencies and sell weak currencies Suggested timeframes to trading : M1 - M5 - M15 - M30 -H1 You can however just change SL Curruncy impulse to check in the settings. Bear in mind that scanning very low timeframes. How d

Inficator MT4 : HiLo Objective : Find Support and Resistance zone
How to set up Indicator HiLo : 1. Indicators type multi time frame are MN1 W1 D1 H4. 2. Customize for use MN1 only or W1 only or D1 only or H4 only or open all. 3. We use MN1 and W1 for set to Key level. 4. For Close price or Open price to high price set for Resistance zone. 5. For Close price or Open price to Low price set for Support zone.
How to trade for success : Entry point : Buy / Long position 1. Price bid hit the
Easily track how the price moves in a separate indicator window with this trend indicator. Great for scalping or long-term trading. Helps you find best entry points for your trades after reaching a certain level, and easily identify where you can exit your trades. This indicator can be used on all time frames and pairs. Features alert function.
No need to set up the indicator.
How to use: Simply attach to any chart. NB : Look to the extreme zones (oversold/overbought) when looking for new tra

The Chop Exploder indicator is a custom indicator that has a long run, tight chop, short chop, and band colour. This indicator has MT4 alert notification,mobile notification, and email notification. The default indexing of all arrays and indicator buffers is left to right. The index of the first element is always equal to zero. Thus, the very first element of an array or indicator buffer with index 0 is by default on the extreme left position, while the last element is on the extreme right posit

CFF Pro Trader
CFF Pro Trader is the best trading system you will ever find when you want to follow the right & the real direction of the market, It’s providing marvelous trading signals based on such and amazing algorithm.
*** 2 Copies left for next price $4100 ***

Trading Indicator Lab’s Candle Volume Heatmap for MT4 merges volume with price by applying gradient-colored dots on the bars. It can also detect bars that have the most volume and the least volume. Gradient Coloring When applied to a chart, the Candle Volume Heatmap indicator applies colored dots to each bar which may vary according to its volume. The chart becomes a heatmap where you can easily spot which parts of the bar history are “hottest” or the bars that had the greatest number of volume

Trading Indicator Lab's Volume by Price is a volume-based indicator for MT4 that reveals price levels with the most and least volume for each bar within a given period. How It Works You can think of the indicator as a running volume profile that displays the most voluminous price level and the price level that has the least volume. For each bar, the indicator calculates the volume vertically in the price axis. As this is calculated, the indicator creates 2 signals: (1) a large red dot which repr

''Trendlines'' is an Indicator, that every Trader need and shows Trendline and Support and resistance levels in all Timeframe's. Also In 1-hour, 4-hour and daily time frames and Current timeframes, support, and resistance levels are specified and trend lines are drawn so that the trader can see all levels on a chart. In Properties it is possible to turn off unnecessary Lines.
In ' Tendency indicator '' , as full package of Predictions that every Trader need, there is also the Predic
The R[2] Forex Indicator is a complete Forex Trading System working on major forex pairs on 15 Minutes time frame, and it draws: Low Dot / High Dot to spot potential turning points Buy Arrows and Sell Arrows to help you enter the trades with the perfect timing A two colors dotted line to show the trend in action and the target for reversal signals
I invite you to watch my Videos on YouTube where I show the R[2] Strategy and how I personally trade with it, and a
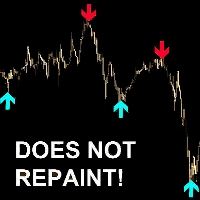
"Avadhut sathe" - индикатор для скальпинга. Показывает трейдеру стрелками на графике точки разворота цены. Лучше всего "Avadhut sathe " торгует на таймфреймах M1, M5, M15. Рекомендуемые валютные пары: GBPUSD, EURUSD, GOLD, SILVER, BTCUSD, AUDUSD, USDJPY, EURJPY, USDCHF, USDCAD, EURCHF. Индикатор "Avadhut sathe" имеет множество режимов работы, от которых зависит точность сигналов. В большинстве режимов индикатор "Avadhut sathe" не перерисовывает свои сигналы. Индикатор "Avadhut sathe" стрелкой
The R[2] Gold Indicator is a complete Trading System working on GOLD (XAUUSD) on 5 Minutes time frame, and it draws: Low Dot / High Dot to spot potential turning points Buy Arrows and Sell Arrows to help you enter the trades with the perfect timing A two colors dotted line to show the trend in action and the target for reversal signals
I invite you to watch my Videos on YouTube where I show the R[2] Strategy and how I personally trade with it, and also to join m
MOVING AVERAGE ON OFF BUTTON as the name suggest you can disappear and reappear up to 5 moving average with a single click. This can save a lot of time and energy for the traders. you can change the color, period and shift of the moving average as you wish you can move the on off button where ever you want you can also change to simple moving average, exponential moving average and much more types of moving averages to know more about the the indicator and how to use it watch the video linked b
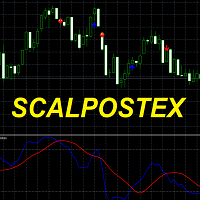
Scalpostex - готовая торговая система которая показывает трейдеру точки и направления открытия ордеров. Торговая система состоит из 17 модулей анализа рынка. Scalpostex анализирует рынок с помощью индикаторов, свечных фигур и линий сопротивления/поддержки. С помощью метода комплексного анализа рынка, эта индикатор способен прогнозировать движение цены с высокой точностью. Как торговать с этим индикатором (рекомендации): Мы рекомендуем открывать сделки в сторону появившейся стрелки. Если п
The Price Elevator indicator is developed to help you figure out the general long-term trend of the market. If the price is above the Green separator line, this is a clear indication the bulls are in control. Similarly, the bears are in control if the price continues to trend below the red separator line. Download Price Elevator MT5
Trend Re-entry In this case you would plan your buy entries above the green dotted box (make sure to set the Buy / Sell Retracement Floor=30). The SL should be

The Spots Indicator can be used for Entering and Exiting your trades based on the common candlestick patterns such as: engulfing, hanging man, doji etc. It is designed to publish desktop and mobile notification every time a signal is triggered. However, it is worth noting that this indicator is recommended to be used with other indicator for confirming the entries. It is best to use it with the Investment Castle Trend Lines indicator and the Supply and Demand indicator

Scalping Points XL - скальпинговый индикатор из серии " Scalping Points ". Этот индикатор предназначен для того, чтобы показывать трейдеру точки разворота цены. Индикатор имеет много настроек и разных режимов работы. Не перерисовывает свои значения. В зависимости от режима настройки, может рисовать сигналы как в самом начале появления свечи, так и при ее закрытии. Принцип работы этого индикатора заключается в том, чтобы анализировать рынок на предмет волатильного изменения цены и показывать трей

Этот индикатор в качестве весовых коэффициентов использует так называемые "злые" числа. Их противоположностью являются "одиозные" числа, которые также представлены в этом индикаторе. Разделение чисел на эти два класса связанно с весом Хэмминга, который определяется количеством единиц в двоичной записи того или иного числа. Применение этих чисел в качестве весовых коэффициентов позволяет получить индикатор, следящий за трендом. Причем, одиозные числа дают более чувствительный индикатор, а злые –
Использовать индикатор можно так основной для определения тренда. Индикатор может работать как для точек входа, так и Chord Trend индикатор работает хорошо на более длинных трендовых участках. Во флете рекомендуется использовать фильры по вашему выбору. Может сопровождать позицию стопом, стоп рекомендуется выставлять на фиксированном расстоянии от точки формируемой индикатором. Если совместить использование индикатора в качестве входного и сопровождающего позицию тогда для сопровождения стопа
Индикатор использует свой собственный алгоритм анализа рынка, который рекурсивно проходит информацию о движении цен на уровне баров, такую как цены открытия, закрытия и цены теней. С помощью данного индикатора вы можете найти наиболее вероятные точки разворота тренда. Простая, но эффектиная система для определения форекс-тренда. По скриншотах можете сами увидеть точностью данного инструмента. Работает на всех валютных парах (криптовалюты, сырье, акции). Система оповещений (алерт, уведомления на

The purpose of the inidcator is to identify the reversal point.
The blue arrow is buy signal and the yellow star is its stop loss. The red arrow is sell signal and the yellow star is its stop loss. Alert feature: if there is a signal, the indicator will send alerts of popup window,email or mobile push. Inputs: Popup Window Alert: it is false in default Email Alert : it is false in default Mobile Push Alert: it is false in default. MetaTrader 5 Version: Reversal Point Please note that the singa

Индикатор подходит для всех пользователей, даже для начинающих трейдеров. Никогда не перерисовывается . Сигналы индикатора формируются от закрытия до закрытия . Предназначен для самостоятельной работы , другие индикаторы не требуются. Специальный график показывает прибыль и просадку в соответствии с историческими данными.
Принципы работы Scalper Pro Line использует внутренний индикатор тренда в сочетании с системой ценового действия. При запуске система анализирует 10000 первых баров, что
Built-in RSI indicator has an error in the algorithm. I spotted the error while working on a modified RSI where i needed the original algorithm with special input I started with the official formula and were having different curves from the built-in indicator. after thinking I had made a mistake in the algorithm, I realized the orginal indicator is wrong by looking at the code.
So here is the real RSI, computed from the original formula, so you know it's the real indicator.
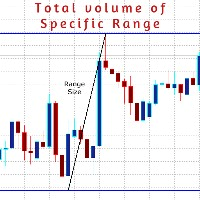
AboaishaRV_Calculator is an info indicator.
It manages to calculate the range and total volume between any 2 points on the chart.
To use it just install the indicator and draw a trend line between point X and point Y and it will show you the difference in the price and the total volume traded inside this range. Indicator inputs: DataColor >> the color of the info range size and volume size of the range. LinesColor >> the color of the range border lines if they are used. FontSize LinesWidth Ran

"MACD crossover" - новая разновидность индикатора осцилятора. " MACD crossover" рисует на графике красную или синюю линию. Когда линия синяя - это значит, что индикатор MACD выше нуля. Если линия на графике красная - это значит, что индикатор MACD ниже нуля. Таким образом этот индикатор помогает трейдерам определять положение MACD визуально на графике. Особенно полезной эта информация будет при торговле скальпингом. Вы можете комбинировать этот индикатор и трендовые индикаторы на графике. Если

This is based on Demark's TD Sequential and TD Combo set of indicators. It mostly has the TD Sequential features. It contains the Arrows Indicator showing Buy/Sell signals and the scanner dashboard. Both are for MT4 (Metatrader 4) Platform. Feature List: - Set TD Setup (9), Countdown (13) bars and In Between bars (4)
- Set Countdown Risk Level Bars
Below features are optional: - Merge TD Setup and Countdown for TD Combo
- Check Setup Intersection
- Price Flip before Starting Setup count
-
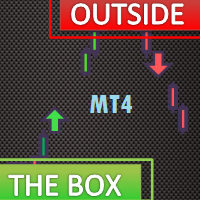
The Outside The Box (OTB) is a complete trading system that provides the user with immense trading ability by highlighting on the chart areas where the trader should prepare to Re-enter the trend after pullbacks (Pullback trading strategy) Take partial/complete profit(Profit taking strategy), and Trade breakouts (Stock breakout strategy) - We have updated the indicator to show/hide Micro breakout areas around the major breakouts (Micro Breakouts). The above is supported by an alert system
Этот индикатор - очередная разновидность ЗигЗага, за исключением, он не рисует текущую линию, которая может перерисоваться.
Этот индикатор, если нарисовал конечную точку, по закрытому бару, то больше ее не изменяет - это означает смену направления и следующая точка будет другого цвета. Может быть применен как для определения основного движения, при использовании увеличенных параметров, так и непосредственно для входа с минимальным риском.Очень хорошо показывает все волны. Работает с любым инстр

La esencia del trabajo del indicador Binary Kikos es que analiza el precio de la barra actual, comparándolo con las formaciones anteriores, y cuando surge un patrón, lanza una alarma en el desarrollo de la barra actual marcado con un punto ó circulo, al culminar la vela con punto se opera al inicio de la siguiente vela. La principal ventaja del indicador Binary Kikos es que no requiere filtros o señales adicionales de ninguna otra estrategia. Características del Indicador Terminal: Meta Trader 4

Early Trends finds trends early, when price is still squeezed inside price action, which is the best time to spot a trend. When the price action makes higher highs or lower lows within the first bars back, while no HH or LL has been triggered on higher period bars back, then a trend is potentially beginning You can also take signals only in the direction of the trend, with the trend filter.
Many parameters : Number of Bars Displayed Number of Bars Back HHLL Number of Bars Back Multiplier Perio

Witch Hat for Binary Options is an indicator for binary options based on analysis of Bollinger Bands and RSI, using a modulated strategy with indicator settings using complex filters. This indicator never repaints, it has an almost accurate answer for you to make the entries.
There are two ways for you to analyze your entry, when an arrow appears you have more than 90% chance of hits, and the other way is the lines that it automatically draws and its trend line.
It has surprisingly strong s

Hma Vvm Hull - это профессиональный индикатор для работы на любых рынках, особенно эффективен при торговле валютными парами, показывает ранние тенденции к смене тренда. Индикатор имеет множество настроек, которые позволяют успешно использовать его при различных способах торговли и торговых стратегиях. Предусмотрена возможность установки на один график нескольких индикаторов с разными параметрами. Разнообразие настраиваемых алертов, позволяют трейдеру всегда контролировать рыночную ситуацию и св

Этот индикатор получает тиковые данные из терминала, а затем усредняет их тремя скользящими средними. Это позволит отловить тренд даже внутри свечи М1. Параметры скользящих можно настроить вручную. Также можно указать глубину прорисовки индикатора. Чтобы индикатор начал работать, поместите его на график и позвольте ему несколько минут поработать - для нормальной работы ему нужно набрать массив котировок. Настоящий продукт предназначен для агрессивной торговли, но буджет также полезен и аналитик

The indicator automatically sets trendlines on the really important points directly on the chart. Timeframe, color and style of the lines can be adjusted. Notification of a breakout above or below the line via a smartphone is possible.
Input Parameters TimeFrame : Choose timeframe Formation : Choose swing, Shoulder head shoulder or long term formation Alerts : true = alert is on SendEmail : Send message to email address
SendNotifications : Send message to smartphone or tablet
AlertAtClose

" Scalping trading strategy " - индикатор создан для торговли по системе скальпинга. " Scalping trading strategy " показывает на графике стрелкой куда сейчас пойдет цена. После того, как индикатор нарисовал стрелку, цена пойдет в сторону стрелки минимум на 20 пунктов. Этого нам достаточно, чтобы эффективно торговать. " Scalping trading strategy " не перерисовывает свои сигналы. У индикатора есть много разных режимов работы. Он может рисовать стрелку как в начале новой свечи, так и в конце све
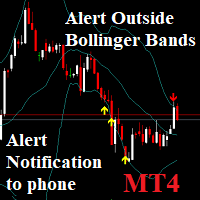
Notifications outside of Bollinger Bands: Send phone Notification and window alerts when price breaks out of Bollinger bands Low & High. You can set the value Alert, Notification. And On OFF Alert on Terminal, Notification on Smartphone. Notifications - Client Terminal Settings - MetaTrader 4 Help
How to Setup MT4/MT5 Mobile Alerts Right to Your Phone (forexschoolonline.com)

Test Confluence OB , es un indicador ideal para unir de 1 hasta 8 indicadores de todo tipo, siempre en cuando tenga búffer habilitado, busca confluencias y alineamientos.
¿tienes una estrategia basado en varios indicadores?
Con " Test Confluence OB" puedes testearlo, el indicador lanzará una alerta y flecha en los puntos de confluencia ó alineación que estás buscando; ahorrandote tiempo y dinero.
Para estrategias de Opciones Binarias puedes emplear el Display que tiene para testear r
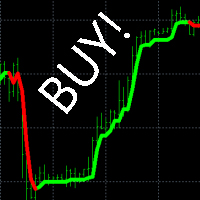
"Buy Sell Alert" - индикатор который показывает трейдеру куда идет тренд и когда открывать сделку. Если индикатор рисует на графике зеленую линию - открываем ордер на покупку. Если индикатор рисует на графике красную линию - открываем ордер на продажу. Преимущества индикатора: процент запаздывания менее 3% точность сигналов более 96% не перерисовывает свои значения для построения торговой стратегии достаточно использовать этот один индикатор. очень простой в настройках работает на всех валютны
Очень точный индикатор, с его помощью очень легко определять барные паттерны.
Это очередная разновидность ЗигЗага, за исключением, он не рисует текущую линию, которая может перерисоваться,если нарисовал конечную точку, по закрытому бару, то больше ее не изменяет - это означает смену направления и следующая точка будет другого цвета. Может быть применен как для определения основного движения, при использовании увеличенных параметров, так и непосредственно для входа с минимальным риском. Очень
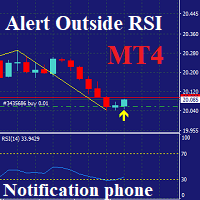
Notifications outside of RSI: only MT4 Send phone Notification and window alerts when price Over RSI: Default: Over Buy RSI=70 & Over Sell RSI=30. You can set the value Alert, Notification, Over Buy, Over Sell. And On OFF Alert on Terminal, Notification on Smartphone. Notifications - Client Terminal Settings - MetaTrader 4 Help
How to Setup MT4/MT5 Mobile Alerts Right to Your Phone (forexschoolonline.com)

This indicator shows the bullish/bearish market regime using the no. of bars moved above and below the overbought/oversold region of RSI. The green histogram depicts the Bull power, while the red depicts the Bear power.
Features
It can be used to enter new trades or validates trades from other strategies or indicators. It comes with a multi-timeframe scanner that scans the bulls/bears power across all the time frames. It's a perfect choice to boost the confidence of new traders via validatin
SSL stands for Semaphore Signal Level channel. It consists of two moving averages applied to high and low, respectively, to form a price following envelope. Buy Signal: When the price closes above the higher moving average. Sell Signal: When the price closes below the lower moving average.
Features It comes with a multi-timeframe scanner that scans for the new signals across all the timeframes. A straightforward personal implementation of the classic SSL effortlessly finds the trend directio

It's a modified, and improved version of the classic HMA developed initially by Alan Hull in 2005. It uses a combination of three weighted moving averages to reduce the lag. Long Entry: When HMA turns blue from red with an upward slope. Short Entry: When HMA turns red from blue with a downward slope.
Features It comes with a multi-timeframe scanner which scans for the new signals across all the timeframes. HMA reduces lags which usually come with the traditional moving averages. Effectively

"M1 Scalping Turbo" - индикатор для скальпинга внутри дня. С помощью этого индикатора можно торговать на таймфреймах М1, М5, М15, М30, H1. Валютные пары рекомендуем GBPUSD, EURUSD, USDJPY, USDCHF, USDCAD, EURAUD, EURCAD, EURNZD, GBPCAD, GBPAUD. Правила торговли:
Индикатор показывает стрелками на графике когда нужно открывать сделку, в каком направлении открывать сделку, где ставить ТейкПрофит и СтопЛосс. Размер лота рассчитываете сами. Мы рекомендуем использовать в торговле не более 10% от деп

Работа индикатора показана в видео во время тестирования на исторических данных. Индикатор поддержек сопротивлений в основном создавался для H4, хотя возможна работа и на других таймфреймах. Присутствует алерт появления очередной поддержки или сопротивления. Также в индикатор встроены восходящая поддержка и нисходящее сопротивление, которые неплохо себя показали. Есть возможность отключения лишнего. Для удобства на экран выведены кнопки, которые работают онлайн. https://youtu.be/UHhM1J-sX2E

Этот индикатор основан на оживальных формах. Такие формы используются в аэродинамике и космической технике. Даже пули имеют какую-либо оживальную форму. Применение таких форм в техническом индикаторе позволяет добиться компромисса между чувствительностью индикатора и его устойчивостью. Что дает дополнительные возможности при его применении. Параметры индикатора: iType - тип оживальной формы. iPeriod - период индикатора. iFactor - дополнительный параметр, использующийся в параболической и степен

VIP сигнал для бинарных опционов.
Этот индикатор был создан специально для бинарных опционов. Настроен на прибыльную работу в бинарных опционах.
Попробуйте этот индикатор, если хотите прибыльно работать на бинарных опционах. Условия торговли очень просты. Ждем указания направления. Открываем сделку на текущем таймфрейме по направлению.
< < < Индикатор не перерисовываются > > >
Многие пользователи уже оценили его положительно. Результаты вас тоже удивят.
По результатам тестирования эт

Provides Regression Channel on the current chart. Combined by Trend of Moving Averages and Multi timeframes Oscillator Indicators: CCI, RSI, Stochastic, and MACD with specific working logic . It could make us easier to identify swing high-low as an entry point, the retracement area while following the current trend. Consists of 2 types of signal, main and secondary. The main signal will draw very clearly triangle and lines on the chart with the word " BUY" or 'SELL'. and the secondary is the sta

This Beautiful Real Entry indicator is designed for signal trading. This indicator generates trend signals.
It uses many algorithms and indicators to generate this signal. It tries to generate a signal from the points with the highest trend potential.
This indicator is a complete trading product. This indicator does not need any additional indicators.
The indicator certainly does not repaint. The point at which the signal is given does not change.
The indicator has a pips counter.
Индикатор iVeles_Channel_Extremum_II_MTF вычисляет точки слома направлений движения цены на установленном в параметрах ТФ, на основе этих точек и выбранного их количества строится основной канал цены, который можно использовать в качестве уровней поддержки и сопротивления для меньшего ТФ, на котором установлен индикатор. В зависимости от направления движения основного тренда рассчитывается средняя линия канала по уровню Фибоначи, от которой, как правило, идет отскок в сторону тренда. Также по ур

Default settings:XAUUSD(GOLD)M1,M5,M15 No repaint, no redraw, no recalculate Can be optimized in all pairs You can fully optimize it and apply it to your strategy You can use it alone or in addition to your strategy. Suitable for beginners You will see the trading zones and identify the most profitable points to open positions. To open an order, the price must be in the yellow zone Full entry points, 5 different take profit zones https://www.mql5.com/en/users/ummuhan/seller For your questions an

FinArk Support and Resistance is an indicator that will detect support and resistance zone that are drawn on the chart by automatic. Supply Demand uses previous price action to identify potential imbalances between buyers and sellers. This trend detection indicator will compliment any strategy and can also be used as an independent tool.
We can enter in good price with this Indicator, in order to follow the strong demand on the current instrument.
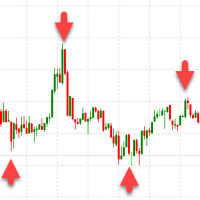
Scalping trader - индикатор создан для внутридневной торговли (скальпинга). Не перерисовывает стрелки. Показывает на графике стрелками возможные развороты цены. Точность сигналов примерно 96%. То есть, в 96% после появления стрелки на экране, цена пойдет в обратном направлении минимум на 40 пунктов по паре GBPUSD. Торговая стратегия очень простая. Ждем появление стрелки на графике. После того как появляется стрелка, открываем ордер в направлении стрелки. ТейкПрофит ставим 40 пунктов. СтопЛосс ст
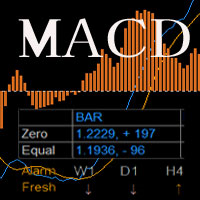
MACD with two lines and bar,
Predict the price, moniotr all period, play sound when it changed.
If there is any other need, contact me.
MACD = [stockPrices,12]EMA - [stockPrices,26]EMA signal = [MACD,9]EMA divergence = MACD – signal User Inputs Fast EMA Period - Fast moving average line, the default period is 12. Slow EMA Period- Slow moving average line, the default period is 26. Signal SMA Period - set signal period , the default period is 9.

Индикатор iVeles_MACD_Pro представляет симбиоз обычного индикатора MACD или разницу показаний между двух динамических МА, рассчитанных по текущим ценам инструмента. Сигнальная линия отсутствует, но ее заменяет более точные динамические облачные уровни.
Хорошо показывает разворотные моменты, позволяет точно определять дивергенции. Имеет цветовое сопровождение изменения показаний.
Параметры: period_Fast - период быстрой МА period_Slow - период медленной МА price_Bar - применяемая цена leve
Индикатор iVeles_RSI представляет собой обычный RSI, привязанный к нулевой отметке . В отличии от обычного RSI, наложены уровни сигнала в виде облака, что заметно расширяет области применения данного индикатора.
Очень хорошо показывает разворотные моменты, так же позволяет точно определять дивергенции.
Параметры: period - период RSI price - применяемая цена level - уровень облака
Индикатор iVeles_RVI представляет собой обычный RVI, с пересчитанными и приведенными значениями . В отличии от обычного RVI, наложены уровни сигнала в виде облака, что заметно расширяет области применения данного индикатора.
Очень хорошо показывает разворотные моменты и циклы тенденций, так же позволяет определять дивергенции.
Параметры: period - период RVI price - применяемая цена level - уровень облака

Индикатор iVeles_DeMarker представляет собой обычный DeMarker, с пересчитанными и приведенными к нулю значениями . В отличии от обычного DeMarker, наложены уровни сигнала в виде облака, что заметно расширяет области применения данного индикатора.
Очень хорошо показывает разворотные моменты и циклы тенденций, так же позволяет определять дивергенции.
Параметры: period - период DeMarker level - уровень облака
Индикатор iVeles_CCI представляет собой обычный CCI . В отличии от обычного CCI, наложены уровни сигнала в виде облака, что заметно расширяет области применения данного индикатора.
Очень хорошо показывает окончание трендов, разворотные моменты и циклы тенденций, так же позволяет определять дивергенции.
Параметры: period - период CCI price - применяемая цена level - уровень облака

Индикатор iVeles_Moment представляет собой обычный Momentum, с пересчитанными и приведенными к нулю значениями . В отличии от обычного Momentum, наложены уровни сигнала в виде облака, что заметно расширяет области применения данного индикатора.
Очень хорошо показывает разворотные моменты и циклы тенденций, может применяться как основной сигнал для входа в позицию.
Параметры: period - период Momentum price - применяемая цена level - уровень облака
The best indicator for Binary Options is now available at the MQLMarket, this version is already configured and optimized to operate with Binary Options, Forex and Cryptocurrencies. It is composed of a momentum algorithm that looks for better opportunities in the market, bringing you the best points to open your positions with low risk and high proportion of gain.
The MQL version can also be incorporated into the MT2 signal automator.
Product features Common signals (Oscillator) S

***SALE NOW ON***
We've all been there, searching for that profitable trade wading through 25 pairs but missing out because we didn't see it in time.
This is why I say trade simple trade effective and why I designed this scanner to keep watch on the markets that are trending and where a pullback could be able to happen.
Features:
Automatically looks at up to 28 pairs at the same time to save you from having to. Easily adjustable EMA settings to your own critera (Fast, Mid and slow sett
А знаете ли вы, почему MetaTrader Market - лучшее место для продажи торговых стратегий и технических индикаторов? Разработчику у нас не нужно тратить время и силы на рекламу, защиту программ и расчеты с покупателями. Всё это уже сделано.
Вы упускаете торговые возможности:
- Бесплатные приложения для трейдинга
- 8 000+ сигналов для копирования
- Экономические новости для анализа финансовых рынков
Регистрация
Вход
Если у вас нет учетной записи, зарегистрируйтесь
Для авторизации и пользования сайтом MQL5.com необходимо разрешить использование файлов Сookie.
Пожалуйста, включите в вашем браузере данную настройку, иначе вы не сможете авторизоваться.