Help formulate
I haven't found a similar topic.
Can you please tell me how to describe the pulse correctly in the ToR?
I understand how it looks on the graph, I can explain it on my fingers, but I can hardly imagine how to put it succinctly on paper.
Thanks in advance.
So describe it as you understand it and attach a screenshot. You probably have a price change of N points in X time?
I haven't found a similar topic.
Can you please tell me how to describe the pulse correctly in the ToR?
I understand how it looks on the graph, I can explain it on my fingers, but I can hardly imagine how to put it succinctly on paper.
Thank you in advance.
At least attach a picture of the impulse to make it clear what we are talking about.
Describe how you understand it and attach a screenshot. You probably have a price change of N points in X time?
Well more like that explanation, i.e. I was essentially planning a visual description without auxiliary indicators. Small shadows, big body, etc. But a pulse may look differently, without shadows, or with small shadows, or with one shadow, etc. Therefore, it will be a description and a screenshot of each pulse, and it will take several pages + not everything can be described. That's why I asked for a suggestion, maybe there's a generalized concise description.
I haven't found a similar topic.
Can you please tell me how to describe the pulse correctly in the ToR?
I understand how it looks on the graph, I can explain it on my fingers, but I can hardly imagine how to put it succinctly on paper.
Thank you in advance.
1. Nikolski's method from the TS Pathfinder:
- 5 EMA crosses 20 = impulse of the current wave level
- 5 turns to 20 but does not cross it - correction of the lower TF level (multiple of TF - 4).
- 5 EMA crosses back over 20, but price does not break through the beginning of the impulse = current level correction = current TF flat.
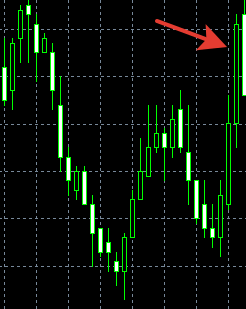
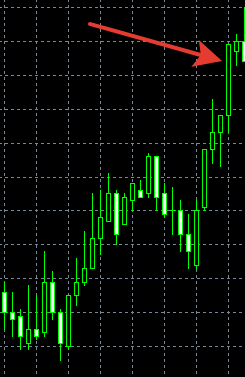
At least attach a picture of the pulse to make it clear what we are talking about
Like this
1. Nikolski's method from TS Pathfinder:
- 5 EMA crosses 20 = impulse of the current wave level
- 5 turns to 20 but does not cross it - correction of the lower TF level (multiple of TF - 4).
- 5 EMA crosses back over 20, but price does not break through the beginning of the impulse = current level correction = current TF flat.
I take it from this methodology that momentum is when 5 EMAs cross 20 and that's it?
I haven't found a similar topic.
Can you please tell me how to describe the pulse correctly in the ToR?
I understand how it looks on the graph, I can explain it on my fingers, but I can hardly imagine how to put it succinctly on paper.
Thank you in advance.
It goes something like this
Alas, I don't understand from these pictures what an impulse is and what its criteria are. Only the big candle is visible.
I take it from this methodology that momentum is when the 5 EMA crosses 20 and that's it?
Yes, it's simple. But in order to distinguish an impulse from a correction we need to keep the notion of a wave level. VU - it is difficult to define this concept, but it can be expressed through synonyms: wave magnitude, size, dimensions, age, class.
I.e., we have an upward movement and the next downward movement. As long as the second (opposite) movement has not breached the base of the first, it is there - a correction. But, if the third movement opposite to the second one has started, the second one becomes an impulse in relation to the first one. And, to distinguish between movements and speak the same language, we introduce a "reference point", a binding to the Timeframe, i.e. the concept of a wave level.
Thus,
The timeframe is 1 hour:
- 5 EMA crosses 20 = H1 impulse
- 5 turns to 20 but does not cross it - correction of the level of the lower TF - M15 (multiple of TF - 4) in wave H1. If we move to TF M15, on it the correction on H1 will already be an M15 impulse.
- on H1 5 crosses back to 20, but the price does not break through the beginning of the impulse = current level correction = current TF flat = H1 correction/ flat
We should specify the principle of momentum definition using exact values. The exact values are candlestick size, the distance between candlesticks (horizontal and vertical), time intervals, events like crossing indicator lines, signal appearing, and so on.
I understand that you have to explain exactly, but then it would turn into a whole list of settings, let's say the same size on each instrument and at different times would indicate different things, for example during the day is a working price movement, but at night it is already increased volatility.
- Free trading apps
- Over 8,000 signals for copying
- Economic news for exploring financial markets
You agree to website policy and terms of use
I haven't found a similar topic.
Can you please tell me how to describe the pulse correctly in the ToR?
I understand how it looks on the graph, I can explain it on my fingers, but I can hardly imagine how to put it succinctly on paper.
Thank you in advance.