How to find two candlesticks from two different timeframes with same high and open (upper wick)
Step 1: You must decide what timeframe is your "working" timeframe - 'M5' or 'M20'
Step 2: If you selected 'M20' - you are considering a fully formed 'M20' candlestick (i.e. bar # 1 on 'M20') or the current 'M20' candlestick (i.e. bar # 0 on 'M20')
Step 1: You must decide what timeframe is your "working" timeframe - 'M5' or 'M20'
Step 2: If you selected 'M20' - you are considering a fully formed 'M20' candlestick (i.e. bar # 1 on 'M20') or the current 'M20' candlestick (i.e. bar # 0 on 'M20')
I am working on M20 because I'm interested in searching candlesticks on all lower timeframes between M20 and M4, so my working timeframe array is:
ENUM_TIMEFRAMES timeframes[] = {PERIOD_M20, PERIOD_M15, PERIOD_M12, PERIOD_M10, PERIOD_M6, PERIOD_M5, PERIOD_M4};
The search should done when the M20 candlestick closes, hence that's searching bar #1.
Should it be an indicator or an advisor?
It should be an advisor
You are taking data not from one M20 candlestick, but from two. This is your mistake.Also, your pictures do not match your description. Here are the true pictures and there are NO identical 'High' and 'Open':
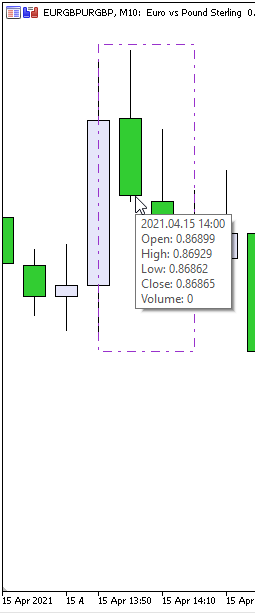
Or do you mean these two candles - their 'High' and 'Open' are equal?
Or do you mean these two candles - their 'High' and 'Open' are equal?
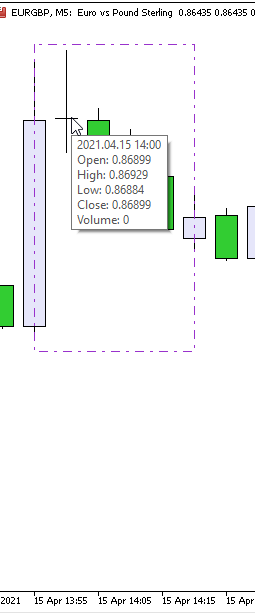
Yes I am referring to these M10 and M5 candles above with the mouse pointer. Their High and Open have the same values. So within M20 I want to search through candles from M20 down to the M4 candles.
There is a possibility that there would be more than one case, say M15 and M10 have coinciding High and open and M6 and M5 have coinciding High and Open.
I would more than be grateful if there could be two filters, where the final result would depend on the one chosen:
1. this would give the first or highest two timeframes that the equal High and Open occurs
2. the biggest Upper Wick. The highest two timeframes with equal High and Open does not always contain biggest upper wick. For example an M15 and M10 coinciding High and Open can have a smaller upper wick than and M6 and M5 coinciding High and Open.
I have a question: if you are working on a chart and the timeframe of this chart is 'M20' - how will you graphically mark candles AT LESS TIME FRAME
On the surface this seems like an easy question but it's not :). I guess there's no elegant solution to this. After giving it a lot of thought, I would go with two options which I realised I've been unconsciously using interchangeably depending on what I want to see. Broken horizontal line or a rectangle:
Firstly, I would use two broken horizontal lines to mark the High and the Open of the lower timeframe candle.
Secondly, I would draw a rectangle with the High and Open of the first of the two lower timeframes and extend it for the number of candles within M20. For example, say the two coinciding High and Open timeframes are M6 and M4. M6 is the higher of the two hence I'm describing it as the first of the two lower timeframes. The rectangle will be drawn from M6's High to Open and from the M6 candle extending to the last M6 candle that falls within the M20 candle
- Free trading apps
- Over 8,000 signals for copying
- Economic news for exploring financial markets
You agree to website policy and terms of use
I am trying to search through timeframes from M20 to M4 for two bearish candlesticks from two different time frames that have the same high and open.
The two candles may not be from consecutive timeframes. The images below give a better idea of what I am trying to achieve.
For some strange reason I’m not getting an option to paste the images in the post so I’ve attached them.
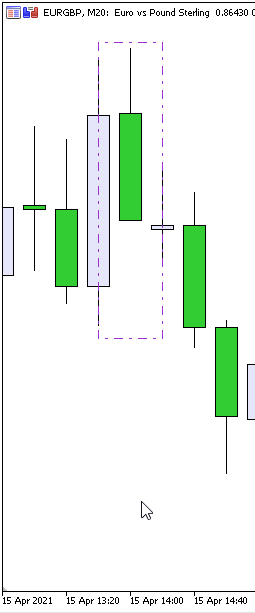
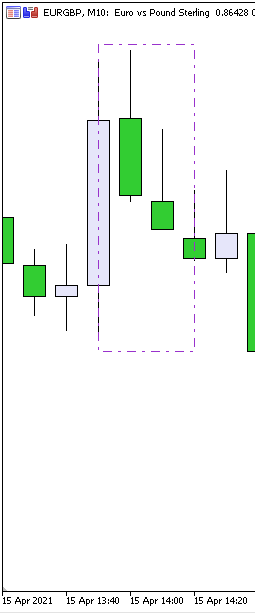
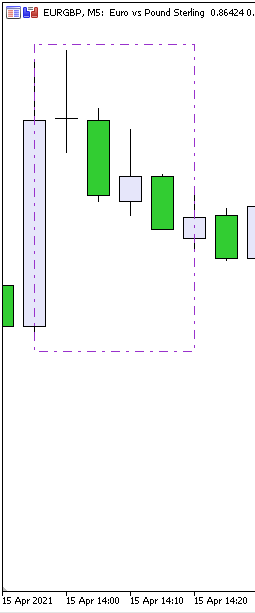
The attached marked M20 candlestick screenshot is the parent timeframe I’m looking through. The marked M10 candlestick is contained within M20 and has a high and open that coincides with another timeframe, which is M5. This is seen in an attached screenshot. The marked M5 candlestick contained in M20 has the same high and open as the above mentioned M10. This is seen in an attached screenshot.
Please note that there is the possibility that there’ll be more than two sets of upper wicks within M20 that satisfy the condition. In this case the higher timeframe in the region of interest.
I know that I’m suppose to use CopyRates() to do the multi timeframe search, but I’m not sure how to implement it to solve my specific problem.