School of Pimpology
Pivots
Just one last thing before I go.
The importance of Pivot Points.
We use these as support and resistance levels.
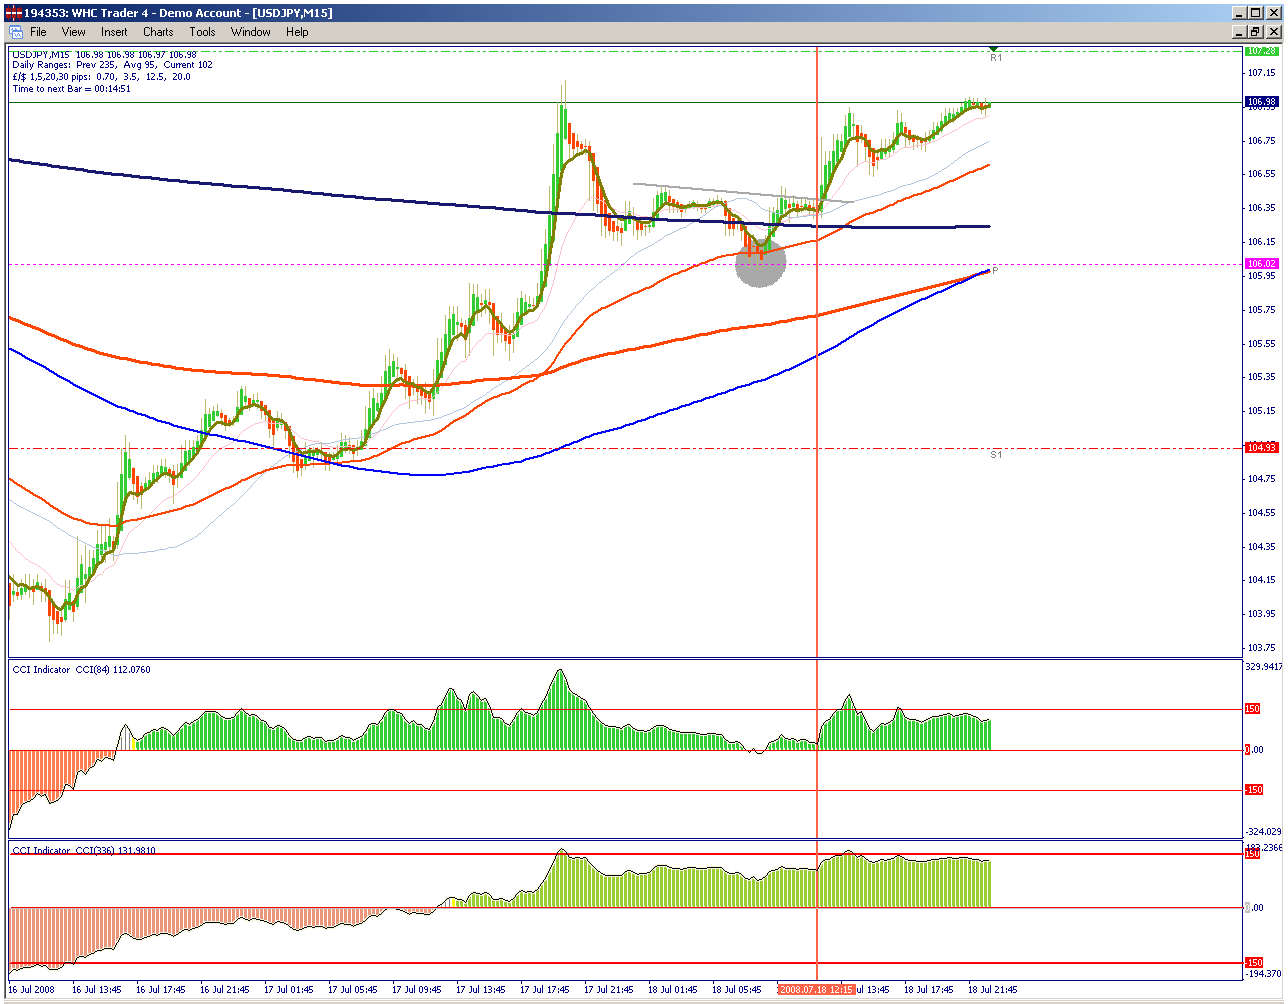
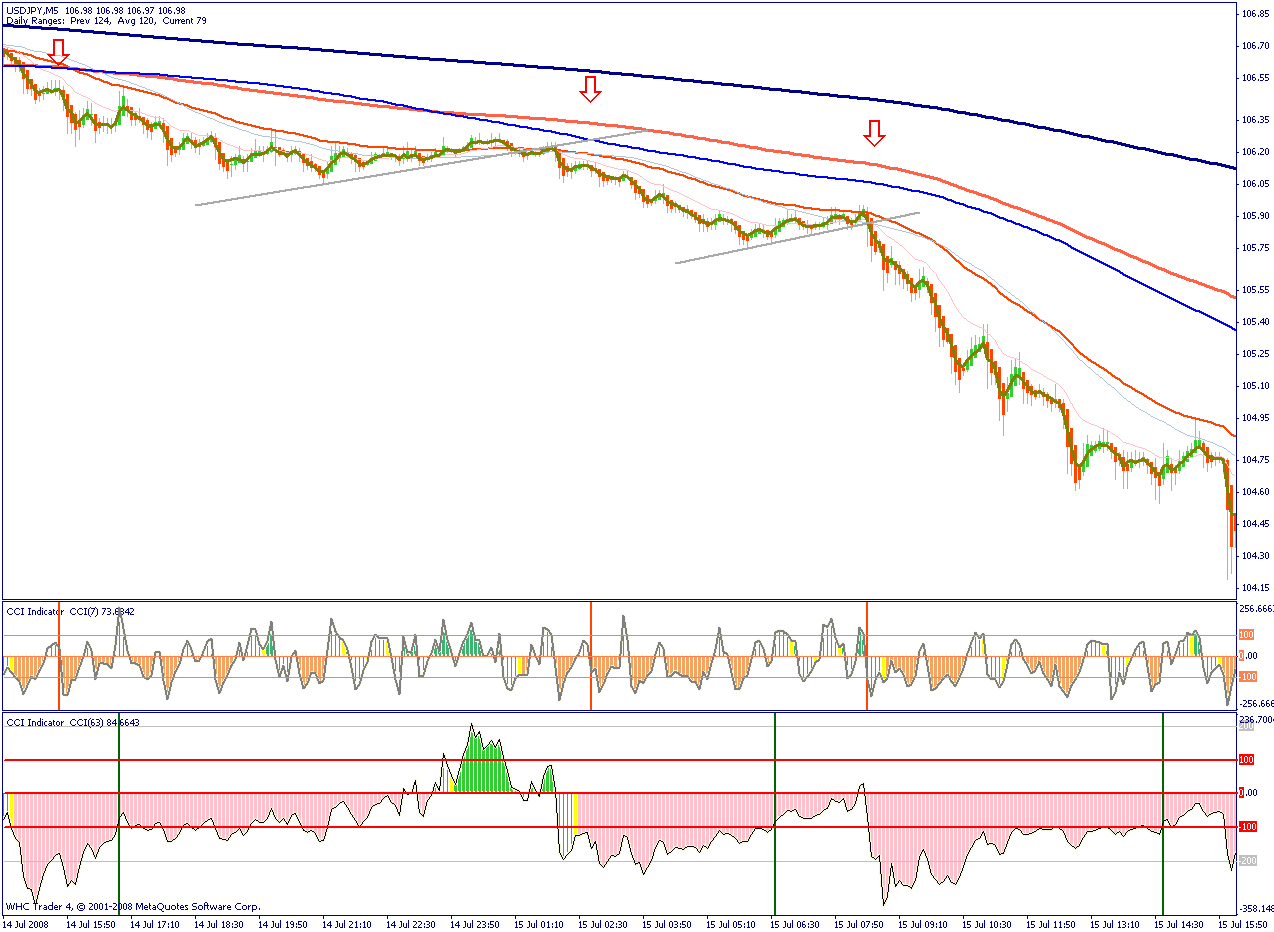
See how the 5m picture with just the purple pivot looked on yesterdays USDJPY.
We were only looking for long positions with Crude and Gold falling remember.
Now look at the second snap-shot with our moving averages.
The entry point on the second picture was later, granted, but with all m.a's stacked on top of one another and supporting price action there was still 50-60 pips available, and safer too
Indices
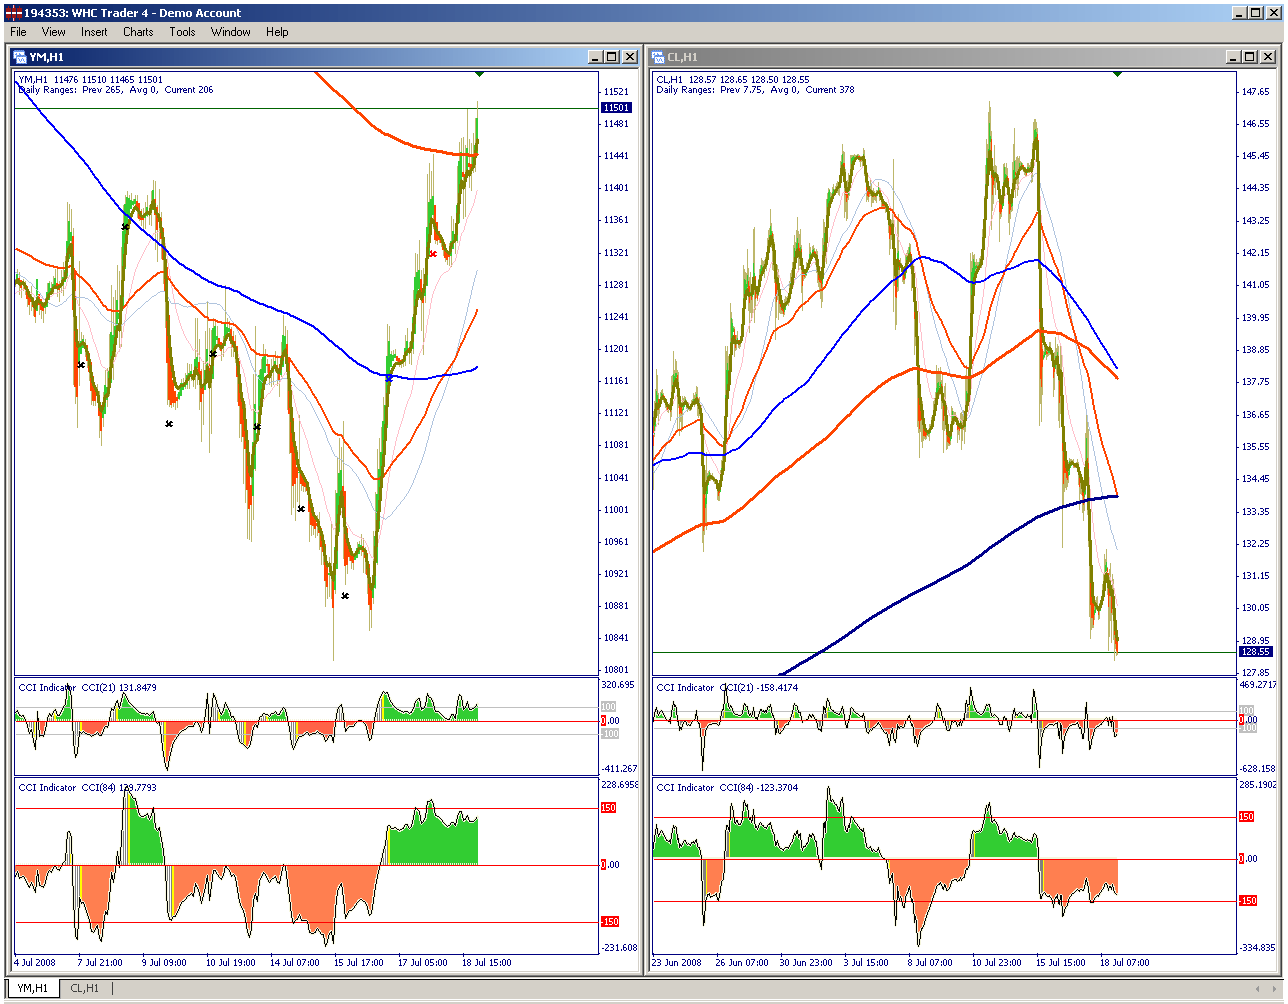
A few people have asked me about my thoughts on correlation between USDJPY and the Dow Jones.
As mentioned in previous posts I consider Crude Oil to be the Chairman of the Club, with Gold the Manager who controls the players being the Major Currency pairs including USDJPY
I also like to visualise this 'Chairman' as having his sticky fingers in many a pie including the Stockmarkets.
See how the stronger Dollar on the back of weaker Crude gives impetus to the Dow Jones, who coincidentally is the CEO and driving force of the rest of the major Indices. Frankfurts XetraDax, Paris's CAC40, London's FTSE100, Tokyo's Nikkei225 and so on are all bossed about by the Dow, who I like to see driven by the opposing directiojn of Crude Oil at the moment.
Naturally this is not always the case and it won't last forever, but it's a very good benchmark to use right now as the snap-shot clearly demonstates.
Excellent presentation, Pimp. Thanks for taking the time.
MM
Thanks for your time.
What a wonderfull and useful thread, tnks again and please let me know where you post the template. tnks and continue the excelent work.
GOOD TRADES FOR ALL
Others from same period
I was attempting to tile the trades from the other three Majors over the same 24hr period but it's not so clear.
Therefore I post these as seperate charts.
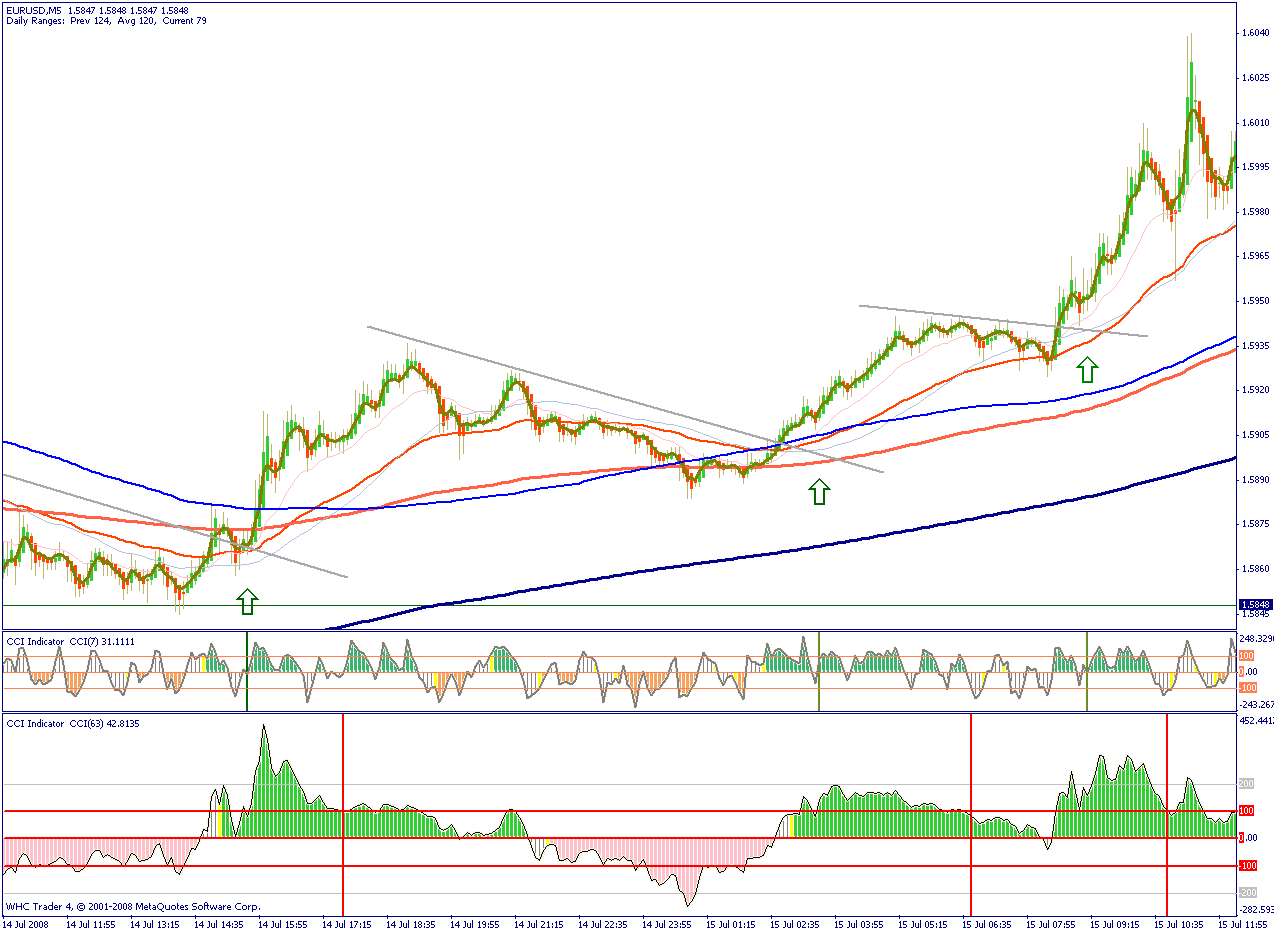
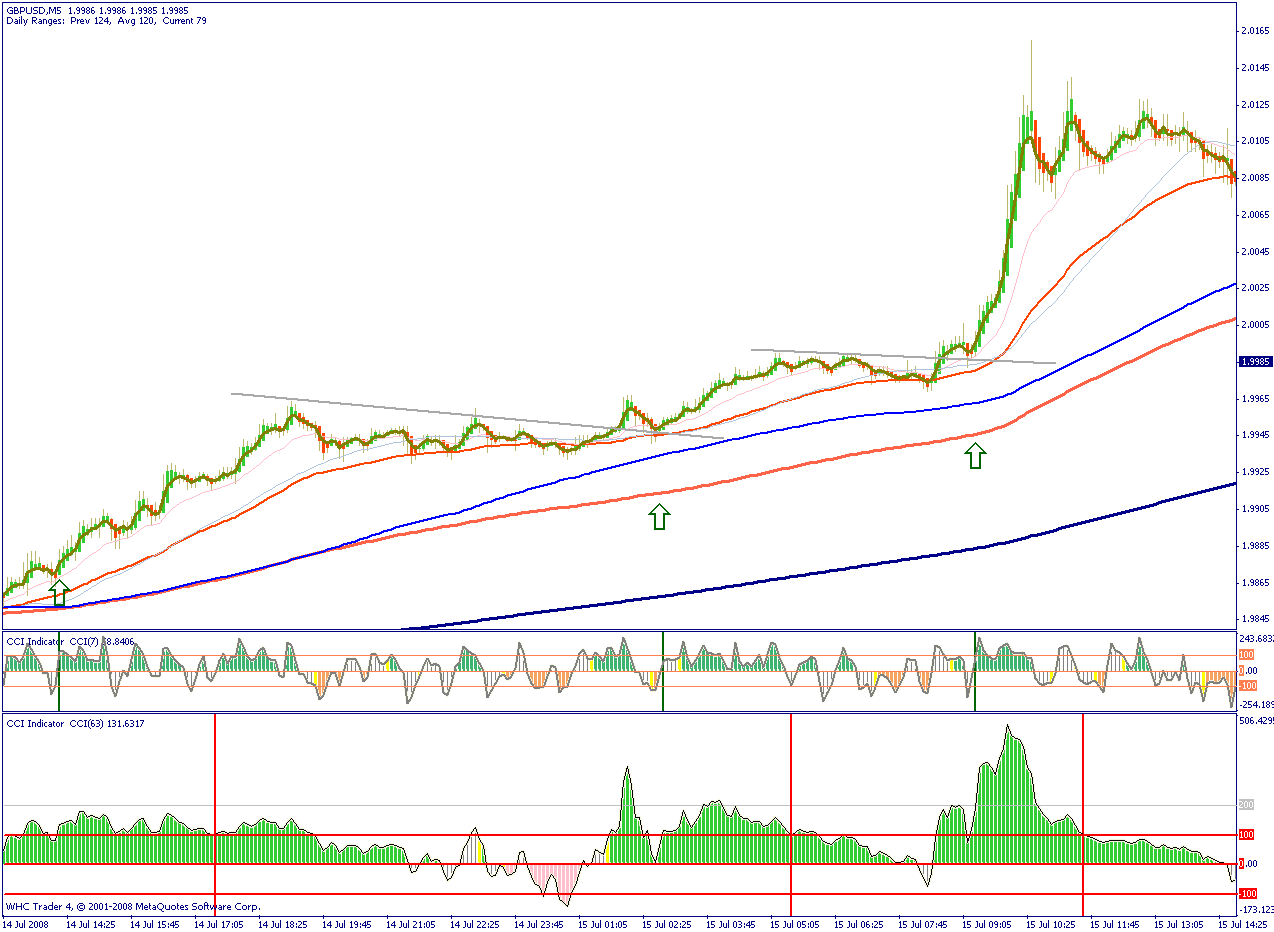
The vertical lines in the 7CCI window represent the entries along with the arrows on the chart, the lines on the 63CCI in the bottom window represent the exits.
EURUSD - 3 trades-Total 80 pips
GBPUSD - 3 trades-Total 180 pips
USDJPY - 3 trades-Total 130 pips*
The frist one on the JPY could've stopped you out if you had used this method solely. This is the reason I use Moving Averages in conjunction with the CCI. Anyone could see that the averages were tightly bunched on the JPY and resistance was going to be very strong there. A sensible stop sould have you kept you in which I'll come onto very soon.
I just wanted to demonstrate to a brand new novice that you can make pips just by using this method of entry and exit. It's not that difficult to master and pretty effectice.
Nice thread
Thank you Pimp.
A very interesting thread.
Template
What a wonderfull and useful thread, tnks again and please let me know where you post the template. tnks and continue the excelent work. GOOD TRADES FOR ALL
Jottaerre. Sorry I didn't post the template did I ?
The reason for that is it's over 5MB in size for some bizzarre reason.
If you'd care to email me then I will gladly forward it to yourself and other readers who would like it.
A big hello to Scorpion too. Glad you found me and glad to be of assistance.
Welcome aboard and enjoy the reading.
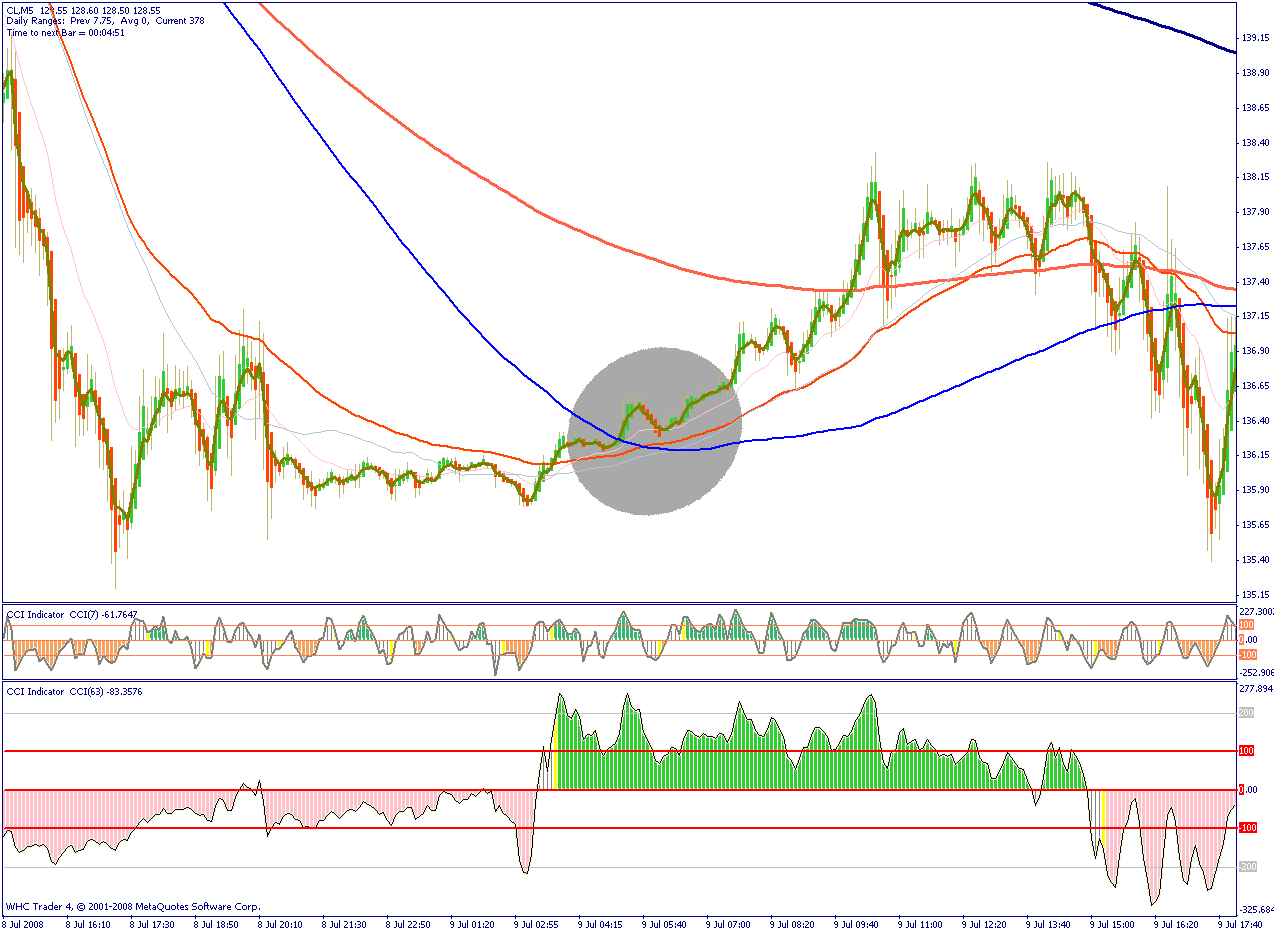
Same story, different day
Here's the same set-up on the Crude but from another day.
Exactly the same as the second highlighted area in the previous post.
How easy is that?
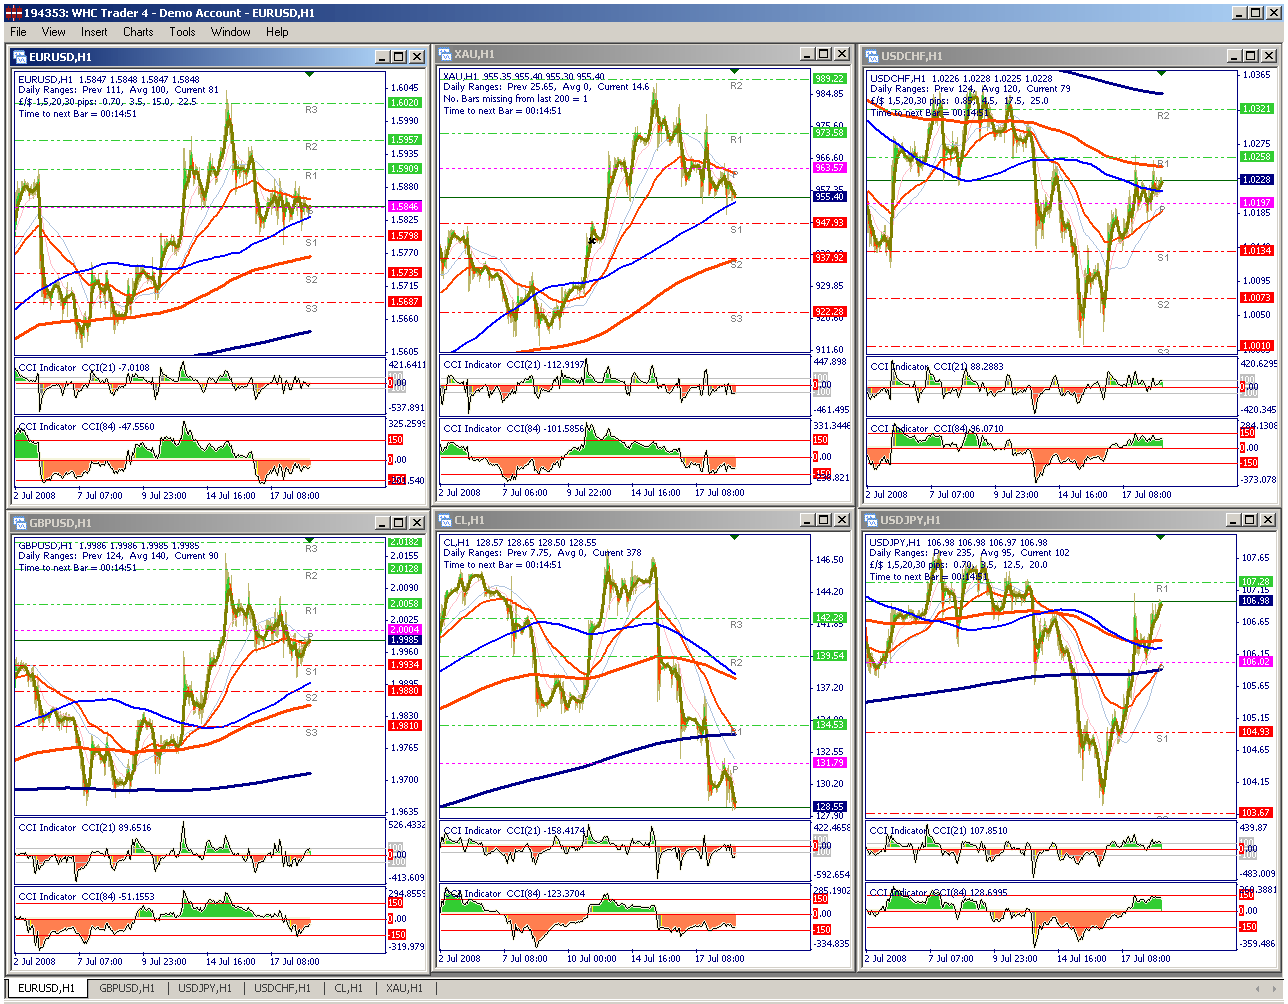
Tiles
We now have the template saved and are ready to move along.
I have tiled the 6 charts in this order for easy reference.
Top - EURUSD GOLD USDCHF
Bottom - GBPUSD CRUDE USDJPY
Notice the 84 CCI on the Gold and the Crude, they are both down.
What does this tell us? We are looking at down trends in Gold & Crude which means a stronger Dollar.
With a stronger Dollar We are looking for Long positions on USDCHF and/or USDJPY. We are looking for short positions on EURUSD and/or GBPUSD.
Notice the 84 CCI's on GBPUSD & EURUSD are also down with Gold and Crude, whilst they are up on USDCHF & USDJPY.
That completes the set-up procedure. I attach the colour CCI and Pivot point indicator for you to add to your Pimpology template.
Don't forget to re-save the template once you have added both to one chart.
Ohhhhh, I almost forgot.
2 things. Firstly I don't use regular candlesticks, I use Heiken Ashi averaging candles (I have attached this thim bodied one which is nice. It's MTF so you'll need to change the timeframe to 0)
Secondly I use a lower timeframe 20ema too on each of the charts.
On the 60m its a 5, on the 15m it's a 7 and on the 5m its a 4.
60m 5ema = 15m 20
15m 7ema = 5m 20
5m 4ema = 1m 20.
These averages will run through the Heiken Ashi candles and we'll see later in the set-ups why I really like to use them.
OK, we now know IF crude is going up and Gold is following suit that we don't want to be shorting EURUSD or GBPUSD. We also know that if Crude is dumping and Gold following suit that we don't want to be shorting USDJPY or USDCHF.
What do we do when Gold and Crude are moving in OPPOSITE directions?
Well for me, I never know how much longer the anti correlation will last. If Crude is falling yet Gold is going up, do I really want to be long EURUSD?
Not really. This is the time when I sit on my hands and do nothing.
The Chairman of the Club will eventually always have his way with the Manager.
We're clear on correlation now then? ...........Good. lets move on to the Entries and Set-ups.
Quick lesson for the Brand Newbie
Before we get going on entries it's been brought to my attention that many novice traders are having some problems with keeping up with all the charts that I cover and are finding it even more difficult actually following the trades.
It's all well & good when you have 3,4 or 5 screens, but as some of you are working from a single laptop I'm going to make a little suggestion that will pretty much ensure that you never miss another trade again.
Why do we miss trades? We're looking at something else.
Why were we looking at something else? Because we are looking at too much.
Why are we looking at too much? Because we don't want to miss a trade !!
The neverending circle of viciousnessnessnessnessness........ ..
Well most markets move at the same time so unless you have an unlimited account, the chances are you are going to take on one trade anyway. The problem is finding the best one.
How do you identify the best one?
You need to spend some months studying correlation and ascertain the strongest and weakest currency pair at any given moment.
This lesson is going to be a good foundation from which to begin your quest on the correlation highway and I hope it helps you make more successful trades and helps cut down on your mistakes.
Once you've mastered this you may want to look further afield, or you may wish to stick with this.
This is how it works.
Gold, as many of you know is one of the main driving forces at the moment of the FX pairs. It's a great representation of USD strength or weakness. Yes it's driven by the Chairman of the club, Crude, but if its falling heavily you probablr know WHY without looking at Crude.
So, by assessing in which direction USD pairs are likely to go, we follow Gold.
Gold goes up, USD is weak, Gold goes down, USD is strong. How am I doing?
Now a pair with USD as the prefix, or first three letters of the pair as already discussed - USDJPY, USDCHF etc move up with a strong Dollar and down with a weak Dollar, opposite to Gold.
A pair with USD as the suffix, or last 3 letters of the pair as discussed previously - GBPUSD EURUSD etc move up with a weak Dollar and down with a strong Dollar, the same as Gold.
Take a look yourself at a daily chart for EURUSD and Gold in a previous post. Now take a look at the same Gold daily chart with a USDCHF daily chart tiled horizontally. Almost indentially opposite.
So what we're aiming to do here is take one position at a time on either USDCHF or EURUSD. Easy.
The problem lies in identifying which is the best trade to take when Gold is strong. Is it EURUSD long or USDCHF short?
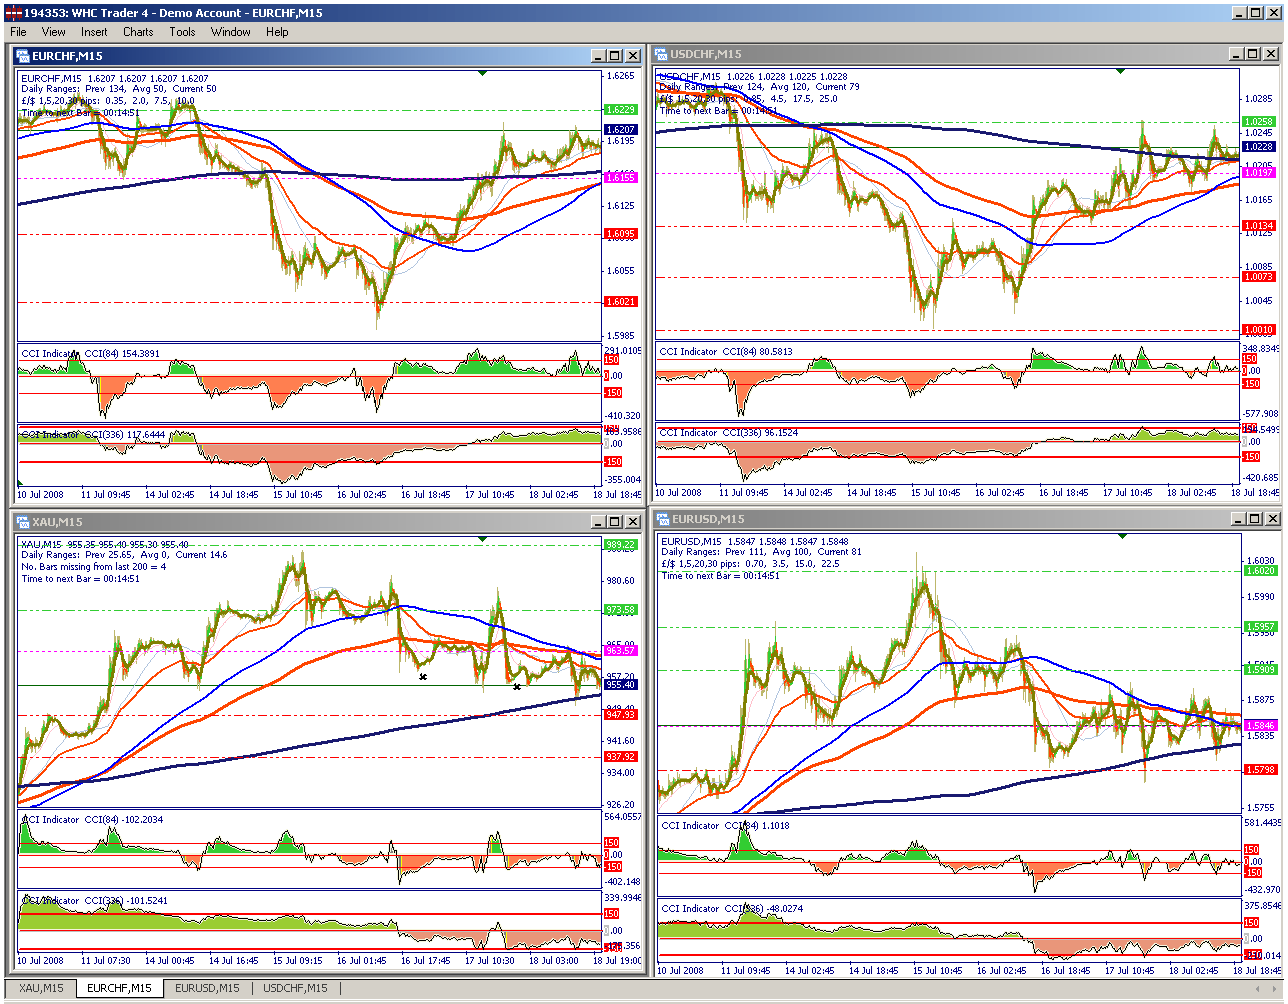
Introcducing ladies and gentlemenn, flown in tonight espcially, all the way from the Alps, the one and only........ EURCHF.
We can see which is strongest between the Euro and the Swssie by looking at this chart.
When its above ma's and moving up it's Euro that's the strongest. When it's below m.a's and moving down it's Swissie that's strongest.
As an example, let's assume we are looking at a weaker Dollar with Gold moving up. We know this means a weak Dollar and therefor we are looking EURUSD long OR USDCHF short
We also see the EURCHF chart down. This means the Euro is weaker than Swiss so we opt for USDCHF short as the Swiss is likely to be the better mover.
If we see the EURCHF chart moving up, we can safely say that Swiss is weaker so we'd opt for the long EURUSD.
Start by tiling 4 charts. EURCHF in the top left Gold in the bottom left.
EURUSD in the bottom right, USDCHF in the top right as in the attached picture.
Having established the direction of Gold and which is stronger or weaker of the Swiss or the Euro we are ready to look for possible plays.
It's nice and simple, and in this example. with Gold moving up and EURCHF moving down, we know that Swiss was stronger than Euro so USDCHF short was a better option than EURUSD long. It moved 200 pips from the cross of the 84 CCI, opposed to EURUSD's 160. Only 40 pips I hear you say !
Well if I could get an extra 20% or more out of a trade I most certainly wouldn't turn it down.
May this serve you well.
- Free trading apps
- Over 8,000 signals for copying
- Economic news for exploring financial markets
You agree to website policy and terms of use
Welcome to the School of Pimpology
Since trading and experimenting various different methods over the years, I thought it time to share some of my knowledge and as some would kindly say "pearls of wisdom".
I will focus on various topics for different levels of expertise, but one thing that time has taught me in this trading world is that keeping it simple is the best policy.
I have put together and will demonstrate a simple technique, using moving averages, CCI's and Pivot Points only.
We will focus on 3 timeframes, the 60m, 15m and 5m.
The instruments we will be looking at early on in the thread during the lesson will be 4 x Major currency pairs.
GBPUSD EURUSD USDCHF USDJPY.
Crude oil & Gold.
I will come onto the indices later along with other currency pairs.
So, what can you expect from me?
I will post toward the back end of the thread, after the lessons, a play of the day for the New York session.
The morning play of the day can be found on YouTube (NEW).
My template will be available to anyone who wants it too.
I would like to limit most of the questions to those regarding my strategy so as not confuse, and more importantly would love to build a school of novice traders into an school of Pip Demons.
Let's work together to build a team of like minded, fun loving individuals from around the globe who we can all have a bit of a laugh with whilst making money.
You only need 50 pips a day to make the big time at this game. Many bank traders are targeted 100 a week at the moment, and you will see in a very short space of time that 50 a day is very realistic with this strategy.
NOTE : THIS IS A STRATEGY, NOT A SYSTEM. IT IS NOT FOOL-PROOF AND CANNOT BE PROGRAMMED INTO AN E.A. IT REQUIRES HARD WORK AND DEDICATION AND WILL NOT BE EASY TO MASTER. BUT AS CONFUCIOUS SAID "EVERY JOURNEY START WITH SINGLE STEP"
Happy Pimpin'
F$X$P
Since beginning this thread I have added a standalone 4hr strategy you can find from page 32, a 4hr with 5m entry from page 42 and a 5m scalping strategy on page 44.
UPDATE 28/08/2008 You will need to read all this thread to get a grasp of how the moving averages work with one another and the different CCI setting and so on, but once you have completed it, there is hope. I have managed to squeeze all three strategies on to one pretty fine template.
Don't worry too much about the alterations throughout the thread. These were done purely for visualisation purposes. The final template will reveal all.
UPDATE 22nd November. From Monday 24th I will be posting a play of the day VIDEO each morning with the best set up using this strategy. I will endeavour to give concise analysis of the pair (20 to choose from), along with suggested entry/exit points for both short term and long-term traders. This video, outlining the pimpalicious play of the day will be available on youtube at 5am UK time, 6am CET, Midnight EST and evening for the Asian, Australian and west coast massive. Click here to go to the page and subscribe. Yes it's Free too. Oooooh Exciting
UPDATE 26th November.
Just to let you know guys and girls, just to vary and to prevent me from repeating myself I am going to reschedule postings.
5AM - YouTube
1PM - Here
8PM - Facebook Group
You can see it Youtube vids here
The facebook group will be here
UPDATE - MARCH 2009 - Due to the size of this thread now I am in the process of putting together a more concise intensive training course for novices. It will consist of just 12 lessons and will arm you with all the tools you need to succeed
You can find it here. https://www.forex-tsd.com/forum/debates-discussions/10648-pimpology-lives-on-intensive-care-for-newbies
UPDATE: April 2009. This thread will now be reactivated and will focus on longer-term trading.
Since I have the 4hr strategy and our friend Strato made such a fine job of covering the longer-term here, I will endeavour to continue with this along with Daily and Weekly chart set-ups.
Everything on the 60m/5m will be found here
If you want a word document that breaks this thread down then please feel free to email me.