Смотри обучающее видео по маркету на YouTube
Как купить торгового робота или индикатор
Запусти робота на
виртуальном хостинге
виртуальном хостинге
Протестируй индикатор/робота перед покупкой
Хочешь зарабатывать в Маркете?
Как подать продукт, чтобы его покупали
Торговые роботы и индикаторы для MetaTrader 5 - 53

Ilan is a well known algorithmic trading system with its advantages and inconveniences. He is reputed to have good results when the prices are in a range but also to blow up the accounts in the case of strong trend. From a basic Ilan system, I added a trend filter to detect range periods, so that it trades only during these periods. I have also added a feature allowing it to adapt to economic news, it will not trade from one to several hours before and after a news depending on its importance. O

This is a rate of change chart from the baseline. features. comparison of max 5 symbols. free baseline with drag. free timeframes of the sub window. reverse chart selectable if you need.
i.e. set symbols "-US100" notes In the sub window, you can't believe datetime on the chart, because the numbers of bars are different. You can check the baseline if you click symbol name. The dragged baseline is temporary. You must set it to indicator's parameter if you need.
FREE

Highly configurable Demarker indicator.
Features: Highly customizable alert functions (at levels, crosses, direction changes via email, push, sound, popup) Multi timeframe ability Color customization (at levels, crosses, direction changes) Linear interpolation and histogram mode options Works on strategy tester in multi timeframe mode (at weekend without ticks also) Adjustable Levels Parameters:
Demarker Timeframe: You can set the lower/higher timeframes for Demarker. Demarker Bar Shift: Y
FREE

MACD indicators https://mql5.com This MACD indicator looks slightly different from the MACD indicator found in many other charting software. When the value of the signal line parameter is greater than the value of the MACD parameter, the indicator will give a buy prompt, and when the signal line parameter is less than the value of the MACD parameter, the indicator will give a sell prompt.
FREE

Black Friday PROMO launch My portfolio . I am giving this expert advisor for FREE.
The Expert Advisor has been developed by AI for Nikkei and M15 timeframe. There is no need to set up parameters, all settings are already optimized and fine-tuned. Recommended broker RoboForex because of EET timezone.
My recommendation is to have a look also at the rest of my products in the portfolio, as they work very well together in combination. Check other portfolio screenshots.
Dax Ai , Daw Ai , Niki A
FREE

Это утилита для работы с данными тиков Binance Futures в реальном времени и данными спотовых тиков Binance в реальном времени. Он разработан, чтобы получать данные быстрее и оставаться в рамках Binance Future.
Логика работы: глобальные переменные записывают информацию о времени, которую она получает от Binance Check Server Time.
В других программах они выполняют свою работу быстрее и эффективнее, используя эту информацию о времени.
Вы должны разрешить WebRequest в меню Инструменты >>
FREE

Советник PipTick Basket может открывать до 10 сделок одновременно. Он разработан для трейдеров, торгующих корзинами инструментов, которым необходимо открывать множество сделок на разных парах. Советник позволяет установить значения тейк-профит и стоп-лосс в деньгах для каждой сделке в корзине. В советнике также есть функция хеджирования, которая позволяет трейдерам использовать классическую хеджевую стратегию или стратегию Sure-Fire, также известную как "всегда в прибыли”.
Основные характерист

Это Бета версия моего трендового индикатора. Он построен на принципе схожем с нейросетями, и это расчет многомерного полинома. При установке его на график или при изменениях в параметрах индикатора, а также при переключении периода графика, происходит первоначальная инициализация индикатора. При инициализации не только пересчитывается весь период графика, но и происходит самообучение индикатора. Параметры индикатора: Sensitivity (100 max) - чувствительность к глобальным трендам, определяться ус
FREE
Утилита управляет любым параметром любого индикатора с помощью прокрутки колеса мышки. Вы можете установить данную утилиту и изменить интерфейс любого индикатора из стандартной поставки терминала . Для пользовательских индикаторов, а так-же купленных на "Market", есть утилита Universal Scroller . Принцип действия
Утилита управляет одним из параметров, который вы выберете, меняя его с помощью прокрутки колеса мышки. Активация режима прокрутки включается наведением курсора на кнопку, или нажати
FREE
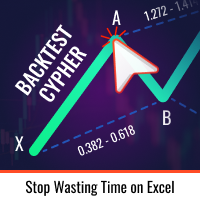
Тестирование ваших торговых идей и их поведение на рынке никогда не было таким простым. Просто выберите любой гармонический паттерн "Cypher" из прошлого всего за 4 клика на вашем графике, добавьте его в список тестирования, и вуаля! Вы получите полный анализ данных для каждого символа и таймфрейма.
Гайд: Как торговать паттерн "Cypher"
Обратите внимание, что робот не работает в Стратегическом Тестере Выбор паттерна "Cypher" всего за четыре клика Автоматическая настройка уровней SL и TP Нескол
FREE

ATR Monitor ATR is a measure of volatility introduced by market technician J. Welles Wilder Jr. in his book, "New Concepts in Technical Trading Systems". In general, traders are accustomed to seeing the ATR in the form of a sub-window indicator. What I am presenting here is a simplified version of ATR - just the current ATR number - very useful for monitoring just the very moment of the current chart. And, by default, this indicator will not show up on screen, you can just use the buffers thems
FREE

Бинарный индикатор находит свечной паттерн "Поглощение" и рисует соответствующий сигнал для входа рынок. Имеет встроенные фильтры и панель для просчета количества успешных сделок. Демо версия является ознакомительной, в ней нет возможности изменять параметры. Полная версия . Особенности Работает для всех валютных пар и любых таймфреймов. Индикатор рассматривает комбинацию из 2-х или 3-х свечей в зависимости от настроек. Имеется возможность фильтровать сигналы путем настройки количества свеч
FREE

The indicator ‘Probability Range Bands’ gives a prediction of the amount, how much the asset is moving from its current price. The range bands give probabilities, that the candle close will not exceed this certain price level. It is also called the expected move for the current candle close. This Indicator is based on statistical methods, probabilities and volatility. Asset price is assumed to follow a log-normal distribution. Therefore, log returns are used in this indicator to determine the

This product is converted form Trading View of Kivanc Ozbilgic to be used on MT5 and below are descriptions of developer on Trading View:
Anıl Özekşi's latest development on his precious OTT - Optimized Trend Tracker:
In this version, there are two lines of OTT which are derived from HIGHEST price values (HOTT) and LOVEST price values (LOTT) which were originally sourced to CLOSE values on default OTT.
Another significant difference is there is no Support Line (Moving Average) in this ver

BestPointOfInitiation是一个很好的短线交易指示器,能与 ShortBS ( https://www.mql5.com/zh/market/product/96796 )完美的配合,可以很好的指出最佳的buy和sell位置,指标不含有未来函数,不会重新绘制,不仅能够应用到自己的手动交易过程中,还能完全可以写入到自己的EA中。(如果你感觉到这个指标能够帮助你进行更准确的交易,请帮忙给个好评,希望我的作品能够帮助更多多有需要的人) ===================参数列表===================== fastPeriod: 9 slowPeriod:30 PassivationCoefficient:5 =================参考使用方法=================== 此指标可以适用于任何交易品种,能够用在任何周期。

Boom and Crash Buy and Sell Trend. Non-repaint. Can be used on all timeframes 1 minute for scalpers. 5 minute to monthly timeframe for swing trading. works on all boom and crash pairs Crash300, Crash500, Crash1000. Boom300, Boom500, Boom1000. Green histogram colour means the trend is up(bullish) Buy signal. Dark orange histogram colour means the trend is down(bearish) Sell signal.

Here is the boom and crash crazy Ma scalper a secretly coded color MA that is 1000% NON-REPAINT Works best on boom and crash 1000 Can be used on all timeframes from the 1 Minute timeframe to the Monthly timeframe The indicator is also a multi-time frame indicator you can select which timeframe to use The indicator is made for scalping purposes. as the trend changes the color of the indicator changes all well

Volality 75 Fractal Scalper Non-repaint The arrows appear on the current candle. momentum and trend based strategy Works on all timeframes from the 1 Minute to the Monthly timeframe Bollinger bands have been added to show the trend direction whether its bullish or bearish Blue fractal arrow is your buy entry Orange fractal arrow is your sell entry you can use the Vix 75 fractal scalper in combination with other indicators.
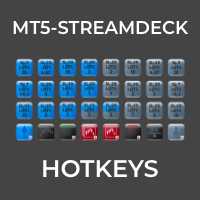
MT5-StreamDeck offers the possibility to use a certain number of pre-programmed Hot-keys with a clearly defined role. So by the push of a button you can open a trade with a pre-defined lot size, stoploss and take profit. Close all your trades, close the ones in profit, or in loss, set Break-even or set a trailing stop. All this with a Hot key button. See the feature list for all the actions that can take place at the push of a button. Ideal for Quick Scalping or day trading with set risk manage
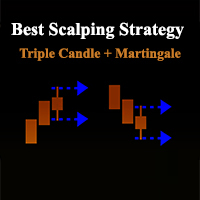
Best MT5 Scalping Strategy 3 Candle Parámetros recomentados H1 lotaje 0.01. Gestión del riesgo profesional Descubre el Robot de Scalping basado en la Estrategia de las 3 Velas. Este robot de trading de Forex ha sido desarrollado por MRBEAST como una herramienta para facilitar el trading intradía. Tenga en cuenta que el uso de este robot implica ciertos riesgos y no garantiza ganancias consistentes en el mercado de divisas. El robot de trading se basa en algoritmos y estrategias que he diseñado,

This indicator is converted from UT Bot alerts indicator by @QuantNomad of Trading View to MT5. its considering ATR and creating new candles on chart and also is giving good entry points based on its candles. all buffers of new candles and also entry signals are included as buffer so can be used easily on any EA. there are also some different strategies on the internet that can be used or contact me to create it for you.

DESCRIPTION: The EA is a trade manager for managing manual or other trades by EA. It can place Stoploss, Takeprofit, Trailing, and Martingale/Average all open positions. Make sure to just place 1 type of open orders for each symbols (Examples: 1 Buy or 1 Sell). The EA will not open the initial trades, but can be backtested to see how it works.
FEATURES: Multicurrency or Single Pair Mode. Placing Stoploss / Takeprofit. Auto Martingale / Average Positions. Trailing for All Open Positions (Si

Ticks Candles Chart индикатор для построения еквиобъемных графиков для стратегии Оракул Для удобства выполнен в виде индикатора Период в тиках задается непосредственно на графике Тиковый график является отдельным окном Рекомендуется использовать периоды тиков от 50 и выше Работает только в реальном времени
Входные параметры Ticks_In_Bar - период в тиках по-умолчанию Counting_Bars - сколько бар тиковой истории строить (примерно) Custom_Symbol_Suffix - дополнительный суффикс для символа

verview: Our custom Kalman Filter indicator is a sophisticated, adaptive tool designed for MetaTrader 5 (MT5), offering traders a dynamic approach to analyzing financial markets. This indicator is based on the Kalman Filter algorithm, a powerful statistical method used for linear dynamic systems estimation. It's tailored for traders who need an advanced, responsive tool to track market trends and make informed decisions. Key Features: Dynamic Trend Analysis: The Kalman Filter continuously adjust
FREE

Introduction to X3 Chart Pattern Scanner X3 Cherart Pattern Scanner is the non-repainting and non-lagging indicator detecting X3 chart patterns including Harmonic pattern, Elliott Wave pattern, X3 patterns, and Japanese Candlestick patterns. Historical patterns match with signal patterns. Hence, you can readily develop the solid trading strategy in your chart. More importantly, this superb pattern scanner can detect the optimal pattern of its kind. In addition, you can switch on and off individu

Chart Notes = MULTI LINE TEXT INPUT ON CHART FOR MT5 is finally here! # sticky notes This indicator is a powerful text editor for placing notes on chart, similarly like the feature on Tradingview.
There are 2 types of messages: anchored (on screen ) and free (on chart).
1. Anchored = stays on the same place on screen (x point, y point) -this text can be EDITED on click (first line is for dragging the message around- this line is edited via right clicking- >properties) -move the messages by

1. Why did I develop this series of indicators
I found that most traders need to use multiple time frame indicators. They usually switch time frame to see indicators. However, once the timeframe is switched, you cannot see the corresponding relationship between the price in the smaller timeframe and the indicator in the larger timeframe . For example: if your price chart is in H1 timeframe, you can see H4, D1 and W1 indicators in H1 timeframe Chart. This is more helpful for you to find t

Способ применения Pair Trading Station Рекомендуется использовать Pair Trading Station на таймфрейме H1 с любой валютной парой. Чтобы получить сигналы на покупку и продажу, следуйте указанным ниже инструкциям по применению Pair Trading Station в терминале MetaTrader. При загрузке Pair Trading Station на график индикатор оценит доступные исторические данные на вашей платформе MetaTrader для каждой валютной пары. В самой начале на графике отобразятся исторические данные, доступные для каждой валют
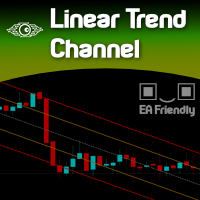
Imagine a way to automatically and clearly recognize the direction of the current market. Uptrend or Downtrend?
Forget about moving averages, there is a simple way to determine that. Welcome to the world of statistics. Welcome to the simple yet powerful world of Linear Regression. Just a complicated name for a genius and simple measurement.
Calibrating this indicator is pretty clear and obvious since the degree of freedom is total and deep.
Once calibrated to your desired Symbol/Asset,
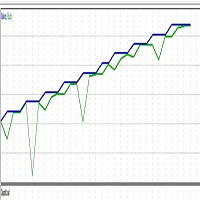
Trading is a skill where you can have your own skill and your own process. So, he advice that you try do what work for you. Trading is not a get rich quick scheme. when you stick to it long enough, it could change your live. Psychology and emotion is very important. Taking basic long and short trades automatically based on MACD and bear power. The robot is a test project by chrisdgenius aim to increasing profitablility.
FREE
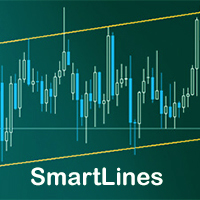
SmartLines позволяет открывать ордера при помощи трендовых линий. SmartLines для MT4 https://www.mql5.com/ru/market/product/25875 Теперь у вас появилась возможность контролировать выход цены из трендового коридора автоматически и без задержек. Как только цена пересечет установленную вами трендовую линию с нужными вам настройками, ордер автоматически открыт. Вы не пропустите момент смены тренда. Принцип работы со SmartLines похож на выставление отложенных ордеров, однако отложенные ордера имеют т
TrendFollowMT is a fully automated trading system which is using large time frame to determine the trend and use small time frame to find the entry point. Once the trend changed to opposite side, the system will wait for another entry point to recover with bigger lot size. Moreover, the target profit will be moved up when more position had been opened. The aim is to cover the cost of waiting time and risk.
Free version will only trade on buy signal and locked the initial Lot size (0.01). Paid
FREE

candlestick time it a useful indicator ,it help to keep you alert with the candlestick time ,how far to be completed at the chosen period , it help to keep you patience which is a biggest thing that holds trades down ,try it to improve you way of trading. it work on any broker any time frame and any symbol. you can customize the color on input. it can work on multiple timeframe. Thank you !
FREE
Please, if you like this AE, I would appreciate it if you could rate it with 5 stars ️ ️ ️ ️ ️ THANK YOU!!
The expert advisor includes the following parameters: Magic number: Maximum slippage: Stop loss (pips): Take profit (pips): Trailing stop (pips): Trailing step (pips): Fixed lot or Risk: Info panel: This expert advisor does not use any dangerous strategy, such as martingale or grid, which can generate a total loss of the account. The Expert Advisor incorporates an inf
FREE

Это демо версия индикатора Candle Absorption Full . Имеет ограничения на работу. Индикатор находит свечной паттерн "Поглощение" и рисует соответствующий сигнал для входа рынок.
Особенности Работает только с инструментом EURUSD на таймфреймах M1 и M5. Индикатор рассматривает комбинацию из 2-х или 3-х свечей в зависимости от настроек. Большое количество заранее просчитанных баров на истории (сигналов). Есть возможность получать уведомление о найденном сигнале. Имеется возможность фильтровать сиг
FREE

The Breaker Blocks with Signals indicator aims to highlight a complete methodology based on breaker blocks. Breakout signals between the price and breaker blocks are highlighted and premium/discount swing levels are included to provide potential take profit/stop loss levels.
This script also includes alerts for each signal highlighted.
SETTINGS
Breaker Blocks
Length: Sensitivity of the detected swings used to construct breaker blocks. Higher values will return longer te

Профессиональный инструмент для торговли - индикатор дивергенции между AC и ценой, позволяющий своевременно получать сигнал о развороте тренда или ловить движения откатов цены (в зависимости от настроек). Настройки индикатора позволяют регулировать силу дивергенции за счет угла наклона пиков AC и процентного изменения цены, что даёт возможность тонко настроить силу сигнала. Код индикатора оптимизирован и в составе советника очень быстро тестируется. Индикатор не перерисовывает, стрелки для на
FREE

Удобное средство для измерения расстояния между ценами в пунктах непосредственно на графике. Отображает измерения между точками в процентах, пунктах (финансовых) и времени (барах). Совместим со всеми графическими таймфреймами. При фиксировании на графике отображается во всех таймфреймах. Нажмите Ctrl, нажмите на первую точек, переместите указатель мыши, и утилита отобразит измерения. Нажмите еще раз и зафиксируйте. Очень быстрый инструмент, который не занимает много места. Разработанная для браз
FREE

Индикатор ColorBars окрашивает бары различными цветами в зависимости от объемов. Если объем увеличился, цвет бара рисуется зеленым цветом, если уменьшился - красным.ввв
FREE

Scalp using the behavior of a short moving average, the indicator gives the slope and identifies the "hyper" moments.
Operational advice:
Use M1 chart. Period 20 : open buy after two rising lows; sell after two max downhill; avoid countertrend openings; when the line goes flat put a stop at the opening price. Avoid actions in low volatility timeslots. When the curve that draws the min / max is very flat, it is better to postpone at least 15'.
Period 50 : matches the trend, when it is
FREE

Вычисляет уровни pivot. В зависимости от расположения цен относительно этих уровней закрашивает гистограмму. Значения параметров: style - выбор типа отображения (Histogram, Line, Arrow) price - цена, мало влияет на конечный вид, но это можно настроить timeframe - выбор таймфрейма для расчета уровней. color over pivot line - цвет всего что выше уровня pivot color under pivot line - цвет всего что ниже уровня pivot pivot line intersection color - цвет, когда тело свечи пересекает центральную ли
FREE
Стратегия торговли: Скальпинг. В основе советника "Project Golden Luna" лежит торговля по сигналам зигзага с использованием стандартных индикаторов, а входы в рынок выполняются на пробое уровней локальных экстремумов. Как только бот получает сигнал, он тут же начинает выставлять несколько отложенных ордеров. И самое главное – этот торговый эксперт в открытых сделках применяет защитные ордера SL, которые сохраняют депозит трейдера от весомых убытков. Впрочем, этот робот в большинстве случаев
Стратегия торговли: Скальпинг. Торговля на импульсах в автоматической торговле используется давно и схема не новая трейдерам. Вручную такие моменты ловить сложно, но советник справляется моментально. В автоматическом трейдинге используется 2 подхода для торговли в таких случаях: искать откаты после импульсов. торговать в направлении импульса. Поиск точек для входа выполняется так: советник измеряет скорость изменения цены за который это изменение должно произойти, если условия на вход в рынок вы

Indicator designed to give investors the advantage of identifying strong candlestick patterns in real time by staining candlesticks representing these patterns, using possible buy or sell performance. The color for each pattern identified by the parameter indicator according to your taste. The candlestick patterns identified by this indicator are: Inside Bar Closing Price Reverse Top (PFRA)
Closing Price Reverse Bottom (PFRB) Dave Landry Bullish Engulf Bearish Engulf Advantages: Real Time At ea

Утилита рисует уровни разворота по формулам для каждой из выбранного количества свечей: Pivot = (high + close + low)/ 3 R1 = ( 2 * Pivot) - low S1 = ( 2 * Pivot) - high R2 = Pivot + (R1 -S1) R3 = high + ( 2 * (Pivot - low)) S2 = Pivot - (R1 - S1) S3 = low - ( 2 *(high - Pivot)) H = high L = low U = если свеча бычья, то close. Иначе - open D = если свеча бычья, то open. Иначе - close
На любом таймфреме. После закрытия новой свечи на расчетном таймфрейме уровни последнего дня удаляются. То есть
FREE
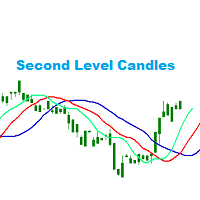
Second Level Candles And Alligator Indicators 每12秒产生一个K线,而且自带Alligator指标,对超短线选手交易非常有帮助。程序启动时可能不成功,是因为MT5 MqlTick 数据加载少的原因。可以通过修改显示的数据参数避免,比如display=100,程序正常之后再将参数调大 display=300 。如果数据不正常,也可以采用重新加载的方式解决。 如果您对这个指标有任何建议,请联系作者。 Second Level Candles And Alligator Indicators produced a candle per 12 seconds,include Alligator, it's helpful to Short-Term Trading。You'd better reload the indicator every start MT5 or change display parameter to reslove data bug. Please attach author when you had some su
FREE

The RSI (Relative Strength Index) scanner is a powerful technical analysis tool designed to help traders and investors identify potential trading opportunities in the forex, stocks, and cryptocurrency markets. RSI is a popular momentum oscillator that measures the speed and change of price movements and helps determine overbought or oversold conditions in an asset. The scanner takes advantage of this indicator to streamline the process of finding trading signals and opportunities. The RSI value
FREE

RCCMA — это общий индикатор скользящих средних, работающий с индикатором ReviewCandleChart. Оригиналом является индикатор Custom Moving Average от компании MetaQuotes Software Corp. На основе этого когда я создал соответствующий индикатор для ReviewCandleChart .
Преимущества Когда индикатор ReviewCandleChart включен, справа от вертикальной линии индикатора никакие линии отображаться не будут. Когда индикатор ReviewCandleChart включен, нажатием клавиши, например Z или X, вы можете нарисовать ск
FREE

516/5000 Average volume indicator to calculate the average volume for a given period. Useful as a filter to measure the strength of a trend, or false breaks in support or resistance.
It does not give a signal to buy or sell, it only acts as a filter to avoid entering into transactions with a drop in volume, or below-average volume, which may indicate disinterest in trading at the price level.
It has only the parameters of period, method of calculating the average and type of volume.
FREE

It is the very same classic Stochastic indicator, but with a little twist: NO NAME and data is shown in the sub window. It could be stupid, BUT, if you are running out of space in Micro windows like Mini Charts, where the indicator's name is totally useless, you came to the right place. And that's it! I know it seems stupid but I needed the classical version of Stochastic indicator without that annoying name on my Mini Chart, so I did it that way... The original formula is right from Metaquote's
FREE

Этот индикатор отображает волновую структуру рынка в виде нескольких волновых уровней, вложенных друг в друга. Для каждого из этих уровней создается автоматическая предварительная (черновая) разметка волн в стиле Эллиотта (123..., ABC ... и т.д.). Эта разметка является полностью автоматической и абсолютно однозначной. Индикатор особенно полезен для начинающих волновых аналитиков, поскольку среди всех возможных вариантов волновой разметки позволяет сразу взять за основу наиболее адекв

EA to help traders stay within tight risk management.
Asks only for account's initial balance and Stop Out DD. This is meant for prop firm traders, but will help any trader who is looking for a simple risk manager.
Trasks and reports daily PnL and will advise you to stop at 1% daily loss. Will advise you to wait if you have too many open trades.
Based on the open chart (symbol and timeframe) will recommend size and SL distance in order to risk the desired cash risk. See screenshot for exa
FREE

This is a bufferless indicator which can display classical X and O columns if applied on custom symbol charts built by Point-And-Figure-like generator PointFigureKagiCharts or its DEMO . The indicator will enforce a fixed price-scale on the chart to make sure the marks keep correct aspect ratio. The marks are shown only if the chart time-scale is large enough to hold them in the space allocated per bar (if the horizontal scale is one of 3 smallest ones, the indicator draws nothing and outputs a
FREE
Copyist MS - быстрый и понятный в использовании копировщик сделок, работает как советник в виде одного файла с переключением режимов работы Master и Slave. . Текущая версия советника работает только на Netting accounts.
Настройки Type of work - выбор режима работы: Master или Slave; Master account number - номер торгового счета master-терминала; Selective copying currency pairs - индивидуальный выбор валютных пар для копирования; Max orders on one currency pair - максимальное количест
FREE

Orders Manager – это простой и незаменимый помощник для управления всеми вашими ордерами. Входные данные : Magic = 999; // Магик TakeProfit = 1000; // Тейк - профит . Если = 0, уровень не устанавливается. StopLoss = 0; // Стоп-лосс. Если = 0, уровень не устанавливается. Slippage = 10; // Проскальзывание GeneralProfit = false; // Закрытие всех ордеров по общей прибыли. Если fals
FREE

This creative simple indicator will provide a precise framework for market sentiment within technical analysis of different timeframes. For instance, for traders like me that uses "Mark Fisher" strategy regularly, this is a perfect indicator for having an insight to markets from short term to long term point of view, using Break points of candles' lows and highs and perfect to combine with "Price Action" . For more options and modifications you can also edit the low timeframe candles withi
FREE

Indicador Regressão Linear – Par de Ativos Indicador é um oscilador que faz o plot do Resíduo resultado da regressão linear entre os dois ativos inseridos como input do indicador, representado pela fórmula: Y = aX + b + R Onde Y é o valor do ativo dependente, X é o valor do ativo independente, a é a inclinação da reta entre os dois ativos, b é a intersecção da reta e R é o resíduo. O resíduo representa a quantidade da variabilidade que Y que o modelo ajustado não consegue explicar. E os resíduos
FREE

The GTradeView tool is indicator designed to visualize the position and its information, such as Reward to risk ratio, Risk percent, Profit, Target and stop-loss and recalculate the reward to risk ratio and risk% in real time on the chart. This tool useful in your trading journal. you can take screenshot of your position, entry, target and stop-loss so you have a visual representation of the trade then you can save it in the journal. And you can visualize EA's trade with associated risks and rew

A big thank you for your interest in our product. MustForex Smooth V6 Newly developed Premium Expert advisor
Its follows a determined Swing strategy. It trades by following and analysing indicators like Bollinger Bands/MACD/Momentum/CCI/RSI to determine entry and exit point. Profits can be locked by the adjustable trailing stop/Break Even inputs. Every trade protected with stop loss and take profit to protect your account. Since the strategy works with quick swing trade profits it is high
FREE

For traders, monitoring price movements is a constant activity, because each price movement determines the action that must be taken next.
This simple indicator will helps traders to display prices more clearly in a larger size.
Users can set the font size and choose the color that will be displayed on the chart. There are three color options that can be selected to be displayed on the chart.
FREE

Данный индикатор показывает объем каждого бара (видимый диапазон) в пунктах. Гибкие настройки отображения значений. Возможна настройка параметров показа. Индикатор создавался для личного пользования, анализа графиков. Параметры: Color - цвет текстовых меток; Position - позиция метки: 0 - снизу, 1 - сверху; FontSize - размер шрифта; Angle - угол наклона текста; GapPoints - отступ по вертикальной оси.
FREE

https://www.youtube.com/watch?v=0T8Mge39Xsk&t=9s
Youtube
These EAs trade macd divergence only if there is a parabolic sar change at the same time. Sell bearish macd divergence & parabolic sar crosses above price Macd settings Threshhold is how far above / below zero divergence must occur. Timeframe used Parabolic sar settings
Only one trade in that direction can be opened at once. Trades on open bar Alerts , mt5 and mobile Stop loss and target points Stop loss is set to a % percentage of
FREE
This indicator allows to hide OBV (on all MT5 timeframes) from a date define by the user with a vertical line (Alone) or a panel (with "Hidden Candles"). Indicator Inputs: Apply To Information on "On Balance Volume" indicator is available here: https://www.metatrader4.com/en/trading-platform/help/analytics/tech_indicators/on_balance_volume ************************************************************* Hey traders!! Give me your feeds! We are a community here and we have the same objective....
FREE
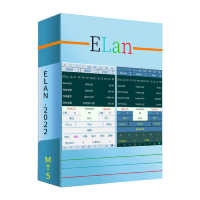
ELan is a very powerful auxiliary system that can greatly improve your trading efficiency. It has six unusual systems. 1. Market price Trading system: This trading system enables you to execute market price orders easily, thus achieving very fast order execution. 2. Post management system: Post management system allows you to understand the profit changes of your post in the first time and manage the operation of orders. 3. Order management system: Order management system allows you to trac
FREE

This is the Full Version, to get the free version please contact me.
The free version works on “AUDNZD” and “XAUUSD” charts.
All symbols and time frames scanner
Head and Shoulder
One of the most popular Price Action patterns is the Head and Shoulders pattern. The pattern has three local tops that resemble the left shoulder, head, and right shoulder. The head and shoulders chart pattern appears in all kinds of markets, including Forex, cryptocurrency, commodities, stocks, and bonds. The

Have you ever wanted to back-test a strategy but never wanted to risk real money? And the thought of using a demo account is exhausting as real time markets develop your skills slowly. This utility will help you develop your strategy faster and will help determine if the strategy works long-term by simulating real trading through back-tests. This will save you time as you can back-test strategies from previous price data. With the new update you can now change your lot-size add take-profit and
FREE

Trading panel for manual trading. Has a fairly wide functionality. Allows you to automatically calculate the order size, open both market and pending orders. It has a wide range of options for closing orders, it is possible to partially close orders, close orders after reaching a certain profit or loss, separately close profitable and unprofitable, buy and sell, as well as pending orders. The panel also contains a simple implementation of a grid of pending orders, reverse and lock functions, tr
FREE

This is the Full Version, to get the free version please contact me. The free version works on “GBPCHF” charts. All symbols and time frames scanner. Harmonic Pattern
Harmonic patterns are used in technical analysis that traders use to find trend reversals. They are considered one of the most accurate technical analysis tools, as they allow traders to predict the future price movement direction and the potential trend targets. Also, unlike many other technical tools, the number of false signal

Узнайте, как API OpenAI могут революционизировать торговлю на MQL5, избегая распространенных мошенничеств и максимально используя возможности искусственного интеллекта. Следующий Эксперт-советник является примером того, как могут быть интегрированы API OpenAI через мою библиотеку. Вы можете прочитать мою статью в моем блоге .
Вы можете приобрести библиотеку, которая позволит вам использовать API OpenAI так же, как вы использовали бы любой другой язык, например Python, вы можете купить ее по с
FREE

Indicador MAPS Indicador é um oscilador que faz o plot da Curva de Retorno de uma regressão de segundo grau para os preços de fechamento do ativo do gráfico. A Curva de Retorno é a linha central do indicador MAPS e representa a região de equilíbrio do preço entre vendedores e compradores. Os plots do indicador são: Linha central - C0 - cor da mesma varia de acordo com a tendência do mercado, sendo verde para tendência de alta e vermelho para baixa; Linhas superiores: S1, S2, S3 e S4, sendo que a
FREE
А знаете ли вы, почему MetaTrader Market - лучшее место для продажи торговых стратегий и технических индикаторов? Разработчику у нас не нужно тратить время и силы на рекламу, защиту программ и расчеты с покупателями. Всё это уже сделано.
Вы упускаете торговые возможности:
- Бесплатные приложения для трейдинга
- 8 000+ сигналов для копирования
- Экономические новости для анализа финансовых рынков
Регистрация
Вход
Если у вас нет учетной записи, зарегистрируйтесь
Для авторизации и пользования сайтом MQL5.com необходимо разрешить использование файлов Сookie.
Пожалуйста, включите в вашем браузере данную настройку, иначе вы не сможете авторизоваться.