Смотри обучающее видео по маркету на YouTube
Как купить торгового робота или индикатор
Запусти робота на
виртуальном хостинге
виртуальном хостинге
Протестируй индикатор/робота перед покупкой
Хочешь зарабатывать в Маркете?
Как подать продукт, чтобы его покупали
Торговые роботы и индикаторы для MetaTrader 5 - 42

Baby WPR opera automáticamente en base al algoritmo oscilador WPR. Es capaz de llegar a generar resultados alcistas en las pruebas realizadas con el par de FX GBPUSD en el marco temporal H1 Se puede testear en otros instrumentos ajustando sus diversas opciones. Diseñado para operar con un capital mínimo de 100 USD y un apalancamiento de 1:30 Ideal para los iniciados. Con Baby WPR no esperes grandes beneficios con la configuración conservadora por defecto, por el contrario habrán DD significativo
FREE

Индикатор строит кривую разности значений двух торговых инструментов (валютных пар). Назначение индикатора - наблюдение процессов расхождения и схождения значений двух торговых инструментов. Полученные результаты могут использоваться для торговли по стратегиям статистического арбитража, парного трейдинга, корреляции, и другим.
Стратегия торговли
Индикатор прикрепляется к графику любого торгового инструмента. Во входных параметрах задаются названия торговых инструментов, разность значений кото
FREE

The Candle High Low Exit indicator uses the highest high and the lowest low of a range to draw trailing stop lines (orange under buys, magenta over sells) that advance with the trend until the trend changes direction. Moreover, the trailing stop lines are generated to support the order’s trend direction (long or short): In an upward trend, the long trailing stop line (orange line under buy) appears and advances upward until the close crosses under the line.
In a downward trend, the short tra
FREE

Индикатор рассчитывает коэффициент корреляции 2-х инструментов, сдвиг графика 2-го инструмента относительно 1-го и отображение графиков обоих инструментов на текущем графике. Рассчитываются максимальные положительная и отрицательная дельты и текущая дельта в процентах от максимальных. Есть возможность для сигналов задать дельту для входа и выхода с отображением направления входа в торговлю по каждому инструменту. Так же происходит закраска пространства между графиками разными цветами в зависимос
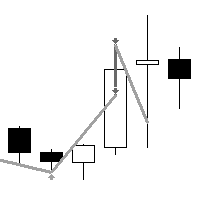
"AV BuyLow SellHigh EA" is an Expert Advisor for MetaTrader 5, which was created from the simple "AV Preview".
The original idea was to buy lower and sell higher from the last entry price. On request, I have developed it further and tried to remove its trend weakness. This EA is only the Minlot version to try out.
Strategy:
The size of a displayed rectangle is used to decide whether range trading is to be carried out (sell above, buy below) or trend trading (buy on rising, continue se
FREE
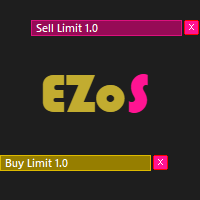
Easy Order Send help you to put your order on the chart using shortcuts keys like (SHIFT or CTRL). To send a order, hold CTRL or SHIFT and press left click mouse. It's a Beta version with features below: 1 - Send Buy and Sell order with SHIFT AND CTRL
2 - Cancel Button to your order
3 - Cancel Button to your position
4 - Move your order
5 - Monitor your Profit after trade on.
FREE
Ice Box Breaker robot identifies the high and low regions and enters trades to the direction of the market whenever one of these exhibits a breakout.
The robot allows the trader to specify multiple parameters such as the start and end time for forming a high -low trading zone, trading hours and exit times for active trades.
Several other options to filter the entries based on volatility , as well as control for how many active and trades can open in a day.
The optimisation parameters a

Эксперт - торговый помощник, созданный по одноимённой торговой стратегии Оракул в сотрудничестве с ее автором Нео. Определяет на графиках в автоматическом режиме разворотные импульсные модели и строит по ним Вилки Нео - авторский инструмент, позволяющий определять циклы движения цены и указывающий на ожидаемую цель TakeProfit . Поиск ведется на всех заданных периодах графиков одновременно с фильтрацией совпадений. Осуществляется фильтрация неверных Вилок с указанием кода ошибки. Утилита имеет
This is a dual function EA. It offers both trailing stop and break even(BE) or breakeven-plus(BE+) functions. This EA sets BE/BE+ and Trailing stops for both manually and auto-opened trades. To use only the BE/BE+ function of the EA, type in the number 3, under BlockID in inputs, when initializing the EA. To use only trailing stop, type in 2. Trailing stop is a more flexible variation of a normal exit order. T railing stop is the practice of moving the stop-loss level closer to the curre

HEIKEN PLUS is the only indicator you really need to be a successful trader , without in depth knowledge of the forex trading or any tools.
Also there is automatically trading EA available now: https://www.mql5.com/en/market/product/89517? with superb SL/TP management! and sky high profit targets !!!
Very suitable tool for new traders or advanced traders too. This is MT5 version. For MT4 version visit : https://www.mql5.com/en/market/product/85235?source=Site
HEIKEN+ is a combination o

Contact me for instruction, any questions! Introduction The Elliott Wave in technical analysis describes price movements in the financial market that are related to changes in trader sentiment and psychology. The 5 W Pattern (Known as 3 Drives) is an Elliott Wave pattern that is formed by 5 consecutive symmetrical moves up or down. In its bullish form, the market is making 5 drives to a bottom before an uptrend forms. In a bearish 5-drive, it is peaking before the bears take over. 5W Pattern S

If you like this project, leave a 5 star review. Often times we are using brokers that are outside of the GMT-0 timezone, this
not only complicates things, but, it can make seeing when a trading session starts
a bit more difficult than it should. This indicator allows you to set a timezone offset it will draw a vertical line for the: Day. Week. Month. Quarter. year.
FREE

Santa Bollinger Indicator is an efficient way to detect price retracement in any market. A common approach is to identify overbought or oversold market conditions. When the price of the asset breaks below the lower band of the Bollinger Bands, prices have perhaps fallen too much and are due to bounce. On the other hand, when price breaks above the upper band, the market is perhaps overbought and due for a pullback . Advantages Generates instant buy and sell signals. Never repaints, never back
FREE

This indicator calculates trend via two different moving averages and draw zigzag trend lines. You can change fast and slow Moving Averages settings for customization. Inputs:
Fast MA Time Period : 64 Fast MA Shift: 0 Fast MA Method: Smoothed Fast MA Apply To: Median Price Slow MA Time Period: 32 Slow MA Shift: 0 Slow MA Method: Smoothed Slow MA Apply To: Median Price ZigZag Color: Red ZigZag Type: DashDot ZigZag Width: VeryThin
FREE
Работа утилиты направлена на открытие новых рыночных ордеров, их сопровождение, вывод убыточных ордеров в прибыль с помощью внутреннего алгоритма обработки убытков, фильтрации тренда и разных видов трейлинг-стопа и тейк-профита. Подходит для любых инструментов и таймфреймов. Алгоритм работает отдельно для покупок и продаж, что позволяет работать в том числе и в две стороны одновременно. В случае, если дополнительно открытые утилитой ордера не уводят в прибыль, предусмотрен StopOut (закрытие всех
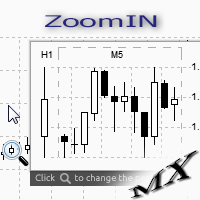
Индикатор ZoomIN MT5 предназначен для быстрого просмотра выбранного бара на младших таймфреймах во всплывающем окне. После запуска индикатор работает в фоновом режиме, не занимает места на графике и не потребляет ресурсы системы. При активации индикатора комбинацией Shift + i (есть возможность изменить в настройках), создается всплывающее окно с графиком младшего таймфрейма. Отображаемый таймфрейм можно изменить щелчком левой кнопки мыши по значку лупы. Чтобы скрыть всплывающее окно, достаточно
FREE
Use this expert advisor whose strategy is essentially based on the Relative Strength Index (RSI) indicator as well as a personal touch.
Other free expert advisors are available in my personal space as well as signals, do not hesitate to visit and leave a comment, it will make me happy and will make me want to offer content. Expert advisors currently available: LVL Creator LVL Creator Pro LVL Bollinger Bands
Trading is not a magic solution, so before using this expert on a live account, carr
FREE

This Expert Advisor is designed for news trading. This version is the free version for MT5. The amount of news to handle is limited to 5 news in USDPY (0.01 Lot). Please find below the other versions of this expert (The Pro versions have not limitations) : News Advisor MT5 Pro. News Advisor MT4 Pro. News Advisor MT4 Free. The main advantage of this expert is that it’s offering backtesting capabilities (something that is not found in most news expert advisors). This ability gives you the opportun
FREE

ATR is a measure of volatility introduced by market technician J. Welles Wilder Jr. in his book, "New Concepts in Technical Trading Systems". In general, traders are accustomed to seeing the ATR in the form of a sub-window indicator. What I am presenting here is a simplified version of ATR - just the current ATR number - very useful for monitoring just the very moment of the current chart. If you want to monitor several timeframes in the same chart, just add the ATR Monitor indicator several tim
FREE

Утилита MTI (Main Trading Info) – показывает основную торговую информацию для трейдера, а именно: средний и текущий размер Cпреда размер Swapа для коротких и длинных позиций Стоимость 1 пункта для 1 торгового лота размер Stop Level (минимальное расстояние для выставления отложенных ордеров) Время до окончания текущей (красный цвет) и время до начала следующей (серый цвет) торговой сессии Красным выводиться время до окончания текущей торговой сессии, серым время до открытия следующей сессии. Цве
FREE

Индикатор сканирует до 15 торговых инструментов и до 21 таймфрейма на наличие высоковероятностных моделей паттерна Двойная вершина/дно с ложными прорывами . Что определяет этот индикатор: Этот индикатор находит особую форму таких паттернов, так называемые двойных вершин и нижних частей, так называемый Двойная вершина/дно с ложными прорывами . Паттерн "Двойная вершина с ложными прорывами" формируется, когда максимальная цена правого плеча выше левого плеча. Паттерн "Двойное дно с ложными прорывам
FREE

We at Minions Labs consider ATR ( Average True Range ) one of the most fantastic and most underrated indicators of Technical Analysis. Most of the traders really don't give a sh* about the True Range of the market and this probably can be because they could not apply the data right away in a practical way over their charts or over their own strategy, leaving this indicator in the land of obscurity and doubt. Well, this indicator, Bigger Than ATR , is a step forward to show you what is possible t

The Relative Strenght Index presented to the world in 1978 by J. Welles Wilder Jr. in his book " New Concepts in Technical Trading Systems " is widely used around the world in several ways, not only with the traditional approach of Overbought and Oversold states, which in several cases and depending on the assets and timeframes it just simply doesn't work anymore . BUT, this indicator has its value when used, for instance, looking for divergences between its measuring system and the Prices appea

Скользящая средняя Т3 Тиллсона была представлена миру технического анализа в статье «Лучшая скользящая средняя», опубликованной в американском журнале Technical Analysis of Stock Commodities. Разработанный Тимом Тиллсоном, аналитики и трейдеры фьючерсных рынков вскоре увлеклись этой техникой, которая сглаживает ценовой ряд, уменьшая при этом лаг (лаг), типичный для систем следования за трендом.
FREE
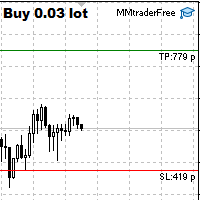
Данный инструмент предназначен для быстрого расчета лота в зависимости от Stop Loss. Управление происходит за счет горячих клавиш По умолчанию: 1 - Уровень цены лимитного ордера 2 - Уровень Stop Loss 3 - Уровень Take Profit Пробел - Открыть ордер Escape - Отменить все 9 - Отрыть 2 ордера
Маркет ордер
Для открытия Маркет ордера нажимаем (2) и мышкой настраиваем Stop Loss Если хотите поставить Take Profit - нажимаем (3) и мышкой настраиваем Take Profit
FREE

Combining the best of Price Action , Directional Movement , and Divergence / Convergence analysis, the Candle Color Trend is the easy and reliable way to identify the direction of the trend. The indicator automatically paints the candles according to the premise that the upward trend is defined by prices that form a series of ascending tops and bottoms. On the other hand, the downward trend is defined by prices that form a series of descending tops and bottoms.
Color Trend is certainly one
FREE

Основное: Не мартингейл, не сеточник; Работает на всех парах;
Сигналы: В основе хороший рациональный алгоритм. Работа по взаимодействию двух индикаторов: Stochastic и OsMA (можно задавать отдельный Timeframe для каждого индикатора)
Stop Loss/Take Profit: Присутствует хорошая система money management (есть несколько вариантов trailing stop loss); Присутствуют виртуальные уровни Stop Loss/Take Profit Возможность работать фиксированным лотом, либо "умным" лотом (процент риска от капитала)
FREE

A combination of trend, pullback, range breakouts and statistics in one indicator Mainly functions as an Entry indicator. Works in any pair and timeframe.
Suggested Combination Cluster Helix with Strength Meter Strategy: Confirm signals with ideal strength levels Watch Video: (Click Here)
Features Detects range breakouts on pullback zones in the direction of the trend Analyzes statistics of maximum profits and calculates possible targets for the next signal Flexible tool, can be used in many

"Volality 75 Boom Crash VIX" - инструмент расширенного анализа, предназначенный для выявления ключевых зон прорыва в парах волатильных активов и бум-катастроф. VIX - это инструмент расширенного анализа, предназначенный для выявления ключевых зон прорыва в волатильных парах активов и бум-катастроф. Индикатор ориентирован на выявление моментов высокой волатильности на рынке.
Данный индикатор идеально подходит как для скальпинга, так и для свинговой торговли.
"Volality 75 Boom Crash VIX" - это
Introducing the ICT Silver Bullet - Your Go-To Expert Advisor for Precision Trading! Unlock the power of strategic trading with the ICT Silver Bullet, specifically designed for the modern retail and algorithmic trader. Our Expert Advisor boasts additional trend filters, partial close features, break-even, and advanced trailing stop-loss functions to maximize your gains and secure your investments. You can explore our full suite of EAs here: https://www.mql5.com/en/users/s_moksa/seller Streamlin

Meta Trend Indicator is an efficient way to forecast and detect the trend in any market. It reveals the trend, support and resistance levels, volatility and the maximum potential target, all in one indicator. To adapt to the price and to decrease consecutive trend failures, the internal trend detector algorithm studies the market and dynamically chooses the right values for the internal parameters. This indicator is a perfect trend filter for any strategy or expert advisor. Features Super Adapti

Добро пожаловать в мир трейдинга с Trend Candle Pumper – вашим надежным напарником на финансовых рынках! Trend Candle Pumper – это умный трейдинговый бот, разработанный для тех, кто хочет погрузиться в мир инвестиций, не обладая глубокими знаниями о трейдинге. Как это работает: Trend Candle Pumper использует передовые алгоритмы искусственного интеллекта для анализа трендов на финансовых рынках. Но что такое тренд? Простыми словами, тренд – это общее направление движения цены актива. Наш бот след

A countdown timer for the Volume bar chart generator and Tick chart generator products, which are available for download from the MQL5 Market: Tick chart generator: https://www.mql5.com/en/market/product/29215 Volume bar chart generator: https://www.mql5.com/en/market/product/47197
The counter conveniently displays the number of ticks or transactions (depending on the chart) that need to pass for a new bar to start printing.
The user can set the following indicator inputs.
Volume type
FREE

Media Móvel Grátis para uso em conjunto ao Diamond Indicator Atenção. Essa é a mm para conjugar ao indicador. Esse não é o indicador. Comprem o indicador que está tendo ótimos resultados. A seguir informações sobre o indicador: Indicador Para Opções Binarias. Usa dois gales. Instalar em mt5 Esse indicador é para ser usado no tempo de vela de 5 minutos e em M5. Este também funciona em M1, porém é mais eficiente em M5. Só descompactar e copiar os arquivos na pasta de dados do seu MT5. Arquivos
FREE
Эксперт " Delta Volume histogram " строит «Delta volume», «Real volume», «Buy volume», «Sell volume», «Tick volume» гистограммы.
Версия эксперта: Имеет встроенный «Pending orders indicator». Индикатор предназначен для анализа отложенных ордеров рынка, доступных в "MarketBook". Отображает уровни объемного профиля рынка (VAH VAL от 60% до 85%). Встроена боковая гистограмма. Это мощный инструмент анализа объемов торговли. График строится на основе тиковой информации.
В зависимости от брокера выби

The Market Thermometer can be used to help traders identify sleepy or turbulent periods.
It helps beginners to check when is the ideal time to enter operations, that is, when the value of the thermometer is below its average for several periods, identifying a peaceful market. When the market is heated, that is, the thermometer is above three times its average, it is time to make profits. The Thermometer measures the extent to which the end of a period, maximum or minimum price, projects outsi
FREE

简介 本产品迈达量化全系列一款集很多功能为一体的交易面板。 支持便捷性交易,风控系统,跟单系统及图形绘制。 它会是你交易路上的得力助手。 功能介绍
第一个标签是常用的交易工具,支持划线下单,鼠标下单等快捷开仓和挂单工具。 第一个标签是关闭仓位和删除挂单功能,支持按比例,魔术编号,产品符号操作。 第三个标签是工具集合栏目,支持各种常用的交易工具。 订单管理,可实现订单批量选择操作,更直观简介。 风控系统,支持净值风控,手数,单数控制,支持手机挂单风控。 键盘交易,可以实现键盘按键成交和关闭仓位,同时可实现组合操作。 图表管理,可绘制交易时段,也可分类删除图表绘制的各种构件,也可绘制交易时段。 信息统计,统计账户信息,产品信息及终端信息。 跟单系统,支持开仓,挂单,删除挂单,部分平仓,可选择定制信号,如魔术编号等。 特色的优点 各种支持交易的工具组合一体,不用来回切换多个软件。 软件设计漂亮美观,高亮显示,运行流畅,模块紧凑,用户体验好。 各种工具互相搭配使用可实现复杂的交易操作。 关于我们 欲了解更多我们产品信息,请[点击这里]( https://www.mql5.com/e

Удобный трендовый индикатор. Не меняет своих значений. Имеет огромные возможности для настройки. Не требователен к ресурсам компьютера. Создавался для работы в системе BearsHunter. Эксперт МТ5 с использованием данного индикатора: https://www.mql5.com/ru/market/product/30381 Эксперт МТ4 с использованием данного индикатора: https://www.mql5.com/ru/market/product/30383
Параметры:
m1_MA_Mode_1 - метод усреднения(0-9). m1_MA_Mode_2 - метод усреднения(0-9). m1_MA_Mode_3 - метод усреднения(0-9). m1
FREE

This is a general purpose indicator that displays colored lines at fixed and customizable price intervals, entered as parameters. It offers universal, constant, and familiar price ranges that allow quick and precise price analysis of a currency pair. With default parameters, this indicator implements The Quarters Theory , as described originally by Ilian Yotov . [ Installation Guide | Update Guide | Troubleshooting | FAQ | All Products ] Easy to use No optimization needed Customizable price inte
FREE

[ MT4 Version ] Advanced Bollinger Bands RSI EA MT5 Advanced Bollinger Bands RSI EA is an Expert Advisor based on the worldwide known strategy BB & RSI. This strategy uses the Bollinger Bands indicator in combination with the RSI, the signal triggers only when both the BB and the RSI indicate at the same time overbought or oversold conditions. Both indicators make a great combination to anticipate big explosive moves. Advanced Bollinger Bands RSI EA grants the user the posibity to use 3 differen

Данный индикатор отображает график крестики-нолики (графики PnF) в окне индикатора. Такие графики показывают только те изменения цены, что больше указанной величины порога (размера клетки). Это позволяет скрыть шум и сконцентрироваться на основных трендах. Время здесь не берется в расчет. Учитывается только движение цены. Вот почему график крестики-нолики не синхронизируются с основным графиком, к которому он прикреплен. Более подробную информацию о графиках крестики-нолики можно узнать в Википе
FREE

El indicador técnico propuesto es un sistema de medias móviles de múltiples marcos temporales diseñado para ayudar a los operadores del mercado financiero a seguir de cerca los movimientos tendenciales. Al combinar medias móviles de diferentes períodos, este indicador ofrece una visión más completa de la dirección de la tendencia, lo que permite a los traders identificar oportunidades de trading con mayor precisión. Al utilizar este indicador, los operadores pueden maximizar sus ganancias al tom
FREE

Simply Sensitive Stochastic Scalper Ключом к успеху всегда является хорошая оптимизация.
Система имеет ряд переменных, и в этом случае ее простота является ключом к успеху. Система ищет различные "гэпы", как сбои при входе в рынок, а затем отлаживает их с помощью стохастического анализа, т.е. анализа двух скользящих средних на предмет того, завышена или занижена цена, и после этого советник решает, совершить ли действие или воздержаться от его выполнения. Это очень простая, но мощная система
FREE

Индикатор Point-Percent Price Channel (PPPC или PP Price Channel) предназначен для отображения на графике канала, ширина которого задаётся как в процентах от текущей цены так и в пунктах. Его внешний вид представлен на слайде 1. При движении рынка вверх верхняя граница канала строится по ценам High свечей. При этом нижняя граница движется вслед за верхней на строго указанном расстоянии. При касании ценой нижней границы канала индикатор переключается на построение тепер
FREE

Стратегия торговли: Скальпинг по скорости цен. В основе советника лежит сложная торговая система основанная на высоких колебаний цен. Суть стратегии сводится к тому, что эксперт определяем высокие колебания цен на графике с использование сложных математических вычислениях и затем если есть хороших моментов для входа в рынок, советник открывает отложенные ордера.
Советник использует отложенные ордера BuyStop и SellStop . Торговля ведется на таймфрейме Н1. Советник не использует стратеги

Volume Projection Indicator The Volume Projection Indicator is a specialized tool designed for traders who focus on the relationship between volume and price action. This intuitive indicator projects the expected volume for the ongoing candle, aiding in decision-making during live market conditions. The indicator presents volume data in a histogram format directly on the chart for quick analysis. Features: Bullish Volume Representation : Each green bar in the histogram signifies the volume for a
FREE

Esse Indicador é uma boa opção para quem gosta de operar a longo prazo e com paciência. Ele trabalho com os níveis de fibo na media de 200 são 9 níveis onde você pode operar nas reversões o mercado partir do níveis abaixo. Level 1 = 550 pontos Level 2 = 890 pontos Level 3 = 1440 pontos Level 4 = 2330 pontos Level 5 = 3770 pontos Level 7 = 9870 pontos Level 8 = 15970 pontos Level 9 = 25840 pontos Level 6 = 6100 pontos
FREE

A "simple design" trading panel, which is characterized by small byte size, low CPU usage, simple steps, and quick operation, 1 to 2 clicks to complete a functional operation,
saving time and increasing efficiency . The panel is easy to use, and it is not complicated to set parameters, which is in line with traders' habits. At the same time, its compact-
design, clear at a glance, and comprehensive functions are a powerful tool for manual trading! Key features of the panel: Click "Bid/Ask
FREE

Displays a USD DXY chart in a seperate window below the main chart. YOUR BROKER MUST HAVE THESE SYMBOLS FOR THE INDICATOR TO WORK Based on EUR/USD, USD/JPY, GBP/USD, USD/CAD, USD/CHF and USD/SEK All these pairs must be added to Market Watch for the indicator to work correctly As this is calculated using a formula based on the 6 pairs it will only work when the market is open.
YOUR BROKER MUST HAVE THESE SYMBOLS FOR THE INDICATOR TO WORK
Displays a USD DXY chart in a seperate window below the
FREE

This indicator will draw two lines to represent the adjustment value, which can be used in both the Dollar and the Index.
The main advantage of this indicator is that it has two lines, one representing the adjustment calculated from the previous day and the other representing the adjustment calculated on the current day. The calculation of the adjustment on the current day is a great differential, since it will be possible to make operations in order to sleep bought or sold according to the a
FREE

Профессиональный инструмент для торговли - индикатор дивергенции между MACD и ценой, позволяющий своевременно получать сигнал о развороте тренда или ловить движения откатов цены (в зависимости от настроек). Настройки индикатора позволяют регулировать силу дивергенции за счет угла наклона пиков MACD и процентного изменения цены, что даёт возможность тонко настроить силу сигнала. Код индикатора оптимизирован и в составе советника очень быстро тестируется. Индикатор не перерисовывает, стрелки для
FREE

ATR Moving Average draws a moving average of the standard Average True Range( ATR ) in the same window.
Settings Name Description ATR period
Set Price per iod for ATR calculation
ATR level Set ATR value for thresholding( only whole number, ignore leading zeros e.g. 0.00089 = 89 ) MA Period Set moving Average Period MA Method Set moving average method( Simple, Exponential, Smoothed and Linear Weighted ) MA Shift
Set moving average shift
Enable Alerts ? Generate Alert when ATR crosses
FREE

This indicator shows when user set sessions are active and returns various tools + metrics using the closing price within active sessions as an input. Users have the option to change up to 4 session times.
The indicator will increasingly lack accuracy when the chart timeframe is higher than 1 hour.
Settings
Sessions
Enable Session: Allows to enable or disable all associated elements with a specific user set session.
Session Time: Opening and closing times of the user set session
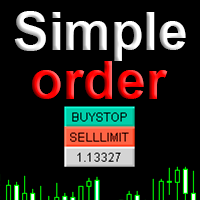
Simple order предназначен для максимального упрощения и ускорения установки отложенных ордеров. Ставим индикатор перетаскивая его на нужный график. Делаем необходимые настройки и все готово.
Установка отложенного ордера происходит всего в два действия. 1. Дважды кликаем мышкой по цене установки ордера в нужном месте графика, после этого появляется панель с кнопками наименований ордеров. 2. Кликаем по кнопке необходимого ордера Все, отложенный ордер установлен. При необходимости корректируем орд
FREE

Спред в трейдинге - это разница между ценой покупки и ценой продажи финансового инструмента на рынке. Спред является комиссионной платой, которую трейдеры платят брокерам за возможность торговли. Не секрет, что каждый брокер предлагает свои условия для торговли. Важным является размер спреда. Очень много советников (особенно скальперов), которые показываю разные результаты у разных брокеров. Мы неоднократно с этим сталкивались. Поэтому воспользовавшись этой утилитой узнайте какой спред в течении
FREE

Классический индикатор фракталов является запаздывающим, т.к. для подтверждения образования фрактала необходимо ждать 2 бара. Если этого избежать, то индикатор будет перерисовывающим, т.е. при обновлении максимума/минимума в течении 2-х баров фрактал будет менять своё положение на более позднее. В данном продукте максимально нивелированы оба этих недостатка, при этом совмещены достоинства обоих подходов! Индикатор показывает фрактал сразу в момент его образования, а в случае его обновления показ
FREE

Candle size oscillator is an easy to use tool to figure out candle size from highest to lowest price of each candle. It's a powerful tool for price action analysts specifically for those who works intraday charts and also a perfect tool for short term swing traders. Kindly note that you can also edit the Bullish and Bearish candles with different colors.
#Tags: Candle size, oscillator, price action, price range, high to low, candle ticks _________________________________________________________
FREE

We have all seen a currency pair enter the overbought or oversold territory and stay there for long periods of time. What this indicator does is gives you the emphasis. So if you are looking for reversals then you may want to take notice when oversold territory is entered into with a bullish engulfing candle or if the trend is your thing then check for bearish engulfing candles while entering oversold. This indicator will show a downward arrow when it detects a bearish engulfing candle while cro
FREE

This indicator calculates the difference between the SELL aggression and the BUY aggression that occurred in each Candle, plotting the balance of each one graphically. Note: This indicator DOES NOT WORK for Brokers and/or Markets WITHOUT the type of aggression (BUY or SELL).
Be sure to try our Professional version with configurable features and alerts: Delta Agression Volume PRO
Settings
Aggression by volume (Real Volume) or by number of trades (Tick Volume) Start of the Aggression De
FREE

This indicator sums up the difference between the sells aggression and the buys aggression that occurred in each Candle, graphically plotting the waves of accumulation of the aggression volumes. Through these waves an exponential average is calculated that indicates the direction of the business flow.
Note: This indicator DOES NOT WORK for Brokers and/or Markets WITHOUT the type of aggression (BUY or SELL). Be sure to try our Professional version with configurable features and alerts: Agr
FREE

Предпочтительная пара для торговли USDCAD
Условия для покупок торговой системы «Ozy_M15»:
1) Цена находится выше скользящей средней SMA 48.
2) Начинается коррекция цены вниз, но скользящая средняя внутри этой коррекции не должна быть пересечена телом свечи.
3) При этом сама коррекция должна углубиться как минимум до нижней линии индикатора Ozymandias.
4) После этого, как только цена закрытия очередной свечи окажется выше верхней линии индикатора Ozymandias (не более 10 пунктов) заключает
FREE

The ShowSessions indicator for MT5 shows up to two, self-selected, time intervals, for a free choosen number of days past and a few future days. Weekends are marked with an additional red vertical line. The indicator makes manuel backtesting of strategies more easily, but you can use ist for daily trading as well. Please note that the server time does not always correspond to the actual time.
FREE

At first, I got my teeth into Dragon Ultra Expert Advisor. This Lesson is “Awesome”. In fact, It’s probably one of my best trading lessons I have ever written.
It took me at least 2 days of brain power and probably 20 coffees. Please pay it forward, share it with others. Enjoy.
Bruce Lee was arguably the best martial artist of all time, and guess what? He was not born the best martial artist of all time.
He earned that title through dedication and focus…he learned to become a MASTER of
FREE

Unlock the Power of Scalping with this Essential Indicator for Any Currency Pair! Experience Crystal-Clear Buy/Sell Signals and Activate Instant Alerts for Maximum Precision.
Introducing the Ultimate Scalping Companion: Your Key to Precision Profits! Transform Your Trading Strategy with an Indicator that Stands the Test of Time! In the ever-evolving world of trading, consistent success hinges on smart risk management . While no tool can be the holy grail, our non-repainting indicator
FREE

Советник основанный на сигналах индикатора Relative Strength Index (RSI) и Stochastic в зоне перекупленности - продаем, в перепроданности - покупаем. Я рекомендую использовать этот советник только на VPS. Добавляйтесь в друзья, присылайте свои интересные стратегии. Возможно после обсуждения всех нюансов напишу советника бесплатно . Параметры: "_Slippage" - Проскальзывание; "_ Magic" - Идентификатор ордера;
FREE

ТОРГОВЫЙ БАЛАНС – ПАРОЛЬ ИНВЕСТОРА – КОПИРОВАТЬ ТОРГОВЛЮ – КРОСС-ПЛАТФОРМА MT4 x MT5
Примечание. Вам понадобится «Мастер зеркального копирования» в основной учетной записи, за которой будет следовать клиентская учетная запись, и «Клиент зеркального копирования» в клиентской учетной записи, которая будет следовать за основной учетной записью.
Блоги: https://www.mql5.com/en/blogs/post/756897.
КАК ЭТО РАБОТАЕТ :
https://www.youtube.com/watch?v=V7FNpuzrg5M
Версия МТ4
Мастер: https:/
FREE

Helps trader to place order seamlessly Close mulitple position at a time Place SL or TP for multiple position in a click Place hedge order same time with predefined SL and TP Place multi layer pending order in a click Place martingale layer Be informed about SL and TP in currency Get to know time remaining in current candle Get to know current spread View PnL, Balance, Equity on screen
FREE

About the Bollinger Bands
The Bollinger Bands indicator was invented by John Bollinger in the 1980s. The Bollinger Bands consist of a Moving Average, an Upper and a Lower Band and is included in Metatrader 5. The default settings are 20 for the period and 2 for the deviation. EasyBot Bollinger Bands is an expert advisor developed with the idea to be useful for traders who love to trade using the popular indicator Bollinger Bands. EasyBot Bollinger Bands has very simple trading logic. When the
FREE

Estratégia de negociação MACD O cálculo do MACD é executado uma vez a cada tick, e são considerados para fim de cálculo os três últimos resultados, para analisar o cruzamento da linha de zero, ou seja quando o último resultado for maior que 0 e o antepenúltimo não então há um cruzamento para cima e analogamente para baixo, quando um cruzamento é constatado o estado de uma variável de controle é alterado de "false" para "true", permitindo o abertura de uma posição caso a média de sinal também cru
FREE

Купи советник New Genius Candles AI и получи в подарок советник EA Iron Man New Genius Candles AI - представляет собой торговый советник для рынка Форекс, базирующийся на свечных моделях. Советник использует свечные паттерны для анализа рыночной динамики и принятия решений о входе и выходе из сделок. Искусственный интеллект встроен в систему для более точного анализа и адаптации к изменяющимся условиям рынка. предоставляет трейдерам мощный инструмент для автоматизированной торговли, о
Узнайте, как легко и просто купить торгового робота в MetaTrader AppStore - магазине приложений для платформы MetaTrader.
Платежная система MQL5.community позволяет проводить оплату с помощью PayPal, банковских карт и популярных платежных систем. Кроме того, настоятельно рекомендуем протестировать торгового робота перед покупкой, чтобы получить более полное представление о нем.
Вы упускаете торговые возможности:
- Бесплатные приложения для трейдинга
- 8 000+ сигналов для копирования
- Экономические новости для анализа финансовых рынков
Регистрация
Вход
Если у вас нет учетной записи, зарегистрируйтесь
Для авторизации и пользования сайтом MQL5.com необходимо разрешить использование файлов Сookie.
Пожалуйста, включите в вашем браузере данную настройку, иначе вы не сможете авторизоваться.