Смотри обучающее видео по маркету на YouTube
Как купить торгового робота или индикатор
Запусти робота на
виртуальном хостинге
виртуальном хостинге
Протестируй индикатор/робота перед покупкой
Хочешь зарабатывать в Маркете?
Как подать продукт, чтобы его покупали
Технические индикаторы для MetaTrader 4 - 38

Индикатор Канал Кельтнера представляет собой канал идущий вдоль скользящей средней , ширина которого задается путем вычисления среднего истинного диапазона на периоде скользящей средней. Этот индикатор можно применять для получения сигналов, а также в качестве замены индикатору Конверт скользящей средней , перед которым имеет преимущество в качестве авто подбора ширины канала, который можно подкорректировать параметром Size of channel in percent .
Параметры индикатора Period of indicator - Пер
FREE

ReviewCandleChart - это уникальный продукт, позволяющий проверить прошлые колебания цен, используя свечные графики. Этот индикатор точно воспроизводит колебания цен в прошлом. Он может принимать торговые решения (уровни входа, тейк-профит и стоп-лосс) много раз, чтобы вы могли быстрее изучить торговлю. ReviewCandleCahrt - отличный индикатор для улучшения навыков торговли. ReviewCandleCahrt подходит как для начинающих, так и для опытных трейдеров.
Преимущества индикатора Индикатор предназначен
FREE

Traditional RSI is one of the most popular and must-known indicator that every traders would use. In this combination, we use two RSI period with smoothed factor to smooth the RSI lines for better results. Besides, bottom of Indicator is the Trend-filter display in different colors in order to let Traders identify the trends much easier Grey : Sideway market Light-Blue : Weak UP-Trend Blue : Strong UP-Trend Light-Red : Weak DOWN-Trend Red : Strong DOWN-Trend Signal: Blue-Arrow
FREE
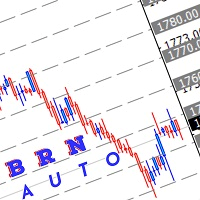
Use this indicator to draw multiple horizontal line to nearest round number Range for round number can be adjust manually depend how user want to use it Selection of colour also can be adjust manually Hope this indicator can help somebody in their trading.
How to use this: Mostly I use this indicator for break, retest and entry. example:- current price XAUUSD :1740.00 which mean the closest level are 1750.00 and 1730.00 Wait for price to break this level. then wait for retracement if price mak
FREE
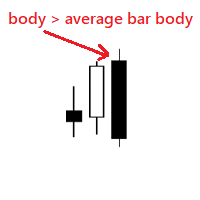
Very simple indicator that shows if body of a new bar is bigger than the average bar body. We can use the indicator to notice bars that are bigger than usual, for example this could mean a new trend. Input params: history bars to display from how many bars to get the average bar body To calculate only bars from the same type distance for the dots bull color bear color dot size
FREE

Этот индикатор служит для визуального представления Дончианского канала на вашем торговом графике. Дончианский канал - это простой технический инструмент, используемый для изображения диапазона между самыми высокими и самыми низкими значениями за определенный период. Этот индикатор улучшает визуальный анализ движения цен, предоставляя понимание потенциальных точек прорыва и продолжения тренда. Дончианский канал может быть применен как к текущему временному интервалу, так и к более высокому, если
FREE

Описание индикатора Индикатор уникален в своем роде. Он прогнозирует бары, которые могут появиться в будущем, используя теорию цикличности ценовых движений и некоторой доли стационарности на рынке. С помощью этого индикатора вы сможете прогнозировать как 1 бар в будущее, так и множество, таким образом, составляя потенциально возможную картину развития событий на рынке. В основу этого индикатора положено 5 методов прогнозирования. Первый метод - это преобразование фурье. Остальные - это методы ли
FREE

Индикатор Currency Explorer позволяет вам знать с рассчитанной точностью силу и слабость каждой валюты и торговать, применяя необходимые стратегии. Наши модели машинного обучения рассчитывают силу/слабость каждой валюты на основе нескольких факторов помимо поведения цены. Индикатор предоставляет количественное значение силы восьми наиболее популярных основных валют (EUR, USD, JPY, GBP, AUD, NZD, CAD и CHF) от 0 до 100 на пяти любых таймфреймах, выбранных пользователем. Кроме таймфреймов, можно в
FREE
Highly configurable Average True Range (ATR) indicator.
Features: Highly customizable alert functions (at levels, crosses, direction changes via email, push, sound, popup) Multi timeframe ability Color customization (at levels, crosses, direction changes) Linear interpolation and histogram mode options Works on strategy tester in multi timeframe mode (at weekend without ticks also) Adjustable Levels Parameters:
ATR Timeframe: You can set the lower/higher timeframes for ATR. ATR Bar Shift: y
FREE
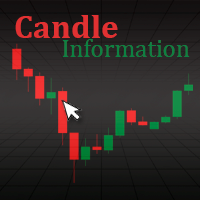
Tool for candle information. It allows to show the user information related to the candle when hovering the mouse over it. It has a simple interface. The user can modify its style by changing the colors in the input parameters.
Show data like: Candle date and time Open price of candle Close price of candle Highest candle price Lowest candle price Candle volume
FREE

The indicator allows you to trade binary options. The recommended time frame is М1 and the expiration time is 1 minute. The indicator suitable for auto and manual trading. A possible signal is specified as a arrows above/under a candle. You should wait until the candle closes! Arrows are not re-painted Trade sessions: TOKYO section (Half end) and LONDON section (First half) Currency pairs: EUR/USD Working time frame: M1 Expiration time: 1 minute. The indicator also shows good results when using
FREE

Commodity Channel Index and Moving Average [CCI MA] A combination of CCI and MA to create a crossover trading setup Input parameters: signal mode: set it to true if you want to plug it into STAT (Signal Tester and Trader) arrow shift: distance between fast EMA line to arrow on chart price line filter CCI period CCI price method Moving average period Averaging method upper level lower level You can find the best setting for 4 hour EURUSD on this video
FREE

QuantumAlert CCI Navigator is a free indicator available for MT4/MT5 platforms, its work is to provide "alerts" when the market is inside "overbought and oversold" regions in the form of "buy or sell" signals. This indicator comes with many customization options mentioned in the parameter section below, user can customise these parameters as needful. Join our MQL5 group , where we share important news and updates. You are also welcome to join our private channel as well, contact me for the pri
FREE

Many traders use The Bull-Bear Indicator, I decided to combine the two into just one, so the visualization is better, and I am sharing it with you. the trading rules remain the same, you can adjust the period as per your preference.
The Bull-Bear Indicator is a free indicator with several versions widely published on the internet, this is just a version that I put together, I hope you like it. If you want to know the indicators of my authorship, please visit my page here .
FREE

A simple but useful indicator for controlling volatility in intraday trading.
The indicator plots the average volatility (ATR) levels for the specified number of days on the current chart.
On the current trading day, the levels are dynamic and move depending on the minimum and maximum prices of the current day in "real time" mode.
In the input parameters we specify:
- the number of days to calculate and draw the ATR levels
- color of the ATP level lines
- the thickness of the ATR le
FREE
Данный индикатор представляет собой скользящую среднюю построенную по методу предложенному Alan Hull. Индикатор входит в серию индикаторов - Hull Line AM, Hull Momentum AM, Hull Candles AM, Hull Signal AM . Индикатор имеет минимальное запаздывание и позволяет эффективно следовать за направлением тренда. На полностью сформированных барах индикатор не перерисовывается. Индикатор дополнен сигналами и уведомлениями на терминал и электронную почту.
Применение индикатора идентично применению станда
FREE
倒计时指标功能介绍 类别
解释
备注
预计结束倒计时 计算当前周期蜡烛图的结束时间(可应用于所有周期),其考虑了蜡烛图可能会因为日常休市而提前结束的情况; 如果该蜡烛图包含多个休市和开市的情况下,以最后的休市或者蜡烛图收盘时间为准。 值得特别注意的是:本指标并没有将平台额外公布的节假日休市、修改休市或者开市时间等因素纳入考虑范围,它仅仅是基于MT4所公开的交易时间做计算,无法100%确保本品种的收盘或者开盘时间无误 ,故使用者需提前明确该品种交易时间情况。
预计开盘倒计时 仅限于状态为"休市中"的提示,根据MT4上公开显示开市时间进行预估大约还有多久时间开盘; 和预计结束倒计时类似,并没有将额外公布的时间纳入考量。由于W1和MN1周期中包含多次的开盘和收盘,所以该两周期无休市提示。
【状态】 颜色 状态 备注 绿色 正常 一切正常 黄色 服务器无报价 服务器实际上传送到MT4并非是毫无中断的,可能是1分钟之内出现多次,甚至是连续较长的时间无报价,取决于您所处的网络延迟、服务器的情况等等。
本品种已有X秒无报价 MT4上并不是所有的品种的报价都是最新的,有可能某
FREE

Indicator support for only: Entry Point to Trend Pro Link indicator support : https://www.mql5.com/en/market/product/70867
Supports all currency pairs declared in the definition. Help investors do not need to open many charts. Notice the DEAL: multiple time frames confluence M15, H1, H4.
Entry Point to Trend Pro The indicator helps investors to identify the earliest and perfect reversal point. Easy to make decision to trade with the trend Price action trading. support resistance
FREE

Это авторская торговая система. Предназначен для внутридневной торговли. Сигналы не переписываются . Подойдет для любого инструмента и таймфрейма. Можно включить оповещения. Легок в использовании. Смотри скриншоты. Подпишись на мой telegram канал, ссылка в контактах моего профиля . Простые настройки! Все уже сделано для вас! Основа - это анализ текущего тренда. Индикатор ищет выход из накопления. Если ты давно ищешь хорошую торговую систему, то она перед тобой!
FREE

Идите по следу кометы, чтобы знать, как будет развиваться тренд. Индикатор помогает определить развитие цены в зависимости от способа отображения этих астрономических объектов на графике. Когда кажется, что комета останавливается, она значительно раскрывает свои хвосты и предупреждает о возможной смене тренда. Напротив, когда кажется, что она ускоряется (выглядит тонкой, потому что линии хвоста сгруппированы), она показывает безопасность и продолжение тренда. Голова или ядро кометы будет отображ
FREE

This indicator shows in a subwindow the trend in M1, M5, H1, D1 timeframes based on MA, MACD, Stochastic This way you could see in once in different timeframes what happening. This is my first free indicator. Please follow I will put here some more. Thank you for you attention. . . . . .
lfknglkslksnlgslgnsflgjrpoesv ,msv lkrjpfjésmdg sd.npo4wsmdglknsp4jwpkeégmfs.lkmp Thank you
FREE

This indicator softens the value of the RSI (Relative Strength Index) and reduces its volatility. You can use this indicator in your expert advisors, indicators and strategies. With this indicator, you don't need to have two indicators on the chart at the same time. For example, an RSI indicator and a Moving Average indicator If you have any questions or concerns, contact me.
FREE

Целью этой новой версии стандартного MT4 индикатора, входящего в поставку платформы, является отображение в подокне нескольких таймфреймах одного и того же индикатора. См. пример, приведенный на рисунке ниже. Однако индикатор отражается не как простой индикатор MTF. Это реальное отображение индикатора на его таймфрейме. Доступные настройки в индикаторе FFx: Выбор таймфрейма для отображения (от M1 до MN) Установка ширины (количество баров) для каждого окна таймфрейма Всплывающее оповещение/звуков
FREE
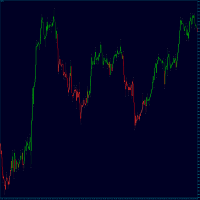
TrendFinder RSI are Colored candlesticks showing the trend based on The Relative Strength Index (RSI) This indicator will give you the color change on the next bar on the confirmation candle and will never repaint TrendFinder RSI is optimize to trade on any market and to be used trending and None trending markets. For best results use this indicator as an extra tools after you have completed your regular analysis and use it for alerts based on such analysis.
FREE
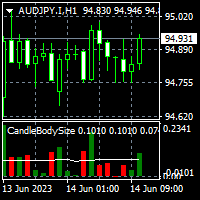
To get access to MT5 version please click here . This is the exact conversion from TradingView: "Candle body size" by "Syamay". This is a light-load processing indicator. This is a non-repaint indicator. Buffers are available for processing in EAs. All input fields are available. You can message in private chat for further changes you need. Thanks for downloading
FREE
Индикатор отображает размер бара и его направление. ---------------------------------------- Цвета гистограммы: * Красный - Медвежий бар.
* Зелёный - Бычий бар.
* Серый - Цена открытия и цена закрытия равны. * Синяя линия - скользящая средняя.
---------------------------------------- Параметры: - Type of Calculation - Тип расчёта ( Low to High, Open to Close ) - Moving Avarage - Период скользящей средней
FREE

Displays previous months Highs & Lows. You can set the number of months to display levels for, also the line style, color and width. This is very useful for traders using the BTMM and other methods like ICT. I'll be creating similar indicators for MT5 for the BTMM. Send me your suggestions to my Telegram: https://t.me/JDelgadoCR Take a look at my other products at: https://www.mql5.com/en/users/jdelgadocr/seller
FREE

Индикатор отображает на графике сигналы согласно стратегии Билла Вильямса. Демо версия индикатора имеет такие же функции, как и платная, за исключением того, что может работать только на демо-счете. Сигнал "Первый мудрец" формируется, когда появляется разворотный бар с ангуляцией. Бычий разворотный бар - у которого более низкий минимум и цена закрытия в верхней его половине. Медвежий разворотный бар - более высокий максимум и цена закрытия в нижней его половине. Ангуляция образуется, когда все
FREE
Данный индикатор представляет собой осциллятор построенный по принципу классического Momentum. Индикатор входит в серию индикаторов - Hull Line AM, Hull Momentum AM, Hull Candles AM, Hull Signal AM . Индикатор представляет собой разницу текущей цены и ценой некоторое количество периодов назад. Отличием от классического индикатора Momentum является предварительное сглаживание цен по методу предложенному Alan Hull. Использование индикатора: Следует принимать во внимание что значения индикатора
FREE

a novel indicator by the maker of velvet.
FREE

The indicator is based on the concept of price channels, which are formed by plotting the highest high and lowest low prices over a specified period of time. The Donchian Channel Indicator consists of three lines: an upper channel line, a lower channel line, and a middle channel line. The upper channel line represents the highest high over a specified period, while the lower channel line represents the lowest low. The middle channel line is the average of the two and can be used as a reference f
FREE

OVERVIEW
K-means is a clustering algorithm commonly used in machine learning to group data points into distinct clusters based on their similarities. While K-means is not typically used directly for identifying support and resistance levels in financial markets, it can serve as a tool in a broader analysis approach.
Support and resistance levels are price levels in financial markets where the price tends to react or reverse. Support is a level where the price tends to stop falling

Индикатор рассчитывает текущий спред для каждого тика по формуле Spread=(ASK-BID)/Point. График изменения границ спреда за таймфрейм отображается в отдельном окне с момента присоединения индикатора. Выводятся две линии соответствующие минимальному и максимальному значениям спреда.
Окно индикатора самонастраивается по минимальному и максимальному значению от момента запуска. Минимальное и максимальное значения за весь период работы индикатора будут соответствовать отображаемым значениям уровней
FREE

Introducing Austin Bands—an innovative indicator designed to enhance your forex trading strategy by applying moving averages to the MetaTrader 4 indicator, Bollinger Bands.
Bollinger Bands are a popular technical analysis tool that consists of a middle band (usually a simple moving average), an upper band (calculated by adding a specified number of standard deviations to the middle band), and a lower band (calculated by subtracting a specified number of standard deviations from the middle ban
FREE
Утилита предназначена для упрощения графического анализа.Настроив один раз , можно сохранить в шаблон,все настройки сохранятся.В настройках меняются уровни фибоначчи , цвета,стили и толщина линий также текстовые метки на кнопках.Есть возможность расширить функционал , добавить временные зоны Фибоначчи ,Фибо арки ,линии по углу ,продление прямоугольных зон до текущей цены.Присылайте рекомендации,все можно осуществить в рамках бесплатной утилиты.
FREE
"The trend is your friend, until the end when it bends". The "Hexa MA" custom indicator is a trend following indicator. It uses 6 Moving Averages to spot the trend and follow, and also to filter the bad signals for the fast Moving Averages. The basic is simple, yet the strategy is powerful.
Recommended settings for the indicator : - Moving Average periods : SMA 5, SMA 10, SMA 20, SMA 50, SMA 100, SMA 200. - Timeframe : M15 is the default. But any timeframe can be used. - Currency pair : Since
FREE

Индикатор показывает изменения цены за те же дни в прошлые годы. Требуется таймфрейм D1. Индикатор предсказывает на основе баров D1 на тех же днях прошлых лет относительное изменение цен. Параметры: LookForward - количество дней (баров) для показа "будущих" изменений цен; по-умолчанию - 5; Offset - количество дней (баров) для сдвига назад по истории; по-умолчанию - 0; ShowAverage - переключатель режима; true - показывать среднее для всех 8 прошлых лет и границы стандартного отклонения; false - п
FREE

Footmarks Pro Footmarks Pro is a MetaTrader 4 Essential Indicator that create round number or sweetspot on chart with "Button". Parameter Indicator Name - Footmarks Pro Pair Selection - 250 points / 500 points / 1000 points Sweetspot Setting Sweetspot Line Color Sweetspot Line Style Sweetspot Line Thickness Sweetspot Button Setting Button Axis-X Button Axis-Y Thanks...
FREE

Это демонстрационная версия PipsFactoryDaily Этот индикатор зависит от цен High и Low валюты за последний день, использует секретные уравнения для рисования 10 линий.
Особенности Вы будете знать по какой именно цене вам лучше войти на рынок. Вы будете знать, когда выходить из рынка. Вы будете знать, что вам следует делать в рынке: Покупка Продажа Тэйк Профит, имеются три уровня для фиксации прибыли Поддержка Сопротивление Риск при покупке Риск при продаже
Типы сигналов и используемые таймфре
FREE
Highly configurable Volume indicator.
Features: Highly customizable alert functions (at levels, crosses, direction changes via email, push, sound, popup) Multi timeframe ability Color customization (at levels, crosses, direction changes) Linear interpolation and histogram mode options Works on strategy tester in multi timeframe mode (at weekend without ticks also) Parameters:
Volume Timeframe: You can set the lower/higher timeframes for Volume. Volume Bar Shift: you can set the offset of th
FREE

Индикатор MAtrio, отображает на любом таймфрейме сразу три скользящих средних с периодом 50 -дневная ,100 -дневная , 200 -дневная . После присоединения к графику сразу отображает три скользящих средних с параметрами простой (SMA) скользящей средней SmoothingType50 , простой (SMA) скользящей средней SmoothingType100, простой (SMA) скользящей средней SmoothingType200. Соответственно с типом цены ValuePrices50, ValuePrices100, ValuePrices200 по умолчанию везде стоит цена Close price .
FREE

This is a tool to measure the velocity of the price. It's completely free, you can download and use. "Way: distance of price after one tick." "Speed: price velocity after one tick." p/s: The time for the price to jump 1 tick will not be fixed, you should know this. If Way > 0, the indicator will change color to Green If Way < 0, the indicator will change color to Red || I am a 3D artist and I love math and programming! ||
FREE
Данный индикатор отображает на графике цены сигналы основанные на данных классического индикатора - WPR. WPR может использоваться для определения на рынке зон перекупленности или перепроданности. Достижение таких уровней говорит о том, что рынок может вскоре развернуться, но не подает сигнал, поскольку в сильном тренде рынок может находиться в перекупленном или перепроданном состоянии достаточно продолжительное время. Сигналы как и на большинстве осцилляторов подаются при выходе из этих зон. Дан
FREE

Relative Strength Index Cross [RSI Cross] A combination of 2 RSI to create a crossover trading setup Input parameters: signal mode: set it to true if you want to plug it into STAT (Signal Tester and Trader) arrow shift: distance between fast EMA line to arrow on chart price line filter fast RSI period slow RSI period RSI price method price upper level price lower level You can find the best setting for 4 hour EURUSD on this video
FREE

Данный индикатор окрашивает свечи в соответствии с прогнозируемым ценовым движением. Анализ производится на основании данных классического ADX. Если линия DMI+ выше линии DMI- и основная линия ADX растет - свеча окрашивается цветом, сигнализирующем о росте цены; Если линия DMI+ ниже линии DMI- и основная линия ADX растет - свеча окрашивается цветом, сигнализирующем о падении цены. Индикатор на полностью сформированных свечах не перерисовывается. Свеча которая формируется может менять цвет, в зав
FREE

Dynamic Price Volatility Indicator (DPVI)
The Dynamic Price Volatility Indicator (DPVI) is designed to provide traders with valuable insights into market volatility and potential price movements. It combines elements of volatility analysis and trend identification to assist traders in making informed trading decisions.
Features: Dynamic Volatility Bands: utilizes a proprietary algorithm to calculate dynamic volatility bands that adjust in real-time based on market conditions. These bands act
FREE

Rua Trend Pro This is an indicator that helps identify Trends relatively accurately. Can be used for any currency pair. And usable on all time frames. Recommended use from M15 and above. You can use it to identify trends, or to identify reversals very well. Input parameters: in_TradePeriod in_StopPeriod in_Alerts A product of Ruacoder Provide code indicator and EA services upon request
FREE

Этот индикатор является идеальным инструментом для сравнения брокеров на предмет минимального запаздывания. Он моментально показывает медленных и быстрых брокеров. Точка на линии означает, что этот брокер самый быстрый, а красной линией (Broker_A) отмечен самый медленный брокер. Посмотрите пример на скриншоте.
Как это работает? Индикатор работает с общей ценовой информацией в общей папке из каталога данных. Он сравнивает все цены. Цена основана на среднем значении (Ask + Bid) / 2. Есть два усл
FREE

[DESCRIPTION] A Simple Moving Average with period 20 that changes color to green when the price is above the moving average and to red when the price is below the moving average. A simple moving average (SMA) calculates the average of a selected range of prices (closing prices), by the number of periods in that range. The SMA is a technical indicator that can aid in determining if an asset price will continue or reverse a bull or bear trend [WARNING AND RECOMMENDATIONS] Trading Forex and
FREE

Скалированный индикатор потрясающего осциллятора (SAO) представляет собой усовершенствованную версию индикатора потрясающего осциллятора, целью которой является установление стабильных точек опоры для выявления рыночных перегибов. В отличие от стандартного индикатора потрясающего осциллятора, который регистрирует изменения в пипсах для разных товаров, единственной неизменной точкой отсчета является нулевая линия. Это ограничение мешает инвесторам и трейдерам точно определить уровни для разворота
FREE
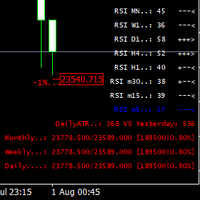
This indicator was created most for personal use. I decided to look up the last 3 bars of RSI, it is good for scalping or for weekly trading and looks as universal fx-toy. In menu you can turn on daily percentage gain info, it is good for crypto as for me, weekly and monthly gains also included as informers. Short ATR helps to determine when price was stopped and entry for pulse pump/dump. The filter of numbers of RSI can be tuned for overbought/oversold values with colors you needed. Exam
FREE

Трендовый индикатор с оцилятором. Отображает ценовые зоны между двух мувингов и осцилятор. Восходящий тренд индицируется красным цветом, нисходящий - синим. Настройки: Slow MA Period - Период медленной MA Fast MA Period - Период быстрой MA Smoothed Data - Сглаживание данных Show Area MA - Отображение ценовых зон MA Show Oscillation - Отображение осцилирования MA Move Oscillation to Slow MA - Отображение осцилятора на медленной MA Color Up - Цвет восходящего тренда Color Down - Цвет нисходящего
FREE

Support and Resistance Levels Arrow Indicator please leave 5 stars to me A support level is a level where the price tends to find support as it falls. This means that the price is more likely to "bounce" off this level rather than break through it. However, once the price has breached this level, by an amount exceeding some noise, it is likely to continue falling until meeting another support level. A resistance level is the opposite of a support level. It is where the price tends to find re
FREE

Проверьте это, и если вам это нравится, просто наслаждайтесь этим. Попробуйте различные значения, чтобы найти параметр, который лучше всего подходит для вашей торговли. Восходящий сигнал, если индикатор окрашен зеленым газоном и медвежьим сигналом, если индикатор серый. Вы можете использовать сам линию для задней остановки при открытии ордеров. Это всего лишь инструмент. Дополнение. Это не стратегия. Объедините его с собственным анализом Просто скачайте его и попробуйте, это бесплатно.
FREE
Become a constantly profitable 5-star forex trader!
We offer a few indicators to support you understand and analyse the market! With our strategies you will improve your trading system and bacome an expert...
We have indicators for trend direction, market direction and others.. for multi-time frames and that covers all majors or your favorite trading symbols! Some of them offer a customizable calculation parameters... or Graph features!
See how powerful they are! The are also easy-to-use
FREE
The LWO is a tool that effectively indicates the end of trends. Being an oscillator, it has values between 0 and 100, defining the areas of hyper-sold and those of hyper-bought. Its effectiveness is due to the weighing of prices at the end of individual periods on a logarithmic scale; this allows you to have a perception of the will of the market.
The parameters
The indicator has only 2 settable values, period and smooth factor.
The period indicates how many bars the weighing is performed,
FREE
Индикатор Trender определяет смену тренда. Для того чтобы её не пропустить, настройте его на отправку уведомлений в ваш мобильный терминал (Push), или в виде алерта ( Alert ), или по Email. Также индикатор предоставляет потенциальные точки входа и расчитывает и отображает уровни стоплосс и тейкпрофит.
Преимущества: - Не перерисовывается - Может помочь в фильтрации сигналов в вашей стратегии - Работает на всех парах и таймфреймах - Прост в настройке - Даёт уже готовые сигналы для открытия поз
FREE

The parabolic stop and reverse (PSAR) indicator was developed by J. Welles Wilder, Jr. as a tool to find price reversals which can be utilized as stop-loss levels as well as trade triggers. The notable difference about the PSAR indicator is the utilization of time decay. The PSAR indicator forms a parabola composed of small dots that are either above or below the trading price. When the parabola is below the stock price, it acts as a support and trail-stop area, while indicating bullish up t
FREE

High, Low, Open, Close — не многовато? Иногда нужно иметь однозначную историю котировок. Но, выбирая что-то одно, теряешь остальное. Без потерь не получается и при сглаживании. Причем, часто теряется один из самых важных для рынка моментов: информация об экстремумах. Именно благодаря сохранению информации и о максимумах, и о минимумах, правильным "сглаживанием" для истории котировок являются зигзаги. Но и у них есть недостаток — отсутствуют промежуточные значения. Индикатор Price Line решает эту
FREE

Maltese cross GBP Универсальный инструмент для определения трендов, флетов и торговли по графическим паттернам. Объединяет техники Гана, Эллиота, Мюррея.
Просто разместите его на графике и он покажет направление и скорость движения цены, выделит разворотные моменты. Maltese cross поможет точно определять узловые моменты в истории, планировать торговые действия и сопровождать открытые сделки. Эта бесплатная демонстрационная версия MalteseCross ограничена GBPUSD и кроссами GBP. Никаких прочих
FREE

This indicator determines minimum volumes needed during a candle formed so that it would be higher than current volume's average. Although you can place MAs on your volume indicator, this indicator has non-repaint characteristic so you may not to worry about sudden volume increase. This indiator also draw volume indicator for its own. Input Description: period: Period used for indicator. Must be higher than 1. Output Description: VolumeXover: This indicator's main feature. During the time the vo
FREE

Двойной RSI по временным рамкам - это новый технический индикатор, предназначенный для трейдеров, которые хотят сравнивать показатели Индекса Относительной Силы (RSI) из двух различных временных рамок на одном графике. Эта двойная перспектива позволяет трейдерам более эффективно идентифицировать подтверждения трендов и дивергенции. Например, трейдер может использовать RSI с одночасового графика наряду с дневным RSI, чтобы убедиться, что краткосрочные сделки соответствуют более широкому рыночному
FREE

Данный индикатор отображает графики "Крестики-нолики". Графики "Крестики-нолики" показывают только те движения цены, которые превышают установленный размер. Индикатор помогает удалить шумы и сосредоточиться на основных трендах. Здесь время не имеет значения. Учитываются только движения цен. Поэтому график "Крестики-нолики" не синхронизирован с основным графиком, на который установлен индикатор. Узнайте больше о графиках "Крестики-нолики": http://stockcharts.com/school/doku.php?id=chart_school:ch
FREE

Introducing CCI Jurik—a dynamic indicator designed to elevate your forex trading experience by integrating custom moving averages based on the Commodity Channel Index (CCI) with the MetaTrader 4 indicator, CCI.
Jurik moving averages are renowned for their accuracy and reliability in analyzing price movements in the forex market. They offer traders a smoother representation of price action, reducing noise and providing clearer signals for identifying trends and potential reversals.
The Commo
FREE

Очень полезный индикатор для торговли, который показывает текущую нагрузку на депозит. Нагрузка рассчитывается по формуле (маржа/баланс)*100%. Если нужно , индикатор подает звуковой сигнал, когда нагрузка на депозит превышает определенный уровень. Нагрузка отображается общая, с учетом все открытых позиций. Параметры индикатора: Color - цвет текста. Font size - размер шрифта. Font family - семейство шрифта. Right - отступ справа. Bottom - отступ снизу. Max load - максимальная нагрузка, при котор
FREE

Данный индикатор отображает на графике цены сигналы основанные на данных классического индикатора - RSI. RSI может использоваться для определения на рынке зон перекупленности или перепроданности. Достижение таких уровней говорит о том, что рынок может вскоре развернуться, но не подает сигнал, поскольку в сильном тренде рынок может находиться в перекупленном или перепроданном состоянии достаточно продолжительное время. Сигналы как и на большинстве осцилляторов подаются при выходе из этих зон. Дан
FREE

28 market in a Single Indicator! You have 8 Lines and each represents a currency { EUR - USD - GBP - JPY - AUD - NZD - CAD - CHF } .
What It Does? It calculates a custom oscillator on all 28 Forex Pairs and draws you the Strength of each currency. This way you can analyze the Trend and the Volatility on a Multicurrency Rate. Also by Clicking on two different currencies instantly changes the market.
How To Use It? You can use this indicator to find true market contractions when two currenc
FREE
RTL Map AM (Reference Trend Line Map) - индикатор разработанный на основе комплекса цифровых индикаторов технического анализа описанных в статье Владимира Кравчука: "Цифровые индикаторы в техническом анализе финансовых рынков" . Индикатор отображает на графике цены сигналы на покупку/продажу таких цифровых индикаторов технического анализа как FTLM и STLM, а также непосредственно линии цифровых фильтров RSTL, SATL, RFTL, FATL. Сигналы отображаются на полностью сформированных барах и не перерисо
FREE

This indicator is an utility for have always under control, how much time is left at the end of the bar setted.
The utility show on the lower right of the chart, the countdown to the end.
When the remaining seconds is = to the seconds set in the input, the color of remaining seconds on chart, change color and play a warning sound to warn you that the bar is about the end. When the remaining seconds is < to the seconds set in the input, the utility play a beep to warn you that the bar is in
FREE

Spin is an intrinsic form of angular momentum carried by elementary particles, composite particles (hadrons), and atomic nuclei.
Spin is one of two types of angular momentum in quantum mechanics, the other being orbital angular momentum. The orbital angular momentum operator is the quantum-mechanical counterpart to the classical angular momentum of orbital revolution and appears when there is periodic structure to its wavefunction as the angle varies.For photons, spin is the quantum-mechanica
FREE
MetaTrader Маркет - единственный магазин, где можно скачать демоверсию торгового робота и подвергнуть его проверке и даже оптимизации на исторических данных.
Прочитайте описание и отзывы других покупателей на заинтересовавший вас продукт, скачайте его прямо в терминал и узнайте, как протестировать торгового робота перед покупкой. Только у нас вы можете получить представление о программе, не заплатив за неё.
Вы упускаете торговые возможности:
- Бесплатные приложения для трейдинга
- 8 000+ сигналов для копирования
- Экономические новости для анализа финансовых рынков
Регистрация
Вход
Если у вас нет учетной записи, зарегистрируйтесь
Для авторизации и пользования сайтом MQL5.com необходимо разрешить использование файлов Сookie.
Пожалуйста, включите в вашем браузере данную настройку, иначе вы не сможете авторизоваться.