Смотри обучающее видео по маркету на YouTube
Как купить торгового робота или индикатор
Запусти робота на
виртуальном хостинге
виртуальном хостинге
Протестируй индикатор/робота перед покупкой
Хочешь зарабатывать в Маркете?
Как подать продукт, чтобы его покупали
Торговые роботы и индикаторы для MetaTrader 4 - 58
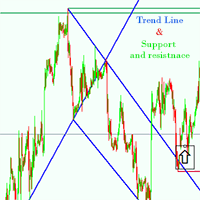
Support and resistance Strategy is one of the most widely used concepts in forex trading.
Strangely enough, everyone seems to have their own idea on how you should measure forex support and resistance. no more wasting time This Indicator is made to do it automatically for you, Features of support and resitance indicator * Automatically detection of the trend line and support & resistance * Works on any pair any time frame any time * Works on offline Chart Inputs : TrendLinePeriod=900 CycleSi

The indicator shows buy and sell signals. The " CounterTrend 4 " is designed to recognize profitable counter trend patterns from your chart. Features: The CounterTrend 4 is a Counter-Trend Trading with Simple Range Exhaustion System. Signals based on the daily trading range. The indicator calculates the trading range for the last few days and compare the price movements on short time intervals and generating short term reversal points. This is a leading indicator. It works on any instruments.
Check My Product Contact me to discover all my services
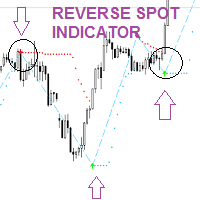
Reverse Spot is an indicator that can help you find and identify possible price reverse zones. This indicator can be used both as a trend continuation signal after a small period of consolidation or retracement and as a trend change signal.
Reverse spot is a very easy to use indicator and thanks to the signals it sends with the arrows it is easy for the trader to identify moments in which to evaluate his own operations.
Reverse Sp

Parameters
AutoTargetMoney If the total profit on the account equals or exceeds the target that has been filled in this column, EA will close the order of all transactions AutoTarget % If the total profit on the account equals or exceeds the target in the percentage of the balance that has been filled in this column, EA will close the order of all transactions DeletePendingOrders If TRUE is when the profit transaction is reached from TargetMoney or Target Percennt column, then EA will delete P

The GGP Williams Vix Fix MT4 Indicator is based on the volatility of the market and grants a huge support for finding out when a correction is coming to end. This indicator is MT5 conversion of the CM_Williams_Vix_Fix Finds Market Bottoms Indicator by “ChrisMoody “ in Trading View website and some alert methods are added to provide real-time alerts when a trading signal is generated, in order to allow traders to act quickly and efficiently. For MT5 version please click here . Larry Williams

This is the Equity Protector you've been looking for!! I couldn't find what I needed so I created this. Protecting your capital should be your #1 goal, this tool is an amazingly flexible way of doing exactly that! Stand out! Features: (all completely customisable and work independent to each other) (1) Temporarily Remove SL & TP - This game changing function will temporarily remove your SL & TP levels and then re-apply them when the specified time period is up e.g. Set the time between 11:0
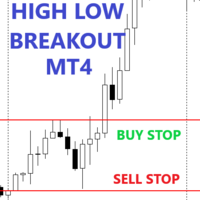
This expert advisor will make a pending order at a certain time, pending orders are made in the form of buying at the highest price and selling at the lowest price (in a predetermined time frame) you can make a pending order breakout at the highest and lowest prices according to your wishes, thus it can be used for the following strategies: - Asian Session BreakOut - European Session BreakOut - US Session Breakout - News Trading - Etc.
Main parameter description Notes : order type 4 is not par
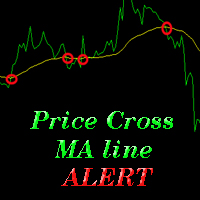
Индикатор выдает алерты при пересечении рыночной ценой скользящей средней. Вы можете выбрать любую линию скользящей средней на вкладке входных параметров (см. один из скриншотов внизу). Параметры (те же, что и четыре параметра, которые вы должны выбрать при добавлении на график линии скользящей средней): ma_period ma_shift ma_method (0=Simple; 1=Exponential...) ma_apply (0=Close; 1=Open; 2=High; 3=Low...) При пересечении ценой линии скользящей средней вы получите алерт, содержащий примерно так

Key Levels + Zones
Indicator cleanly displays even numbered price levels: “00s” and “50s” . Additionally, you can display “Mid-Lines” which are preset distance levels on both sides of the even numbered price levels (set to 12.5 pips by default). This 25-pip zone that straddles each even numbered price relates to where many traders place their stops and therefore can be a risk “Zone” to steer clear of when placing your stops. The zone also acts as support and resistance. Indicator p rovid

Целью этой новой версии стандартного MT4 индикатора, входящего в поставку платформы, является отображение в подокне нескольких таймфреймов одного и того же индикатора и его расхождений. См. пример, приведенный на рисунке ниже. Однако индикатор отражается не как простой индикатор MTF. Это реальное отображение индикатора на его таймфрейме. Доступные настройки в индикаторе FFx Divergences: Выбор таймфрейма для отображения (от M1 до MN) Установка ширины (количество баров) для каждого окна таймфрейма
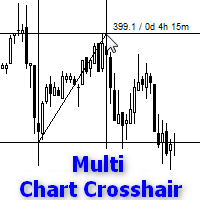
Индикатор работает как скрипт и показывает перекрестие на всех графиках с любым символом. Может применяться для сравнения ценовых уровней и временных периодов на всех графиках с одной валютной парой или для сравнения свечей с точки зрения временных периодов на графиках с любыми символами. Вы также можете сравнивать различные типы графиков, например, обычный график с тиковыми графиками или графиками рейндж-баров. Индикатор с легкостью устанавливается на график через меню Навигатора или при помощи

Этот индикатор создан в качестве расширения и обобщения M и W волновых фигур А. Меррилла. С помощью 5 экстремумов или 4 отрезков зигзага легко построить M или W фигуру в любом месте истории котировок. В классическом подходе различные конфигурации волн зигзага сведены в предопределенный набор фигур, которые допускают превращения по особым правилам — и это позволяет предсказывать последний отрезок зигзага. В отличие от этого, данный индикатор анализирует доступную историю и строит статистику всех

A utility to close all orders with one simple click at once.
Various options are available to filter or select orders : Type of orders : Buy / Sell / Buy Limit / Sell Limit / Buy Stop / Sell Stop Symbol Selection : All / Chart Symbol / Custom Symbols. You can enter custom symbols separated by comma. (for example you can enter EURUSD,GBPUSD,AUDJPY) Order Open Type : Manual Opened / Opened by EA Magic Number : You can enter more than one magic number separated by comma. (for example you can ente

Индикатор дает сигналы согласно методике VSA (Volume Spread Analysis) - анализ торгового объема в сочетании с размером и формой свечи. Сигналы в виде стрелок выводятся после закрытия бара на основной график. Стрелки не перерисовываются.
Входные параметры DisplayAlert - включение оповещения, по умолчанию true; Pointer - вид стрелки (три варианта), по умолчанию 1; Factor_distance - коэффициент расстояния размещения стрелки, по умолчанию 0.7. Рекомендуемый таймфрейм - М15. Валютная пара - любая.

This indicator uses candlesticks with large real bodies to predict possible market structure shift. Displacement is a very powerful move in price action resulting in strong selling or buying pressure. Generally speaking, displacement will appear as a single or a group of candles that are all positioned in the same direction. These candles typically have large real bodies and very short wicks, suggesting very little disagreement between buyers and sellers. Often, a displacement will occur just af

EA Moon Trading is a fully automated trading robot based on Price Action with no lagging indicators. The Expert's simple and effective strategy tracks price and volume movements to trigger trading signals. The EA is programmed with smart and advanced algorithms, it adapts to each currency pair, has all settings optimized and is simple to use. The EA is suitable for currency pairs and Gold. Feature:
+ Fully automated trading 24/5 with time filter. + No need in a large initial deposit. + Alw

Индикатор Automatic Fibonacci with Alerts автоматически отображает уровни коррекции Фибоначчи на основе количества баров, указанного в параметре BarsToScan. Уровни обновляются автоматически в режиме реального времени при появлении новых максимумов и минимумов среди выбранных баров. В настройках индикатора можно выбрать, какие значения уровней надо отобразить. Также в параметрах индикатора можно выбрать цвета уровней - это позволяет установить на графике несколько индикаторов с различными настрой

Introduction
Virtual Money Flow free - Lightweight free trading robot based on Money Flow index. Orders set with ISL and take profit is virtual. Equipped with trailing stop and limited money management. How to? Any account type,leverage and time frame Works only on currency pair EURUSD, optimizations needed in regualar intervals You can start with as low as $20-50 based on leverage 500 This is not a scalper and trades can therefore be less frequent, be patient! Limited contract size
FREE

Meet the Tweezer Hunter, an essential tool for every Forex trader looking to make accurate, trend-following trades. This powerful, intuitive indicator helps traders spot potential trend reversals before they happen, providing a significant advantage in the fast-paced world of Forex trading. The Tweezer Hunter is more than your average tweezer candle indicator; it's designed with a built-in trend identification feature that accurately detects whether the market is bearish or bullish. By integrat
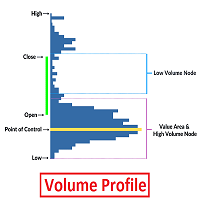
Volume Profile is an advanced charting study that displays trading activity over a specified time period at specified price levels. The study (accounting for user defined parameters such as number of rows and time period) plots a histogram on the chart meant to reveal dominant and/or significant price levels based on volume. Essentially, Volume Profile takes the total volume traded at a specific price level during the specified time period and divides the total volume into either buy volume or s

Утилита Linker charts master линкует все открытые окна графиков и переключает их на один инструмент. Манипуляции с объектами в окне, на котором запущен индикатор, копируются на все пролинкованные окна. Хорошее подспорье трейдерам, торгующим по уровням. Например, нарисованный уровень на D1 будет нарисован в других окнах. Утилита реагирует на изменения стиля, цвета объектов и выбор таймфреймов для отображения объектов. Утилита копирует настройки с вкладки "Отображение" в свойствах графических объе
Perspect EA
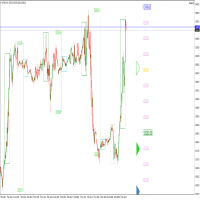
This version of the EA focusses on indicating points of interest on the chart, features include : Sessions (Asia/Gap/London/Gap/NewYork/Gap) Previous Daily/Weekly/Monthly highs and lows Previous Daily/Weekly/Monthly open and close price
Round numbers (Ruler) Opening range Initial balance Multi time frame (Yearly view, monthly opening range) Customizable chart templates for low light users The indicator will assist in advanced technical analysis, providing the user with desi
FREE
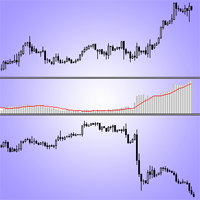
Индикатор корреляции торговых инструментов. Показывает разницу значений цен двух инструментов. Рост расхождения цен и уменьшение расхождения цен можно рассматривать как сигналы к сделкам. Индикатор можно использовать для хедж-стратегий. Индикатор подаёт сигналы Alert и Push-уведомления на мобильное приложение о пересечении скользящих средних Envelopes. У индикатора простые настройки. Нужно поместить его в окно торгуемого инструмента и выбрать параметры: Correlated_Symbol - выбор торгового инстру
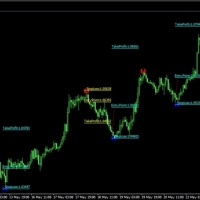
Best indicator for trend reversals How to use: wait for the candle to close above the entry price, then open the order Level lines appear when candle closes, The system shows you the best entry levels It is simple and easy to use, no additional settings are required. Best indicator for beginners and professionals By placing a pending order in the entry, you can set the displayed stoploss and the profit levels you want. You can use it alone or in addition to your strategy. All pairs with recom

Эксперт-полуавтомат для торговли по стратегии усреднения и локирования. Трейдер отравляет сигнал на открытие сеток посредством кнопок на графике. Советник открывает рыночный ордер, расставляет сетку limit-ордеров в том же направлении с умножением объема согласно настоечным параметрам и локирующий stop-ордер в противоположном направлении с объемом, равным сумме предыдущих. При прохождении ценой заданного уровня безубытка, выставляется стоп-лосс по цене открытия+спред. После выставления стоп-лоссо
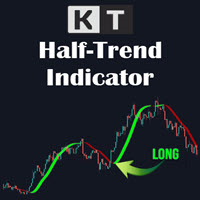
The KT HalfTrend is a moving average-based trend indicator that draws zones. It marks a trend shift by drawing bearish and bullish invalidation zones on the chart. It also displays the trend buy-sell strength with arrows on the main chart. The indicator will be flat if no trend indicates accumulation, temporary price, or distribution zones. If there is a trend, there will be a slope in that direction. The trend signals are substantial if the slope is steep, either to the upside or the downside.

Tax Buddy creates a simple, sortable trading report which you can send to your local tax authorities alongside your annual declaration. I've been using this kind of report for the German Finanzamt in order to declare my capital gains ("Kapitalerträge") in a readily comprehensible manner. For testing purposes, the Demo version places random trades in the Strategy Tester on the symbol of your choice and creates a demo report for them.
Conveniently, all reports are stored in the common path for a

Questo indicatore fractal ti invierà un messaggio telefonico (tramite app mt4) non è necessaria la configurazione dell'indicatore, basta impostare l'ID del tuo smartphone e potrai ricevere il messaggio BUY o SELL in tempo reale (affidabilità 80%)
per qualsiasi domanda o dubbio non esitate a contattarmi su mql5.com o telegram (link al gruppo disponibile in bio)

Certainly! An EA Exponential Moving Average (EMA) strategy is a trading or investment approach used in financial markets, particularly in the context of stocks, cryptocurrencies, and other assets. Here's an explanation in English: An Exponential Moving Average (EMA) strategy is a popular method employed by traders and investors to analyze price trends in financial markets. It's a technical analysis tool that helps identify potential buying or selling opportunities based on historical price data.

Очень разочаровывает, когда цена разворачивается, не достигнув нескольких пунктов до уровня Take Profit. Этот советник устанавливает виртуальные уровни рядом с уровнями TakeProfit. Если эти уровни достигнуты ценой, то ордер будет переведен в безубыток или к нему применяется трейлинг-стоп.
Особенности Советник самостоятельно не устанавливает ордера. Его работа заключается в управлении уровнями стоп-лосс существующих ордеров, установленных другим советником или вручную (с магическим числом 0). Д

Индикатор определяет и отображает на графике паттерн М. Гартли "Бабочка". Выделение паттерна производится по вершинам индикатора ZigZag (включен в ресурсы, не требует дополнительной установки). В момент распознавания паттерна выводится сообщение во всплывающем окне, отправляются оповещения на мобильное устройство и электронный почтовый ящик. Схема паттерна и параметры волн приведены на скриншоте. Параметры, заданные в индикаторе по умолчанию, являются демонстрационными для увеличения количества

This is a volume profile that shows the volume with a fixed constant time frame that you set. The indicator also shows the maximum volume value (VPOC - VOLUME POINT OF CONTROL) and the average value, colors and settings you can adjust as you like, there are many possibilities. If you need an indicator that shows the variable volume range frames there is ...HERE... Volume Profile is an advanced charting study that displays trading activity over a specified time period at specified price leve

Relative Momentum Index (RMI, Индекс Относительного Импульса) был разработан Роджером Альтманом и впервые опубликован в феврале 1993 года в журнале "Technical Analysis of Stocks & Commodities". Как следует из названия, Индекс Относительного Импульса добавляет компоненту импульса к традиционному RSI. Он направлен на увеличение надежности при помощи уменьшения ложных колебаний между заданными уровнями перекупленности и перепроданности. В индикаторе Relative Momentum Index имеется 2 составляющие. И

Short Term Scalper EA is an Expert Advisor works in the short-term direction and always uses a tight stop loss invisible to the broker. Only one order per currency pair can be opened at a time. When the short-term trend changes, the EA changes the type of the pending order, deletes the old one and places a new order. The pending order follows the price in anticipation of when the market begins its short-term movement. This scalper does not work in a flat, therefore it should be used on highly v
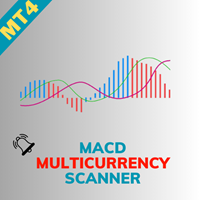
Welcome to the world of advanced trading with the MACD Multicurrency Scanner! Maximize your trading experience with our powerful MT4 indicator designed for seamless analysis and real-time insights. Key Features: Effortless MACD Scanning: Unlock the full potential of the MACD Multicurrency Scanner by effortlessly scanning multiple currency pairs. Receive instant alerts when specific Moving Average Convergence Divergence (MACD) conditions are met, ensuring you stay ahead of market movements. Comp

Interceptor – профессиональный индикатор объема и ценовых экстремумов. Interceptor объединяет в одном алгоритме четыре типа нормализованных индикаторов, определеяя ценовые экстремумы, приводящие к коррекциям и разворотам тренда. Алгоритм построен в основном на сочетании Accumulation/Distribution , On Balance Volume , Money Flow Index и Relative Strength Index . Первый параметр ( Interceptor_Depth ) определяет интервал нормализации в барах для анализа Accumulation/Distribution и On Balance Volume
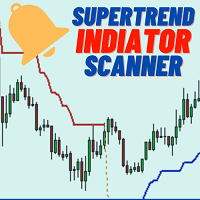
Welcome to the world of advanced trading with the Supertrend Indicator Scanner! Maximize your trading experience with our powerful MT4 indicator designed for seamless analysis and real-time insights. Key Features: Effortless Supertrend Scanning: Unlock the full potential of the Supertrend Indicator Scanner by effortlessly scanning multiple currency pairs. Receive instant alerts when specific Supertrend conditions are met, ensuring you stay ahead of market movements. Comprehensive Dashboard Insi
Welcome to the world of advanced trading with the Bollinger Bands Scanner! Maximize your trading potential with our powerful MT4 indicator designed for seamless analysis and real-time insights. Key Features: Effortless Bollinger Bands Scanning: Unlock the full potential of the Bollinger Bands Scanner by effortlessly scanning multiple assets. Receive instant alerts when specific Bollinger Bands conditions are met, ensuring you stay ahead of market movements. Comprehensive Dashboard Insights: Gai
In the trading world a golden rule that stuck with me is "hold on to your winners and cut your losers short". This golden rule is how this EA gains a positive advantage.
The EA is based on the indicator Trendy Trader. As stated unlike a standard moving average this unique algorithm will show you a less choppy signal resulting in a smoother and easier trend to follow.
Put simply when price moves above the average it signals a bullish trend and when price moves below the average it signals a
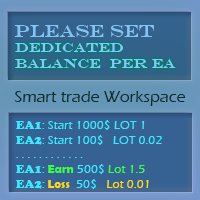
Теперь для каждого EA можно выделить отдельный баланс. То есть выделить определенную часть средств от торгового счета под заданный EA и тот будет рассчитывать лот от своего баланса, заработка и и убытков.
Торговля с выделенным балансом:
Вы сможете вести свои отдельные торговые счета на одном торговом счету. Каждый выделенный баланс можно настроить под отдельный автоматический или ручной торговый EA. Каждый выделенный баланс может торговать самостоятельно, то есть, не смешиваясь с другими. У
Welcome to the world of advanced trading with the Awesome Oscillator Scanner! Maximize your trading experience with our powerful MT4 indicator designed for seamless analysis and real-time insights. Key Features: Effortless Awesome Oscillator Scanning: Unlock the full potential of the Awesome Oscillator Scanner by effortlessly scanning multiple currency pairs. Receive instant alerts when specific Awesome Oscillator conditions are met, ensuring you stay ahead of market movements. Comprehensive Da

Советник открывает ордера Buy и Sell при движение цены в одном направление ордера с положительным профитом зарываются по TakeprofitSELL или TakeprofitBUY, ордера с отрицательным профитом открываются с удвоенным лотом.
iDistance -начальная минимальная дистанция открытия и закрытия ордера. iSlippge - проскальзывание. IncreaseBUY -расширение Stoploss ордера Buy. IncreaseSell - расширение Stoploss ордера SELL. TakeprofitSELL - закрытие всех ордеров Sell по Takeprofit. TakeprofitBUY - закрытие всех
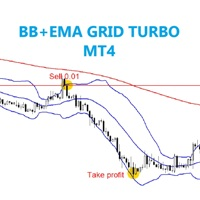
The EA trades on candles breakout from above or below BB, then be checked trend by MA to confirm order position. SETTING Symbole - Set symbol to trade. BB_period - Set BB period. BB_deviation - Set BB deviation. MA_period - Set MA period. Lots - start lot. Multiple_lots - Multiply lot for next order. Max_lots - maximum lot. Grid_boost - Frequency of opening position (Less = more order). Grid_minimum_pips - Check distance grid from last order. TP_pips - take profit, in pips. SL_money - Stop l

Советник Quick trade report separately by symbols будет полезен трейдерам, которые ведут торговлю одновременно по нескольким инструментам. Он дает возможность оценить эффективность торговли раздельно по каждому из символов. Есть возможность задавать временной период для составления отчетов. Периодичность и время автоматической генерации и отсылки отчетов по FTP. Отчет наглядно отображает графики изменения баланса по сделкам для каждого символа. Также для каждого инструмента рассчитываются след

What is this EA about? This EA is right for you if you use martingale or grid systems without own recovery. Why? Using Martingale or grid systems are pretty good on one hand because the give steady little return. But if the trend goes against the used system, more and more trades are opened. It can burn your whole account. During a trend normally there are some pullbacks. This EA is taking advantage of these pullbacks. It takes the oldest and and all trades with profit to calculate the average p

Better Support & Resistance показывает оптимальные линии и зоны поддержки/сопротивления. Он основан на фракталах (Fractals) с выбранным вами множителем. Все фракталы собираются, взвешиваются, расширяются и объединяются в четкий набор линий поддержки/сопротивления. Ближайшие линии отображаются в качестве зон, когда цена находится в данной зоне. Better Support & Resistance дает вам полное представление о важных ценовых уровнях.
Настройки Настройки индикатора Support & Resistance по умолчанию дос

Виртуальное (скрытое от брокера) выставление трейлинг-стопа, безубытка, стоп-лосса и тейк-профита. Необходимо разрешить автоматическую торговлю в настройках терминала. В режиме тестирования утилита на первых тиках открывает позиции Buy или Sell, что позволяет в визуальном режиме наблюдать заданную логику, меняя параметры утилиты. В реальном режиме утилита не открывает позиции. Параметры magic - магический номер. Если меньше 0, то сопровождаются позиции с любым магическим числом; only_this_symb

Итерационная скользящая средняя - IMA. IMA получается путем коррекции обычной MA, что заключается в добавления к ней также скользящей усредненной разности между временным рядом Х и его MA, т.е. IMA(Х)=MA(Х) + MA (Х-MA(X)), что делается в несколько итераций (а, именно, 2 итерации в данном индикаторе) и с изменением периода усреднения. При этом точки временного ряда начинают более кучно (со всех сторон) группироваться вокруг получаемой IMA и с мен

Super Trend Bars - индикатор для определения тренда. Он старается найти тренды, которые наиболее склонны к продолжению. Используется набор индикаторов и набор алгоритмов. Вероятность тренда изменяет цвет при обнаружении тренда. Красный цвет означает нисходящий тренд. Светло-зеленый цвет означает восходящий тренд. Super Trend Bar меняет цвет при обнаружении тренда.
Особенности Этот индикатор является самостоятельным индикатором тренда. Он может работать без дополнительных индикаторов. При появл

Индикатор Adaptive MA представляет из себя нехитрую модификацию скользящих средних (MA) - позволяет отобразить на графике линию среднего значения от нескольких MA. В параметрах вы сможете задать любое количество периодов MA, сколько параметров - столько скользящих средних примет участие в расчете.
С одной стороны может показаться, что ничего нового не изобретено и смысла в данном подходе нет. Но подождите расходиться. Как известно, тенденции бывают разной периодичности. А вы пробовали совмещать
FREE

LIVE SIGNAL Crazy RUN is a trading algorithm that can be used for both conservative and aggressive trading. The strategy of the Expert Advisor is based on the system of price rollback to the average value. Crazy Run opens a large number of orders, which maintains the necessary balance even when the price moves against the forecast of the trading algorithm.
Crazy Run :
- a system of deposit acceleration, which can multiply it several times in a short period of time
- conservative long term t

My Intraday trading session indicator. SL Session Strength 28 Pair https://www.mql5.com/en/market/product/57585 This strategy is even used by the Banks to make profits. They take a strong currency and pitch against a weak currency This indicator allows you to analyze the hidden trends and correlations between the 8 most traded currencies via unique strength meter which creates multiple charts in a single window based on the price action of each currency in relation to all other currenci

Contact me after payment to send you the user manual PDF file. Introduction The moving average indicator is the most well-known and one of the most popular indicators among traders. It is very simple to work with, but a basic question has always become a big challenge among traders: What is the most optimal setting of the moving average for each chart-time frame? The answer to this question is very difficult, you have to try different settings of the moving average indicator for different chart

Description: The indicator shows the TDI indicator in a separate window, and with the RSI component, the indicator finds possible divergences with M or W patterns. KEY LINKS: How to Install - Frequent Questions - All Products Functions: Finds Market Makers patterns. Finds extremes or exhaustion into the market. Looks for a trend continuation. Content: TDI Indicator Divergence and M or W Signals Note 1: This indicator should only be considered as a part of any trading strategy. You shoul
テクニカル指標開発の第一人者であるトム・デマークが考案した TDシーケンシャルは、 トレンドの転換点を判断するのに有用なインディケータです。このインディケータは TDシーケンシャルを裁量およびEAで実際に利用してきた私自身の経験から、より手軽に、かつ効果的に活用できるよう作成された裁量トレード用サインツールです。
強いトレンドが生じている際に多くのだましが生じるのはTDシーケンシャルの弱点と思われますが、これを克服するために強力なフィルターを装備しています。また、最も有効と思われるセットアップ9に絞ってサインを発信します。
全通貨ペア、全タイムフレームで利用できます。勝敗判定機能により、このインディケータの直近の相場環境に対する有効性を確認できます。
設定項目は下記のとおりです。 Enable Protect Mode...強いトレンドが発生した際の連敗を回避します Box Filter...下で設定する3つのタイムフレームでの移動平均でパーフェクト・オーダーが発生していない状態をボックス相場と判定し、サインを限定します Moving Average Time Frame1
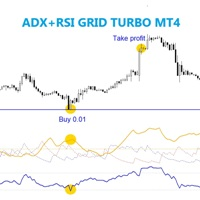
The EA trades on price which over bought and over sold of RSI indicator meanwhile check over limit ADX value level. Best time frame 30 mins, Any pair any broker no limited, recommend minimum deposit 500$
SETTING Symbole - Set symbol to trade. ADX_period - Set ADX period. ADX_value - Set ADX level. RSI_period - Set RSI period. RSI_upper_level - Set RSI high level. RSI_lower_level - Set RSI low level. Bar_history - Set bar to confirm trade. Lots - start lot. Multiple_lots - Multiply lot for n
The indicator measures the buying and selling force between the buyers and sellers in the form of a histogram/oscillator by using a BOP equation:
BOP = Moving Average of [close – open)/(high – low)]
Igor Levshin first introduced the Balance of power in the August 2001 issue of Technical Analysis of Stocks & Commodities magazine.
Features
Quickly find the buying and selling pressure among the traders. It comes with simple inputs and an interface. All Metatrader alerts included.
Appli

KT MACD Alerts is a personal implementation of the standard MACD indicator available in Metatrader. It provides alerts and also draws vertical lines for the below two events: When MACD crosses above the zero line. When MACD crosses below the zero line.
Features It comes with an inbuilt MTF scanner, which shows the MACD direction on every time frame. A perfect choice for traders who speculate the MACD crossovers above/below the zero line. Along with the alerts, it also draws the vertical line

Combining artificial intelligence and human intelligence
This expert is based on the combination of modern and tested strategies of professional traders with artificial intelligence
In this way, we have given the best strategies to the artificial intelligence to learn them and trade exactly based on the same strategies Experts and strategies are constantly evolving and changing
If you want to stay in this market and not fail, you definitely need artificial intelligence
But artificial intelli
Introduction
This indicator marks Pin Bars (bars with an unusually long upper or lower candle wick) on your chart. It will also send alerts when one forms, including via e-mail or push notification to your phone . It's ideal for when you want to be notified of a Pin Bar set-up but don't want to have to sit in front of your chart all day.
You can configure all the settings including: What proportion of the bar should be made up of the wick How big or small the total size of the Pin Bar has

The KT Currency Strength Meter measures the individual currencies' strength and weakness by applying an aggregated mathematical formula over the major FX pairs. The strength is calculated using the bullish and bearish candles over a fixed period. After filling up the strength data, an algorithm sorts out the strongest and weakest currencies in a stack and updates their orders using the real-time incoming data.
Advantages
Improve your trading strategy instantly by filtering out the signals th

An indicator based on candlestick patterns
To catch short-term and long-term trends
If it gives a signal in the direction of the trend, it is long term
And if it gives a signal in the opposite direction of the trend, it is short term
Too many signals
Can be used in all symbols
Can be used in all time frames
Attributes: Too many signals Can be used in all symbols Can be used in all time frames Simple settings Simple and fast usage With author lifetime support
Settings: Candle back: Th
Tick Volume Chart — график тиковых объемов для MetaTrader 4. Утилита создает графики на которых каждая свеча имеет фиксированный тиковый объем. Дискретизация данных осуществляется не по времени, а по тиковому объему. Каждый бар содержит заданный (фиксированный) тиковый объем. Тиковый объем можно регулировать изменяя значение параметра Volume . На полученный график можно прикреплять индикаторы, советники и скрипты. Получается полностью рабочий график, на котором можно работать точно так же, как и

The indicator plots the Up and Down arrows on every price swing made by the classic Zigzag indicator. When Zigzag makes a new swing low, a green arrow is plotted. Likewise, a red arrow is plotted when Zigzag makes a new swing high.
Features
Compared to the classic ZigZag, it marks the swing points more effectively. It helps to identify the forming chart patterns in advance. It comes with a Multi-Timeframe scanner which shows the Zigzag direction on each timeframe. All Metatrader alerts includ

Полностью автоматическая торговая система. Vik Plan B Mini - это укороченная версия советника Vik Plan B, с минимальными настройками. Для входа в сделку использует свечной анализ. Входные параметры: UseDayProfitStop - если сегодня был профит, больше не торгуем FixLot - фиксированный лот StartHour - старт торговли StopHour - стоп торговли UseCloseAllProfit - вкл/откл закрытие всех ордеров по заданому профиту USD_Profit - профит для закрытие всех ордеров UseCloseAllStop - вкл/откл закрытие
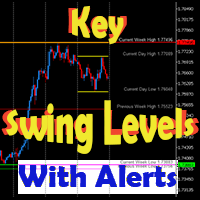
This dynamic indicator will draw the Key Swing High and Low Levels for any symbol on any timeframe!
User may Hide or Show any Level or Label and also Receive Alerts when price returns to that key level via Pop-Up, Push, Email or Sound.
Levels include Current Day High/Low, Previous Day High/Low, Current Week High/Low, Previous Week High/Low and Monthly High/Low.
The Key Levels are labeled with the Price Point Data Listed next to it for quick easy reference.
You can change the Style,

TeconLab Indicator User Guide Overview The TeconLab Indicator is a tool for MetaTrader 4 (MT4) users, fine-tuned to gather price information, including Date, Time, Open, High, Low, Close, and Volume, and update this data in real-time. Uniquely, this indicator autonomously refreshes the CSV file every minute or less, meaning there's no need for manual restarts—just activate it once, and it will continuously collect data as long as MT4 is running. It maintains the latest data according to the size

Вы торгуете внутри дня/недели/месяца, или же вы быстрый скальпер? MCTS покажет вам лучшие валюты в состоянии тренда для торговли на любом таймфрейме. MCTS измеряет силы отдельных валют при помощи уникального алгоритма, а затем объединяет их в пары, чтобы показать вам наилучшие пары для торговли. Контролируйте все 8 основных валют и все 28 пар. Отслеживает силы следующих валют: EUR, USD, GBP, JPY, AUD, NZD, CHF, CAD. Измеряйте истинную силу валюты на любом таймфрейме. Будьте в курсе того, у какой

Trap Play refers to a market situation where price initially makes a new high or low, luring traders into believing a strong trend is forming. However, the price quickly reverses and invalidates the breakout, trapping those traders who entered positions based on the initial move. This sudden reversal often results in a rapid exit of positions, leading to significant price movement in the opposite direction. Trap plays can occur in various financial markets and timeframes and are characterized

Индикатор Candle Patterns отображает на графике популярные свечные модели: внутренний бар, длинные тени (Large Wick), поглощение, марубозу, молот, падающая звезда, три белых солдата и три черные вороны. Свечи раскрашены в разные цвета. Также найденная модель отображается с помощью функции point and click.
Настройки Message box - при клике на свечу найденная модель отображается в специальном блоке на графике. Все настройки 'Message Box' относятся к блоку. Show Inside Bars - при true отображаютс
MetaTrader Маркет предлагает каждому разработчику торговых программ простую и удобную площадку для их продажи.
Мы поможем вам с оформлением и подскажем, как подготовить описание продукта для Маркета. Все продаваемые через Маркет программы защищаются дополнительным шифрованием и могут запускаться только на компьютере покупателя. Незаконное копирование исключено.
Вы упускаете торговые возможности:
- Бесплатные приложения для трейдинга
- 8 000+ сигналов для копирования
- Экономические новости для анализа финансовых рынков
Регистрация
Вход
Если у вас нет учетной записи, зарегистрируйтесь
Для авторизации и пользования сайтом MQL5.com необходимо разрешить использование файлов Сookie.
Пожалуйста, включите в вашем браузере данную настройку, иначе вы не сможете авторизоваться.