Смотри обучающее видео по маркету на YouTube
Как купить торгового робота или индикатор
Запусти робота на
виртуальном хостинге
виртуальном хостинге
Протестируй индикатор/робота перед покупкой
Хочешь зарабатывать в Маркете?
Как подать продукт, чтобы его покупали
Технические индикаторы для MetaTrader 4 - 37

White Crow Indicator
by VArmadA A simple yet powerful candle analysis based indicator using the White Soldiers & Crow patterns.
Works with timeframes 1H and higher and tested on all major pairs. Pay attention to the signal: An arrow indicating a long or short entry.
How It Works:
Arrows indicate a ongoing trend. After multiple bullish or bearish candles in a row the chances for another candle towards that trend is higher.
Instructions: - Crow Count: Set the number of candles that n
FREE
This indicator displays the moment when the MFI oscillator crosses its smoothed value. If the MFI oscillator crosses its smoothed value, it is a signal of a trend change. The signal is given after the end of the formation of the candle. The signal is confirmed when the price crosses the high/low of the bar on which the signal was given. The indicator does not redraw.
Custom Parameters: MFI_Period (>1) - MFI indicator period; MA_Period - period for smoothing MFI indicator values; MA_Method - me
FREE

Concept
Market arranges in Time upcoming Phases according to the present Results of its Interest. Directing Modulations are an Interaction of immanent Periods, which show in Reference to Time cyclic Activity and to Price leveling Activity. SensorMap is a reflecting Volume Mask of this Concept of Time and Price and apportioning developed Price Movements in an equalized 100 % - Range: how far moved ? indicating their Status by marking special Events: when which Action ? setting the Situation in
FREE

Данный индикатор представляет собой отображение элементов торговой системы, описанной Александром Элдером. Индикатор использует идею открытия сделок на продажу в момент падения значений MACD или OsMA ниже нуля или наоборот, открытие сделок на покупку в момент роста значений таких индикаторов выше нуля, при совпадении такого падения или роста с направлением скользящей средней. Толстая и тонкая цветные гистограммы соответствуют значениям MACD и OsMA. Если гистограмма больше 0, значение индикатора
FREE

Это еще одна версия непараметрического зигзага. Его ребра идут вверх до тех пор, пока не встретится бар, максимум (high) которого ниже самого выского минимума (low) в этом ребре, а ребра вниз продолжаются до тех пор, пока не встретится бар, минимум (low) которого расположен выше самого низкого максимума (high) в этом ребре. В дополнение к самому зигзагу (отображаемому оранжевым цветом), индикатор выводит сигнальные метки на тех барах, где зигзаг меняет направление. Синяя стрелка вверх означает,
FREE
This indicator uses a formula based on bollinger bands to determine if the market is in Range or not. It can be used to filter entries and not operate in a sideways market.
It has a minimum value of 0.2 from which it could be operated, although you can modify it in the options to adjust it to your trading style or the market you use.
If the histogram below is red, the market is in range, if it is green, volatility is higher.
FREE

21 simple moving average ( All Type of 21 MA River ) 51 simple moving average
Long Entry Upper 51 MA and above the 21 River Middle channel. Long Only Above Green Line (Market Opening Line) Short entry Below the lower 51 MA and below the 21 lower channel. Short Only Below Green Line (Market Opening Line)
Exit position
Initial stop loss is 20 pips below (for buy) or above (for sell) Target : Next level as per indicator Profit Target ratio 1:1.2
Download Template : https://drive.google.c
FREE
Целью этой новой версии стандартного MT4 индикатора, входящего в поставку платформы, является отображение в подокне нескольких таймфреймах одного и того же индикатора. См. пример, приведенный на рисунке ниже. Однако индикатор отражается не как простой индикатор MTF. Это реальное отображение индикатора на его таймфрейме. Доступные настройки в индикаторе FFx: Выбор таймфрейма для отображения (от M1 до MN) Установка ширины (количество баров) для каждого окна таймфрейма Всплывающее оповещение/звуков
FREE

Description This scanner uses 3LZZ TRO ex4 and scans for Semafors at given “Shift” bar.
Scanner Detailed Settings: https://www.mql5.com/en/blogs/post/747456
Other Settings: Set Periods for Semafor 1,2,3 Set alerts on/off for Semafor 1,2,3 Shift bar (Bar on which semafor is scanned) Refresh After Ticks (Number of ticks when dash is refreshed) This scanner is pretty simplistic version. And a more detailed version with a different strategy is available here: https://www.mql5.com/en/market/produ
FREE

HJZHI88888888888888888888888888888888888888888888888888888888888888888888888888888888888888888888888888888888888888888888888888888888888888888888888888888888888888888888888888888888888888888888888888888888888888888888888888888888888888888888888888888888888888888888888888888888888888888888888888888888888888888888888888888888888888888888888888888888888888888888888888888888888
FREE

It's a simple indicator based on Moving Average. It's still a beta version. Good for a Day trader to identify market movement. No Repaint but It doesn't mean that all signals should be a win. There are no trading rules which you can gain 100%. You have to accept the losses.
Recommendations: 5 or 15 Min Any Pair Try to switch the timeframe 5 or 15 to find out best TF for your pair. Tips - Don't forget to set SL and TP. Thank you.
FREE

The currency strength momentum has a lot of similarities with currency strength meter presented in the previous page, but the difference are much more pronounced. You can try putting both in the same chart and see the difference in results. Currency strength momentum measures strength of a currency based on (you guess it) it's momentum relative to other currencies, while currency strength meter measures the strength of a currency based on pips it has moved in a certain direction.
FREE
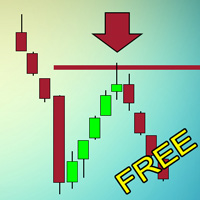
Индикатор, который ищет качественные точки входа в рынок и отображает их в виде стрелок. Действует по сложному алгоритму. Сначала ищет на графике специальные уровни, которые обязательно должны быть пробиты импульсом. Если цена возвращается к этому уровню в виде свечи с длинной тенью и маленьким телом и касается уровня только тенью - возникает точка входа. Не перерисовывается! Лучше всего выглядит и отрабатывает на Н1.
Может использоваться как: Индикатор уровней, где цена будет останавлива
FREE

Мультивалютный, Мультитаймфреймовый индикатор, позволяющий увидеть тренд основанный на пересечении 2 EMA без дополнительных кликов, он ищет последнее пересечение на всех таймфреймах сразу и пишет в левом верхнем углу в какую сторону направлен тренд открытой валютной пары, а также как давно было последнее пересечение. На основе этого индикатора вы можете открывать ордера если все большинство трендов направлены в 1 сторону и выходить из сделок когда ситуация меняется. Индикатор не рисует на график
FREE
Представленный индикатор является авторской реализацией идеи заложенной в уже ставшим классическим индикатор - Alligator. Предлагаемый продукт позволяет наглядно продемонстрировать направление движения цены, временные откаты цены и зоны разнонаправленного движения цены. А именно: Линии индикатора идут вверх и расходятся друг от друга - сильный бычий тренд; Линии индикатора идут вниз и расходятся друг от друга - сильный медвежий тренд; Линии индикатора идут вверх но сходятся вместе - ослабленный
FREE

Индикатор отображает на графике карту на которой маркерам отображается текущая торговая сессия, а так же отображается в текстовом виде. В индикаторе имеются два вида фонового отображения белый и черный. Индикатор отображается как фон и не мешает отслеживать текущую ситуацию на рынке.
Параметры: GMT - Разница времени терминала с GMT. Background - Выбор фона черный, белый.
FREE

Индикатор Special Trend Oscillator обнаруживает изменения тренда и измеряет силу текущего тренда. Продукт представляет собой разновидность MACD. Индикатор располагает двумя каналами. Синий канал обозначает верхнюю линию восходящего тренда. Красный - нижнюю линию нисходящего тренда. Покупайте, когда трендовая линия достигает красной линии. Продавайте, когда трендовая линия достигает синей линии.
Параметры Fast_Period - быстрый период. Slow_Period - медленный период. Channels - расстояние между
FREE

Реализация индикатора рыночного цикла описанного Раджи Хорнер в книге "FOREX на 5 часов в неделю: как зарабатывать трейдингом на финансовом рынке в свободное время" . Текущее состояние рынка можно определить посредством анализа угла наклона экспоненциальной скользящей средней (EMA) работающей на периоде 34 бара. Если наклон EMA определяется как направление часовой стрелки на циферблате: от 12 до 2 часов, следует считать, что присутствует восходящая тенденция; от 2 до 4 часов, рынок консолидирует
FREE

Индикатор отмечает на графике, в виде прямоугольника, волатильные участки движения цены согласно заданных настроек.
Описание настроек TrendPips - значение фильтра в пунктах TrendBars - значение фильтра в количестве баров signal_shift - сдвиг относительно текущего бара на указанное количество периодов назад, для сигналов CountBars - количество баров для отображения индикатора Color_1 - один из цветов чередования прямоугольников Color_2 - второй цвет прямоугольников Alerts - отображает диалогово
FREE

Представляю Вашему вниманию индикатор Profi Arrows . Индикатор построен на нестандартных индикаторах Moving Average .Представляет собой сигналы на вход в виде стрелок. Все сигналы образовываются на текущем баре. Максимально упрощен в использовании как для торговли исключительно одним индикатором, так и для использования индикатора в составе Ваших торговых систем. В индикаторе существует 2 режима работы. Вариант с перерисовкой сигнала, и без. В режиме без перерисовке, возможен вариант перерисовк
FREE

Это незаменимый инструмент для каждого трейдера. Индикатор показывает таблицу с наиболее важными основными торговыми сведениями, такими как текущее серверное время, время, оставшееся до конца текущего бара, вычисленный лот для заданного риска и свободной маржи, характерные размеры баров, и спреды. После размещения на графике индикатор создает текстовую метку в правом верхнем углу окна со следующей информацией: -17:50 [70%] 11:42:30 SL:0 SP:17 B:A41/M39/D67 L:0.26/5% время до завершения текущего
FREE

HighLow level Indicators Welcome to our page. here we are introduced here HighLow Level indicator which is the most profitable indicators in our trading life. Recommended Time Frame: M1/M5/H1 Suitable for all currency's This indicator is used to identify the lowest low and highest high level in all currency's to know the trading trends. Trade in the same trend to get the most profit
Happy Trading
FREE
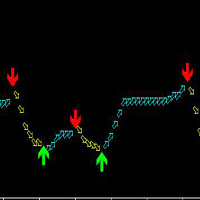
этот показатель подходит для любой сорта MT4, а также для любого цикла, но наиболее подходящим циклом является 30 - е и 4 - х - х, использование проста, стрелы не меняются, не пушки.
принцип этого показателя состоит из АТР - и самодельных MA, а также смешанных расчетов, а также высокой точностью.
покупка: зеленая стрелка вверх по зеленой
продажа: следы красной стрелки
появляются стрелы, которые могут быть сразу же сразу же!
предлагая два цикла, это будет более точным, то ест
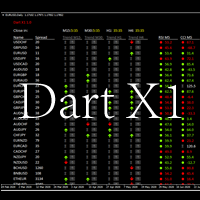
Scanner type indicator, allows you to view information about all the active symbols in metatrader 4. You can see the size of the spread, trend in M5, M15, M30, H1, H4. It also allows to open a chart on the selected symbol and timeframe. Also, you can see the time left to close the current candle.
Finally, you can view the value of the indicators: RSI, CCI and Estocasty. But the green color indicates a possible uptrend and the red color a possible downtrend.
FREE

Набирается блок баров при условии дивергенции . Если условия дивергенции не соблюдаются, блок удаляется. Более точнее, условием является переход блока баров из состояния дивергенции в состояние конвергенции . Блоки формируются выборочно с пропусками. Пропуски характеризуются состоянием конвергенции баров. Перед тем как блок удалится, находятся экстремальные значения баров внутри блока (min, max). Линия соединяет экстремальные бары. Линия прорисовывается только перед тем как блок удалится
FREE
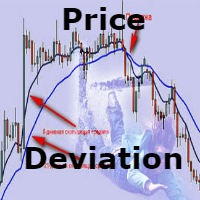
Price Deviation - Индикатор показывает отклонение цены от скользящей средней в процентах. Строиться под графиком в отдельном акне. Максимальное отклонение от скользящей средней позволяет определить перекупленность/перепроданность актива. Если актив перекуплен - рекомендуется продавать, а если перепродан - покупать. По желанию в настройках индикатора можно добавить уровни перекупленности/перепроданности. Желательно использовать на более старших таймфреймах от H4 и выше. Настройки индикатор
FREE

Индикатор предоставляет статистический анализ изменений цен (в пунктах) в отношении к временному периоду (в барах), за который эти изменения произошли. Он рассчитывает полную матрицу статистики для различных временных промежутков и изменений цен, а затем показывает распределение: либо изменений цен для заданного интервала в барах, либо интервалов в барах, потребовавшихся для получения заданного изменения цены. Важно отметить, что индикатор всегда показывает количество раз в истории, когда случил
FREE

Данный индикатор окрашивает свечи в соответствии с прогнозируемым ценовым движением. Анализ производится на основании данных классического ADX. Если линия DMI+ выше линии DMI- свеча окрашивается цветом, сигнализирующем о росте цены; Если линия DMI+ ниже линии DMI- свеча окрашивается цветом, сигнализирующем о падении цены. Индикатор на полностью сформированных свечах не перерисовывается. Свеча которая формируется может менять цвет, в зависимости от текущих данных. Таким образом для принятия решен
FREE

***IMPORTANT: This free indicator works with the paid for Strong Weak Forex Expert Advisor. The EA also depends on the following custom indicators: Strong Weak Parabolic Strong Weak Symbols Strong Weak Values Strong Weak Indicator Download them for free in the Market. The EA will not work without it. These are all custom indicators which the Strong Weak Forex Expert Advisor relies on to generate trading signals. If you have any problems with installation send me a message.
FREE

Pip Show - MultiStrategy Trading The indicator is for free and you have to install it before you can use the Pip Show - MultiStrategy Trading EA. The use of the indicator is very simple, on green open buy positions and on red open sell positions. Its based on a MA calculation. Check out my fully automatic trading robot multistrategy-trading.com It has four parameters: Period, Divisor ("speed"), Price and TimeFrame Period - how many candles , backwards, are calculating Divisor - how "quick" is
FREE

Индикатор отображает скользящие средние на заданном количестве баров ( Count bar for show MA ). Данный способ отображения упрощает анализ, так как график не загромождён лишними линиями. Так же имеется текстовая метка с отображением текущей цены скользящей средней и периода графика. Горячие клавиши служат для упрощения использования индикатора.
Настройки индикатора: Moving average #1 - скользящая средняя #1 Period - период усреднения Mode - метод сглаживания Price - используемая цена для расч
FREE

EMA Separation рисует 2 экспоненциальные скользящие средние, и заполняет пространство между ними. Цвет заполнения выбирается в зависимости от направления тренда: восходящий (EMA с коротким периодом выше EMA с длинным периодом) или нисходящий (EMA с коротким периодом ниже EMA с длинным периодом) Это небольшой инструмент для помощи в визуализации разницы между средними с длинными и короткими периодами. Надеемся, он вам понравится. EMA Separation также можно сочетать с бесплатным инструментом EMA S
FREE

Индикатор вертикальных уровней работающий на таймфреймах М5 и М1. Разлиновывает период текущего дня и дня прошедшего. Данный индикатор наглядно покажет трейдеру, начало и конец часа текущего, также прошедших часовых периодов, тридцати минут и пятиминутных интервалов графика. Преимущество работы с данным индикатором в том, что трейдер, добавив индикатор на график валютной пары с включенным младшим таймфреймом, всегда будет в курсе того, где начнётся новый час.
О понятии времени и таймфрейм
Вс
FREE

Перед вами самый неприхотливый в использовании индикатор, но один из самых полезных. Он оповещает о ближайшем развороте перед растущей волатильностью. Именно волатильность даёт доход трейдеру. Индикатор особенно пригодится тем, кто не хочет ждать нужного момента перед монитором. Индикатор устанавливается на графики М15 и М30. По наблюдениям на этих таймфреймах он лучше всего фиксирует приближение широких ценовых волн. Хорошо зарекомендовал себя на валютной паре USDZAR (Внимание: пара с большим
FREE

FIBO DASHBOARD This dashboard lists down multi currency Fibonacci level whenever price hit the level. It draws a Fibonacci Retracement based on daily time frame. It draws arrows, sends pop-up alert whenever price crosses Fibonacci levels. This tool is useful for users who trade with Fibonacci. For paid version click here .
INPUT ON Alert: set to true will pop-up alert whenever arrow appears. ===== FIBO(High & Low)===== Time Frame: Fibonacci is drawn from daily high to daily low or vise ver
FREE

LOOK AT THE FOLLOWING STRATEGY WITH THIS INDICATOR. Triple RSI is a tool that uses the classic Relative Strength Indicator, but in several timeframes to find market reversals. 1. ️ Idea behind the indicator and its strategy: In Trading, be it Forex or any other asset, the ideal is to keep it simple, the simpler the better . The triple RSI strategy is one of the simple strategies that seek market returns. In our experience, where there is more money to always be won, i
FREE

PLEASE HELP REVIEW/ SUPPORT/ SHARE THIS OTHER INDICATOR HERE https://www.mql5.com/en/market/product/51637 AS YOU DOWNLOAD THIS ONE FOR FREE. THANKS.
This Indicator is based on four moving averages and the PIVOT points. The indicator provides clarity to trading, especially in ranging markets when price is very slow and tight. You can trade intensively daily, every day with this indicator. You may decide to trade with this indicator alone and get the maximum out of the market. The indicator w
FREE
Индикатор осциллятор " AnglerSPeriod " - один из серии трёх вычислителей углового отклонения графика цены торгового инструмента.
ВХОДНЫЕ ПАРАМЕТРЫ: DRAWs =128 - Количество баров для отображения индикатора в историю графика; PeriodIND =14 - Расчётный период индикатора в количестве баров.
Значения показателей индикатора являются градусами . Наличие Сильного Движения цены начинается со значения +-45 градусов, и не может превышать +-90 градусов. Удачных Торговых Исследований!!!
FREE

ATR Accelerator Indicator informs you about strong price movements based on the ATR Indicator. This Indicator works for all Timeframes and Symbols, the strength of movements can be configured.
Important: Get informed about new Products, join our MQL Channel: https://www.mql5.com/en/channels/etradro
Useage This Indicator works for all Timeframes and Symbols, the strength of movements can be configured. Features works on all timeframes and forex pairs or indices. Alert and Notify function
FREE

Стандартный индикатор RSI хороший помощник в определении зон "перекупленности" или "перепроданности" во время флета , но дает много ложных сигналов, когда на рынке тренд. Например: при тренде вверх, стандартный индикатор часто заходит в зону "перепроданности" и крайне редко (чаще всего когда тренд уже заканчивается) заходит в зону " перекупленности". Данный индикатор учитывает трендовое движение и при подобранных настройках может заходить в зону противоположной направлению тренда, давая сигнал
FREE
Sure, here's the introduction for the "Enhanced Volume" indicator designed for MetaTrader 4 (MT4):
--- ## "Enhanced Volume" Indicator for MetaTrader 4 (MT4)
Greetings MT4 Traders!
The "Enhanced Volume" indicator is a powerful tool designed to help you track and analyze trading volume alongside signals of changing market trends.
### Key Features:
1. **Separate Window Display:** The "Enhanced Volume" indicator can be displayed on a separate window, making it easy to observe and analyze
FREE

Trend indicator derived from T3 moving averages. The cloud is bounded by a fast T3 and slow T3 lines. Buying/Selling opportunities above/below cloud. The fast and slow T3 MA lines can also be used as dynamic support/resistance for more aggressive entries. Use default values for best settings. The number of look back bars is user defined. This indicator can be used in combination with other strategies such as price action. Suitable for all time frames. Prerequisites: T3IndiSlow and T3IndiFast in
FREE
Search for an entry with low risk for trading by Lisek Moving Average Indicator. There are many ways to trade with Lisek Moving Average Indicator: Trend continuation (Trend trading). Trade pullbacks (Range trading). Trade breakouts. Trade reversals. Take profits or set stop-loss based on your MA.
Moving Averages are a frequently used technical indicator in forex trading, especially over 10, 50, 100, and 200 periods. Moving Averages are lagging indicators, which means they don't predict where
FREE

Indicator overview Trend indicator usage Moving averages. Highest quality alerts that need no introduction. It is completely loyal to the original algorithm and uses other useful features.
Easy to trade Carry out all kinds of notifications It's not a new paint and it's not a back paint. Setting Indicator WMA50 in Time frame H1 for any pair currency and Gold Spot. EMA200 in Time frame H1 for any pair currency and more than EMA250 for Gold spot. Using it for maximum benefit Set up notificatio
FREE

This indicator draws on the chart high and low prices of different periods . And If you want, Indicator can alert you when the current price arrive these levels. Alert Options: Send Mobil Message, Send E-mail, Show Message, Sound Alert Time Periods: M1, M5, M15, M30, H1, H4, D1, W1, MN Inputs: TimeShift: You can set start hour for calculating. And that way you can see levels independently from broker server's time-zone. PipDeviation: You can set price sensibility for alert (Default: 3) Lines
FREE
This indicator allows to hide Bill Williams Fractals (on all MT4 timeframes) from a date define by the user with a vertical line (Alone) or a panel (with "Hidden Candles"). Indicator Inputs: Indicator Color Indicator Width Information on "Fractals" indicator is available here: https://www.metatrader4.com/en/trading-platform/help/analytics/tech_indicators/fractals ************************************************************* Hey traders!! Give me your feeds! We are a community here and we hav
FREE
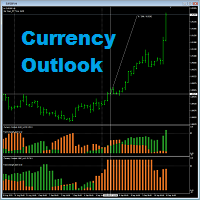
Currency Outlook is an indicator that can help us "Trade the right pair in the right direction and at the right time". This indicator analyzes prices of all cross currency pairs of the selected currency and report the result to us in form of double colours histogram diagram. The maximum height of the histogram diagram of the indicator is 100. The indicator is exclusively programming for AUD, CAD, CHF, EUR, GBP, JPY, NZD and USD. A feature for calculating trade lot size has been added to th
FREE

Данный индикатор включает в себя различные виды скользящих средних. Индикатор содержит в себе следующий набор скользящих средних: CA (Кумулятивная скользящая средняя) MIN (Минимум за период) MAX (Максимум за период) SMA (Простая скользящая средняя) EMA (Экспоненциальные скользящее среднее) DMA (Двойное (двукратное) экспоненциальное скользящее среднее) TMA (Тройное (трёхкратное) экспоненциальное скользящее среднее) LWMA (Взвешенное скользящее среднее) SMM (Простая скользящая медиана) SMMA (Сглаже
FREE

GM Reverse Indicator works on Fibonacci along with some other tweaks
-> It is programmed to automate 100% when the market fluctuates This indicator I use to find support points. It really works and I want to share it with you.
-> Simply attach the GM Reversal Indicator to any chart you want. The larger the timeframe, the better the signal quality (you should use with the timeframe from H4) -> This is my signal : https://www.mql5.com/en/signals/1415444
Please leave me a positive review, if
FREE
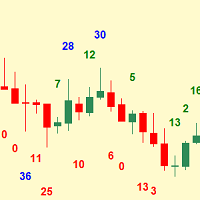
Simplest indicator for bar shadows. Very useful for Kangaroo Tail strategy.
"Shadows" - this is the distance from high and close of the bull bar and low and close of the bear bar. The purpose of the shadow is to show you if the bar is strong or not. Whether it is internal to the trend or is external. It even helps determine if a trend is starting. Input arguments: How many prevoius bars to calculate Value that should be passed to trigger the alarm How many times to repeat the alarm (Put 0 if y
FREE

Lampropeltis — трендовый индикатор. Алгоритм расчета основан на данных стандартных индикаторов, входящих в комплект MT4, и интерпретации паттернов, сформированных этими индикаторами. Настройки содержат минимальный набор параметров: Slow MA - период "медленной" скользящей средней; Slow MA method - способ сглаживания "медленной" скользящей средней; Fast MA period - период "быстрой" скользящей средней; Fast MA method - способ сглаживания "быстрой" скользящей средней. Смена цвета сигнала на красный
FREE

HighLow Arrow Indicator HighLow Arrow is a simple indicator to be used to signal major lows and major highs in your chart.
This indicator is not intended to be used to trade alone but more as an alert that a turning point might be forming.
In this case the HighLow Arrow indicator signals that a new high or a new low is forming and that traders can prepare for seeking new signals.
The formation of the High or the Low is confirmed after 2 bars have been closed. In the meantime, the alert ca

OBOS indicator OBOS Indicator is an exclusive indicator to spot entries based on price action.
The OBOS Indicator is both effective and user friendly.
Indicator uses simple color codes and levels to indicate Overbought and Oversold conditions. No more headache.
The OBOS Indicator will only gives you indication when there are possible entries. Means you only get useful information.
Inputs of the indicator are:
MaxBars : number of bars to display in your chart Smoothing period : number

KT Forex Volume shows the buying and selling volume of a currency pair in the form of a colored histogram. The volume is made of buying and selling transactions in an asset. In FX market: If the buying volume gets bigger than the selling volume, the price of a currency pair would go up. If the selling volume gets bigger than the buying volume, the price of a currency pair would go down.
Features Avoid the bad trades by confirming them using the tick volume data. It helps you to stay on the si

An Implied Fair Value Gap (IFVG) is a three candles imbalance formation conceptualized by ICT that is based on detecting a larger candle body & then measuring the average between the two adjacent candle shadows.
This indicator automatically detects this imbalance formation on your charts and can be extended by a user set number of bars.
The IFVG average can also be extended until a new respective IFVG is detected, serving as a support/resistance line.
Alerts for the detection of bull

Binary Options Assistant (BOA) ICE Signals Indicator provides signals based on gkNextLevel Binary Options Strategy. Indicators: 2 Bollinger Bands & Stochastic
Stop missing trades, stop jumping from chart to chart looking for trade set-ups and get all the signals on 1 chart! U se any of the BOA Signals Indicator with the Binary Options Assistant (BOA) Multi Currency Dashboard .
All BOA Signal Indicator settings are adjustable to give you more strategy combinations. The signals can be
FREE

A BB indicator with MA options
You're no longer limited to the built in default of using BB off a SMA method, now you can choose from SMA-EMA-SMMA-LWMA. You now also have up to 3 standard deviation levels, with price labels.
Options: - MTF - moving average type SMA-EMA-SMMA-LWMA - 3 adjustable deviation levels
- separate coloring to lines and texts
Troubleshooting: - If there are any issues or suggestions for the indicator, please comment and let me know. The feedback will be noted and c
FREE

Market Dashboard FREE Indicator gives you advanced information’s about your selected Symbols in MarketWatch
Features
Daily Price Movements (M1 – D1) RSI Values with Highlight Function for your current Timeframe & H1 & H4 Profit per Symbol and traded lots (buy & sell) EMA 5 – 100 based on selected period Swap Information (which direction is positive) FIBO Info & Tracking (highlighted FIBO Levels close to current price – based on selected period) One Click ChartOpen this Version is limited to
FREE
Данный индикатор является одним из вариантов технического индикатора MACD. Индикатор представляет собой разность двух скользящих средних с разным периодом сглаживания. Каждая скользящая средняя дополнительно сглаживается адаптивным цифровым фильтром. В упрощенном понимании адаптивный цифровой фильтр - скользящая средняя с эффективным сглаживанием. Использование цифрового фильтра позволяет сгладить резкие колебания с минимальным запаздыванием сигнала.
Использование индикатора: Следует принимать
FREE
Данный индикатор отображает на графике цены свечи построенные по данным скользящих средних. То есть, в качестве цены открытия выступает цена открытия скользящей средней, в качестве цены закрытия выступает цена закрытия скользящей средней и так далее. Подобный подход позволяет визуализировать усредненные изменения цены, исключить "шум" и получить более пригодную для оценки и принятия решений картинку. Индикатор не перерисовывается на полностью сформированных барах. В то же время индикатор может и
FREE

Mega Alert Level: Простой, но ценный индикатор Этот помощник предоставляет звуковые, информационные, push и email уведомления по вашему выбору, когда цена валютной пары касается или приближается к стандартным уровням поддержки и сопротивления или к любым другим объектам на графике, которые вы выбираете. Индикатор крепится к горизонтальным линиям поддержки и сопротивления или к любым другим объектам на графике, которые вы выбираете, нанесенным на график с использованием стандартных инструментов
FREE

This classic "old school" MAGIC MACD indicator gives you the cross of the parameters you set. Standart setting is (12,26,9) . The arrows give you a possible change of trend. Be careful and do not use this indicator as a single signal source.
FREE version Please feel free to check out our other REX indicator series. We do have other free indicators.
"OLD BUT GOLD"
FREE

Индикатор идентифицирует текущий тренд, используя как алгоритм следующее определение: Тренд - ситуация, когда каждый последующий максимальный подъем цены выше/ниже предыдущего, и аналогично каждый последующий максимальный спад выше/ниже предыдущего. Началом нового тренда считается преодоление текущим максимумом/минимумом всех максимумов/минимумов заданного количества предыдущих баров. Индикатор окрашивает бары в соответствии с идентифицированным трендом. Индикатор не перерисовывается.
Настройк
FREE
Angle of Price It is a trend following indicator. The idea behind this indicator is very simple. it calculates the angle of certain price type with its N candle back price type. When the price is moving toward upward direction positive angle histograms will be created and vice versa for downward direction. There are couple of price type supported in this indicator. Which is as follows Close Open High Low Median Typical Weighted When combined with other indicators it could be used as a very power
FREE

---> Check all the other products <---
The Multi Time Frame Chandelier Channel is a good synthesis of the chandelier trailing stop and let you analyze the trend.
Enter when the price breaks one of the two lines, then trail using the opposite line. Ideal for scalping, entering after the dot appears.
Plenty of customization: Choose the lookback period, the longer, the slower Choose the Time Frame to use (must be greater or equal your chart TF Play around with the options to get the
FREE

This indicator is designed to find the difference in MOMENTUM price and indicator. This indicator shows the price and indicator difference on the screen. The user is alerted with the alert sending feature. Our Popular Products Super Oscillator HC Cross Signal Super Cross Trend Strong Trend Super Signal Parameters divergenceDepth - Depth of 2nd ref. point search Momentum_Period - Second calculation period indAppliedPrice - Applied price of indicator indMAMethod - MA calculation method findEx
FREE

提供专业的EA编程服务,推出特色仪表盘EA编程,将您的交易策略自动化,可视化,一个图表管理多个交易货币对,详情查看: http://www.ex4gzs.com Providing quick Developments and Conversion of MT4/MT5 EAs, Indicators, Scripts, and Tools. If you are looking for an Dashboard EA to turn your trading strategy into auto trading algo and to manage multi trades in one chart with visualizing tool, come and visit http://www.ex4gzs.com/en for more details. 如果产品有任何问题或者您需要在此产品上添加功能,请联系我 Contact/message me if you encounter any issue using the product or need extra feat
Представленный индикатор это совместное применение цифрового фильтра FATL и фильтра Элерса (J. F. Ehlers). Данный индикатор подает надежные сигналы с малым запаздыванием, что делает торговлю на его основе весьма эффективной. После получения сигнала следует дождаться его подтверждения - преодоления ценой максимума/минимума бара на котором сигнал был подан.
Рекомендуется обращать внимание на сигналы дивергенции или конвергенции (несоответствие соотношения новых максимумов или минимумов на график
FREE
Switch symbols and timeframe by arrow buttons 1. You can switch multiple symbols of one or all charts. 2. You can set list of symbols to switch between them or get them from Market Watch. 3. You can change timeframe of one or all charts. List of timeframes here [M1, M5, M15, M30, H1, H4, D1, W1, MN1]. Switch symbol of all charts: indicator check current symbol of the chart to get index of it in list and change for next or previous. Key functions: - Right arrow key: switch to next symbol. - Left
FREE

This indicator provides trading signals based on the polarity of the dynamical parameters of two digital signals. The dynamical parameters (momentum-acceleration) are derived by applying a high quality momentum oscillator, MTEMA LPD ( see Top Gun Oscillators ) to two digital signals. The MTEMA momentum oscillator is first applied to the price itself. Then, a rectification procedure is applied to the price based on the signals from the momentum oscillator yielding a rectified price signal. This s
FREE
MetaTrader Маркет - торговые роботы и технические индикаторы для трейдеров, доступные прямо в терминале.
Платежная система MQL5.community разработана для сервисов платформы MetaTrader и автоматически доступна всем зарегистрированным пользователям сайта MQL5.com. Ввод и вывод денежных средств возможен с помощью WebMoney, PayPal и банковских карт.
Вы упускаете торговые возможности:
- Бесплатные приложения для трейдинга
- 8 000+ сигналов для копирования
- Экономические новости для анализа финансовых рынков
Регистрация
Вход
Если у вас нет учетной записи, зарегистрируйтесь
Для авторизации и пользования сайтом MQL5.com необходимо разрешить использование файлов Сookie.
Пожалуйста, включите в вашем браузере данную настройку, иначе вы не сможете авторизоваться.