Please speak up )))) Started in the EURUSD discussion thread ))))
Anyway, here is the idea. There are OHLC values for each bar. We take and add all numbers that are included in these quotes and obtain some new (integer) dimension of market movement. The code in MQL looks like this:
On these values you can build an indicator and analyze values for samples of different periods
This is what we have got so far:
Anyway, this is the idea. For each bar there are OHLC values. We take and add up all numbers included in these quotes and get some new (integer) measurement of market movement.
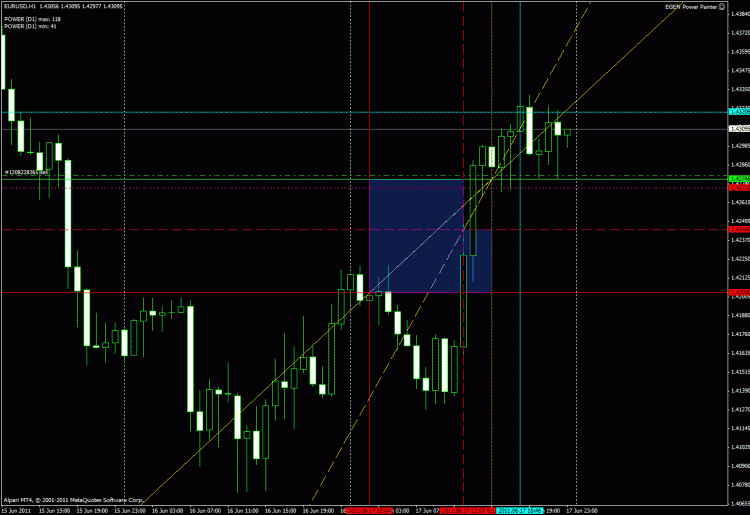
Latest version of the script )))) Unnecessary Fibo levels removed )))) Added drawing of a market entry point calculated by the average energy value for the D1 zone. Blue vertical and horizontal. According to the Jews we get the next (last) sell signal for H1:
I finally understand what you have done - you are getting some kind of weighted average bar price, and according to you you are using different TFs, in fact your method is to trade on MAs on different TFs or MAs with different periods, imho - trading on MAs is not unreasonable
What MAs? ))) Look at the code. )))) Its all based on discrete impulses only. And the value we get is, excuse me, not the price.) The price cannot be 118 and immediately 41 on the next bar)))
Apart from the + sign, aren't there any other possibilities? Isn't it too straightforward?
The code is open )))) Put a minus and go ahead if you're interested ))))
The code is open )))) Put minus and go ahead, if interested ))))
The subject of impulses has been of interest to me for a long time.
But it's your interpretation that I'm still trying to grasp.
Plus and Minus is also clearly poor for analysis))))
Please speak up )))) Started in the EURUSD discussion thread ))))
Anyway, here is the idea. There are OHLC values for each bar. We take and add all numbers that are included in these quotes and obtain some new (integer) dimension of market movement. The code in MQL looks like this:
On these values you can build an indicator and analyze values for samples of different periods
This is what we have got so far:
As far as I understand, if price = 1.43081 in the expression price = 1 * 10 ^ 0 + 4*10^ -1 + ...1 * 10 ^ - Digits, you simply add the digits included in the given quote without taking the weighting factors into account. Of course, it is interesting, but it is unclear how the sum obtained in such a way may serve as a price characteristic, when the 9 in the low-order digit gives the sum 9 times more than the 1 in the highorder digit. This seems to be in the realm of numerology. If your indicator works successfully, then the laws of numerology exist and work:)))
What mushrooms? ))) Look at the code. Everything is based solely on discrete pulses )))) And the value we get is, excuse me, not the price)))). The price cannot be 118 and immediately 41 on the next bar)))
Latest version of the script )))) Unnecessary Fibo levels removed )))) Added drawing of a market entry point calculated by the average energy value for the D1 zone. Blue vertical and horizontal. According to the euras the next (last) sell signal for H1 has been obtained:
Explain why the blue vertical and horizontal lines are pointing to a SELL?
Why exactly sell and not buy?
And another question.
Why are you selling well below those lines and where are the TP and SL in this system?
- Free trading apps
- Over 8,000 signals for copying
- Economic news for exploring financial markets
You agree to website policy and terms of use

Please speak up )))) Started in the EURUSD discussion thread ))))
Anyway, here is the idea. There are OHLC values for each bar. We take and add all numbers that are included in these quotes and obtain some new (integer) dimension of market movement. The code in MQL looks like this:
On these values you can build an indicator and analyze values for samples of different periods
This is what we have got so far: