3 Methods of Indicators Acceleration by the Example of the Linear Regression
ds2 | 4 August, 2011
Calculations Speed
Fast calculation of the indicators is a vitally important task. Calculations can be accelerated by different methods. There are plenty of articles concerning this issue.
And now we are going to examine 3 more methods to accelerate calculations and sometimes even to simplify a code itself. All described methods are algorithmic ones, i.e. we won't decrease the history depth or enable processor unit's additional cores. We are going to optimize computational algorithms directly.
Basic Indicator
The indicator which is to be used for display of all 3 methods is a linear regression indicator. It creates regression function at each bar (according to the defined number of the last bars) and shows what value should it have at that bar. As a result, we have a solid line:
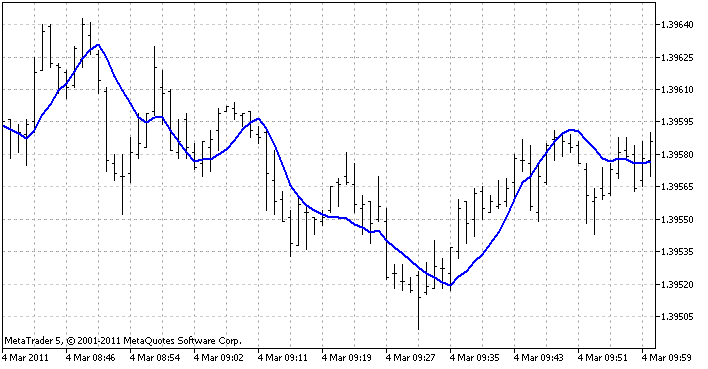
This is how the indicator looks in the terminal
Linear regression equation looks as follows:
![]()
In our case x is a number of bars and y are prices.
The ratios of the mentioned equation are calculated as follows:
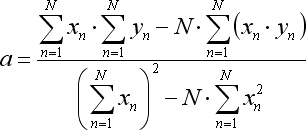

where N is a number of the bars that are used to form the regression line.
This is how these equations look in MQL5 (inside of the all history bars cycle):
            // Finding intermediate values-sums
            Sx  = 0;
            Sy  = 0;
            Sxx = 0;
            Sxy = 0;
            for (int x = 1; x <= LRPeriod; x++)
              {
               double y = price[bar-LRPeriod+x];
               Sx  += x;
               Sy  += y;
               Sxx += x*x;
               Sxy += x*y;
              }

            // Regression ratios
            double a = (LRPeriod * Sxy - Sx * Sy) / (LRPeriod * Sxx - Sx * Sx);
            double b = (Sy - a * Sx) / LRPeriod;

            lrvalue = a*LRPeriod + b;
The full code of the indicator is attached to the article. It also contains all the methods described in the present article. Therefore, "Standard" calculation method must be selected in the indicator settings:
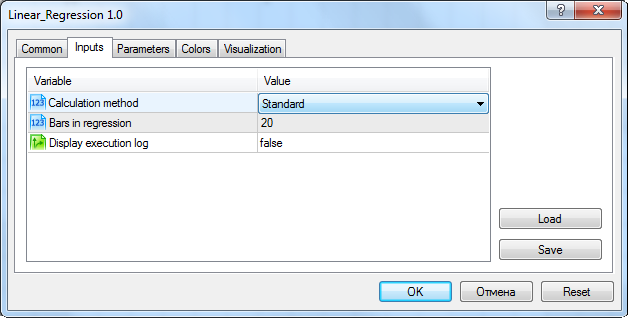
Indicator input parameters setting window when it is set on the chart
First Optimization Method. Moving Totals
There is a huge amount of indicators in which a total figure of some bars sequence values is calculated at each of them. And this sequence constantly shifts at each bar. The most well-known example is Moving Average (MA). It calculates a sum of N last bars and then this value is divided by their number.
I think, quite a small amount of people know that there is an elegant way to accelerate calculation of such moving totals considerably. I have been using this method in my indicators for quite a long time already, when I found out that t is also used in MetaTrader 4 and 5 regular MA-indicators. (It is not the first case already when I find MetaTrader indicators to be properly optimized by the developers. A long time ago I was looking for fast ZigZag indicators and a regular indicator proved to be more effective than most of the external ones. By the way, mentioned forum topic also contains ZigZag optimization methods, just in case someone needs them).
And now we'll get back to moving totals. Let's compare the totals calculated for two adjacent bars. The figure below demonstrates that these totals have considerable common part (shown in green). The total calculated for the bar 0 differs from the total for the bar 1 only by the fact that the total does not include one outdated bar (red one to the left) but includes one new bar (blue one to the right):

Excluded and included values in the total during a one bar shift
Therefore, there is no need to to sum up all necessary bars all over again while calculating a total for the bar 0. We can only take a sum from the bar 1, deduct one value and add a new one to it. Only two arithmetic operations are required. Using such a method we can accelerate indicator calculation considerably.
In Moving Average such method is used routinely, as the indicator keeps all average values in its only buffer. And that is nothing else but the totals divided by N, i.e. the number of bars included in the total. Multiplying a value from the buffer back by N, we can get a total for any bar easily and apply the method described above.
Now I'll show you how to apply this method in the more complicated indicator – linear regression. You've seen already that equations for calculation of regression functions ratios contain four totals: x, y, x*x, x*y. Calculation of that totals must be buffered. The buffers for each total in the indicator must be assigned to achieve this:
double ExtBufSx[], ExtBufSy[], ExtBufSxx[], ExtBufSxy[]; The buffer may not be necessarily seen on a chart. MetaTrader 5 has a special buffer type – for intermediate calculations. We will use it to assign buffer numbers in OnInit:
   SetIndexBuffer(1, ExtBufSx,  INDICATOR_CALCULATIONS);
   SetIndexBuffer(2, ExtBufSy,  INDICATOR_CALCULATIONS);
   SetIndexBuffer(3, ExtBufSxx, INDICATOR_CALCULATIONS);
   SetIndexBuffer(4, ExtBufSxy, INDICATOR_CALCULATIONS);
Standard linear regression calculation code will change for the following now:
            // (The very first bar was calculated using the standard method)

            // Previous bar
            int prevbar = bar-1;

            //--- Calculating new values of intermediate totals
            //    from the previous bar values

            Sx  = ExtBufSx [prevbar];

            // An old price comes out, a new one comes in
            Sy  = ExtBufSy [prevbar] - price[bar-LRPeriod] + price[bar];

            Sxx = ExtBufSxx[prevbar];

            // All the old prices come out once, a new one comes in with an appropriate weight
            Sxy = ExtBufSxy[prevbar] - ExtBufSy[prevbar] + price[bar]*LRPeriod;

            //---

            // Regression ratios (calculated the same way as in the standard method)
            double a = (LRPeriod * Sxy - Sx * Sy) / (LRPeriod * Sxx - Sx * Sx);
            double b = (Sy - a * Sx) / LRPeriod;

            lrvalue = a*LRPeriod + b;
The full code of the indicator is attached to the article. "Moving Totals" calculation method must be set in the indicator settings.
The Second Method. Simplification
This method will be appreciated by Math fans. In complicated equations the fragments can often be found that appear to be the right parts of some other known equations. That gives possibiliy to replace that fragments with their left parts (which usually consist of only one variable). In other words, we can simplify a complicated equation. And it may appear to be that some elements of this simplified equation are already realized as indicators. In that case indicator's code containing that equation may be considerably simplified in its turn.
As a result, we have at least more space-effective and simple code. And in some cases it can also be faster, in case the indicators implemented in the code are well speed-optimized.
It appears to be that the linear regression equation can also be simplified and its calculation can be replaced with initialization of several MetaTrader 5 standard indicators. Many of its elements are calculated in the Moving Average indicator in its different calculation modes:
- the sum y is present in Simple Moving Average:

- the sum x*y is present in Linear Weighted Moving Average:
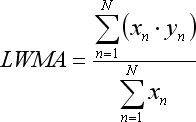
Note that the equation for LWMA is true only in case we enumerate the bars taking part in the regression from 1 to N in an ascending manner from the past to the future:

The way to conventionally enumerate the bars for regression to use LWMA indicator
Therefore, the same enumeration must be used in all other equations.
Let's proceed with the method:
- x total is nothing else than (1 + 2 + ... + N) number series total that may be replaced with the following equation:

- x*x total is simplified according to another equation:

- to build an indicator chart we need to calculate the meaning of regression function only for its last bar in which x is equal to N. I.e., regression function equation can be replaced with its particular case:
![]()
Therefore, the last five equations allow us to get replacements for all variables in ratios calculations equations a and b and in the regression equation itself. After completing all that replacements we will get a brand new equation for calculation of the regression value. It will consist only of Moving Average indicators values and N figure. After all reductions of its elements we will get an elegant equation:
![]()
This equation replaces all calculations executed in the linear regression basic indicator. It is quite evident that the indicator code with that equation will be much more space-effective. In the chapter "Speed Comparison" we will also find out if the code works faster.
Indicator's specified part:
            double SMA [1];
            double LWMA[1];
            CopyBuffer(h_SMA,  0, rates_total-bar, 1, SMA);
            CopyBuffer(h_LWMA, 0, rates_total-bar, 1, LWMA);

            lrvalue = 3*LWMA[0] - 2*SMA[0];
LWMA and SMA indicators are preliminarily created in OnInit:
      h_SMA  = iMA(NULL, 0, LRPeriod, 0, MODE_SMA,  PRICE_CLOSE);
      h_LWMA = iMA(NULL, 0, LRPeriod, 0, MODE_LWMA, PRICE_CLOSE);
The full code is attached to the article. "Simplification" calculation method must be set in the indicator settings.
Note that in this method we used the indicators that are built in the terminal, i.e. the function iMA with selection of the appropriate smoothing methods was used instead of iCustom. It is an important thing because in theory built-in indicators should work very fast. Some other standard indicators are built in the terminal (they are created by functions having "i" prefix like iMA). While using simplification method, it is much better to simplify equations to that indicators.
The Third Method. Approximating
The idea of this method is that "heavy" indicators used in an expert can be replaced with much more fast ones which calculate needed values approximately. Using this method you can test your strategy faster. After all, prediction accuracy is not so important at the debugging stage.
Also, this method can be used with a working strategy to roughly optimize the parameters. That allows to find effective values areas of the parameters quickly. And then they can be processed by "heavy" indicators for fine adjustment.
Besides, it can appear to be that approximate calculation will be enough to allow a strategy to work properly. In that case a "lightened" indicator can also be used in real trading.
A fast equation can be developed for the linear regression that has effect similar to the regression. For example, we can divide regression bars into two groups, calculate average value for each of them, draw a line through that two average points and define the line's value at the last bar:
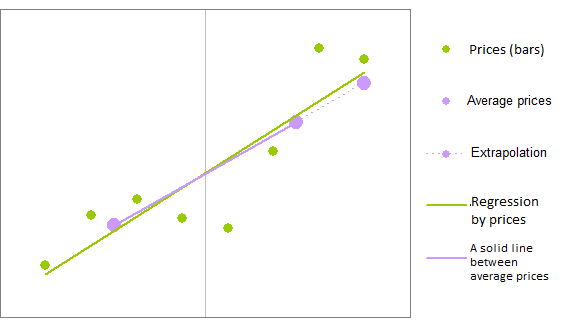
The points were divided into two groups - the left and right ones - and calculations were executed
Such a calculation contains less arithmetic operations than in the regression case. That is the way to accelerate calculations.
           // The interval midpoint
           int HalfPeriod = (int) MathRound(LRPeriod/2);

           // Average price of the first half
           double s1 = 0;
           for (int i = 0; i < HalfPeriod; i++)
              s1 += price[bar-i];
           s1 /= HalfPeriod;

           // Average price of the second half
           double s2 = 0;
           for (int i = HalfPeriod; i < LRPeriod; i++)
              s2 += price[bar-i];
           s2 /= (LRPeriod-HalfPeriod);

           // Price excess by one bar
           double k = (s1-s2)/(LRPeriod/2);

           // Extrapolated price at the last bar
           lrvalue = s1 + k * (HalfPeriod-1)/2;
The full code of the indicator is attached to the article. "Approximating" calculation method must be set in the indicator settings.
Now, let's analyze how close is this approximating to the original. To achieve this we must set indicators with a standard and approximating calculation methods on one chart. We must also add any other indicator that is knowingly weakly similar to the regression. Nevertheless, it should also calculate some trend using past bars. Moving Average will do for that just fine (I used LWMA, not SMA - it is much more similar to the regression chart). By the side of it we can evaluate if we have a good approximation or not. I think, it is good:
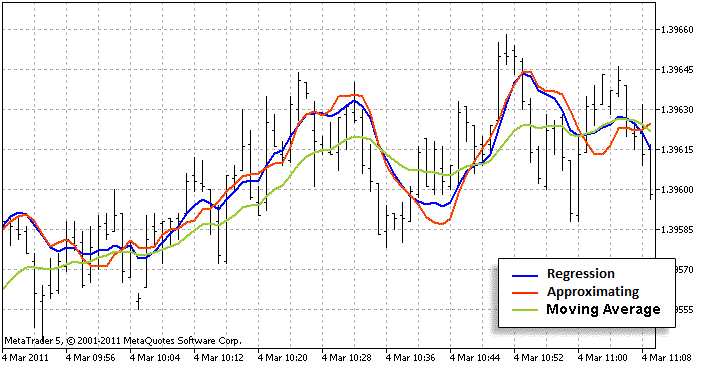
The red line is closer to the blue one than to the green one. It means that approximating algorithm is good
Speed Comparison
Log display can be turned on in the indicator parameters:
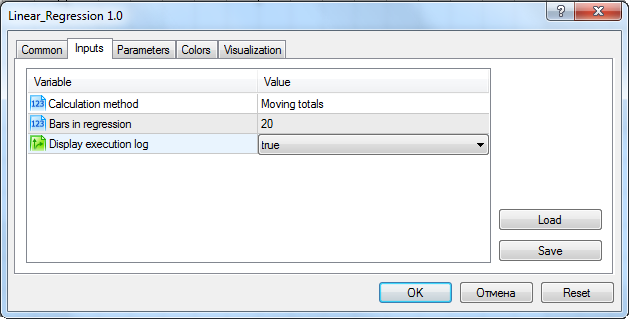
Setting the indicator for the evaluation of an execution speed
In this case the indicator will display all necessary data for speed evaluation in experts messages log: the time of the OnInit() event processing beginning and end of the OnCalculate(). I'll explain, why the speed must be evaluated by this two values. OnInit() agent is executed almost instantly in case of any method and OnCalculate() starts right after OnInit() in case of almost any method. The only exception is a simplification method where SMA and LWMA indicators are created in OnInit(). A delay is present between OnInit() finishing and OnCalculate() commencing in the case (and only in that case!) of the mentioned method:

Execution log displayed by the indicator in the experts journal of the terminal
It means that this delay is caused by the newly created SMA and LWMA which were executing some calculations at that time. Duration of this calculations must also be considered, therefore, we will evaluate all the time "uninterruptedly" - from the regression indicator initialization up to the end of its calculations.
To note the difference between the speeds of different methods more accurately all evaluations are conducted using a huge data array – M1 timeframe with maximally accessible history depth. That is more than 4 million bars. Each method will be evaluated twice: with 20 and 2000 bars in regression.
The results are as follows:
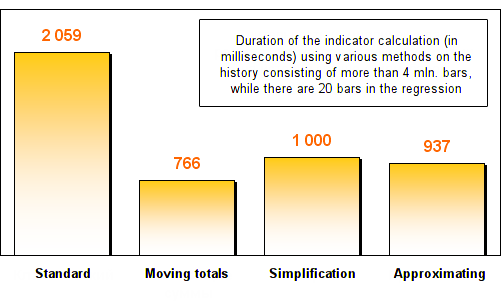
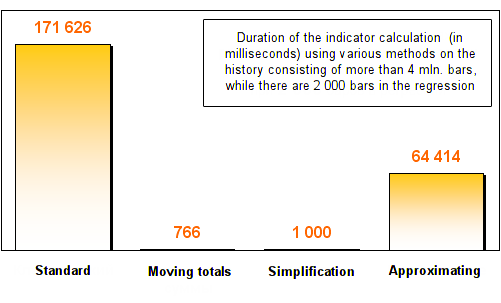
As you can see, all three optimization methods showed at least two-time increase in speed in comparison with the standard regression calculation method. After the increasing of the number of bars in the regression, moving totals and simplification methods showed fantastic velocity. They worked hundreds of times faster than a standard one!
I should note that the time needed for calculation by this two methods remained practically unchanged. This fact can be easily explained: no matter how many bars were used to create a regression, only 2 actions are executed in the moving totals method - an old bar goes out and a new one comes in. There are no any cycles that depend on the regression length. Therefore, even if the regression contains 20000 or 200000 bars, the time of the method execution will increase insignificantly in comparison with 20 bars.
Simplification method uses Moving Average in different modes in its equation. As I have noted already, this indicator can be easily optimized by the moving totals method and it is used by the terminal developers. It is no wonder that the time of the simplification method execution also does not change in case regression length is increased.
Moving totals method proved to be the fastest calculation method in our experiment.
Conclusion
Some traders are just sitting still and waiting for the end of another one procedure of the optimization of the parameters of their trading systems in their testers. But there are also some traders who are trading and making money already at that very time. Calculation speeds obtained by the described methods clearly explain why there is such a difference between this groups of traders. And why it is so important to pay attention to the quality of the trading algorithms.
It does not matter if you write the programs for the terminal for yourselves or order them to third-party programmers (for example, with the help of "Jobs" section). In any case you can get not only working indicators and strategies but also fast working ones, in case you are ready to make some efforts or to spend some money.
If you use any algorithm acceleration method, you get an advantage in speed from tens to hundreds of times in comparison with standard algorithms. It means that you can, for example, optimize your trading strategies' parameters in a tester one hundred times faster. And make it more carefully and frequently. Needless to say, that results in your trading incomes increase.