Смотри обучающее видео по маркету на YouTube
Как купить торгового робота или индикатор
Запусти робота на
виртуальном хостинге
виртуальном хостинге
Протестируй индикатор/робота перед покупкой
Хочешь зарабатывать в Маркете?
Как подать продукт, чтобы его покупали
Технические индикаторы для MetaTrader 4 - 14

Monster Harmonics - индикатор гармонических моделей (harmonic patterns). Он распознает следующие модели: Гартли (Gartley), Летучая мышь (Bat), Краб (Crab), Бабочка (Butterfly), Монограмма (Cypher), Черный лебедь (Black Swan), Белый лебедь (White Swan), Акула (Shark) и AB=CD. Незаконченные модели также распознаются. Monster даже показывает потенциальную зону разворота (Potential Reversal Zone, PRZ). Пользователи могут добавлять свои паттерны. Кроме текущей модели, Monster также показывает все мод

BIG CANDLE ALERT https://www.mql5.com/en/users/earobotkk/seller#products P/S: If you like this indicator, please rate it with 5 stars in the review section, this will increase its popularity so that other users will be benefited from using it. This indicator draws a bullish and bearish vertical line inside a candle whenever the size of a candle body exceeds the minimum size specified in the input. INPUT Bullish Candle Color: choose the color of your choice. Bearish Candle Color: choose the co
FREE

Updates
9/12/2023 - If you are looking for the Spock EA, I don't sell it anymore. DM me for more info.
24/10/2023 - Check out my other products. Starting to roll out some EAs & indicators based on this range.
Currently there is no MT5 version. I am using MT4 myself.
So I will spend my time mostly to develop more extensive stats for the Stats version and maybe even an EA. But I might develop a MT5 version.
All depends on the demand. Meaning, the more people request it, the bigger the
FREE

Trend Arrow Super Индикатор не перерисовывается и не изменяет свои данные.
Профессиональная,но при этом очень простая в применение Форекс система.Индикатор даёт точные BUY\SELL сигналы. Trend Arrow Super очень прост в применение,вам нужно просто прикрепить его на график и следовать простым рекомендация по торговле.
Сигнал на покупку: Стрелка + гистограмма зеленого цвета, входим сразу по рынку на покупку. Сигнал на продажу: Стрелка + Гистограмма красного цвета,входим сразу по рынку на продажу
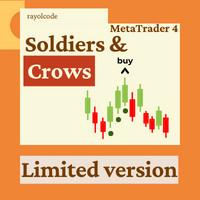
This indicator accurately identifies and informs market reversals and continuation patterns by analyzing and signaling the Three White Soldiers / Three Black Crows pattern. User-friendly interface and multi-asset compatibility Fully customizable parameters and colors Does not repaint Can be easily convert its signals into an Expert Advisor. Full support granted.
FOR MT4 FULL VERSION: CLICK HERE
What is the Three White Soldiers / Three Black Crows price action pattern The Three White Soldi
FREE
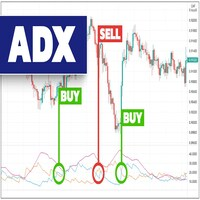
The indicator provides buy and sell signals on the charts every time ADX DI- and DI+ crosses each other. Blue arrow for uptrend (DI+>DI-). Red arrow for downtrend (DI->DI+). This technical analysis tool can be applied to various trading strategies. The ADX Crosses Signals Indicator is based on the Average Directional Index Metatrader Indicator. The ADX is a lagging indicator, meaning that a trend must already be established before the index can generate its signal.
Inputs PERIOD; AlertOn
FREE

Раскройте всю мощь информации о реальных объемах с помощью индикатора Candle Power Pro . Этот динамический инструмент фиксирует фактические данные об объеме для каждой свечи и представляет их в процентах от общего объема. Таким образом, вы сможете увидеть непрекращающуюся борьбу между покупателями и продавцами на рынке. Candle Power Pro отображает битву между покупателями и продавцами в процентах от общего объема, что дает вам ценную информацию о динамике рынка. Вы можете легко подтвердить

Features for software
Main functions: Accurate entry signals WITH NON REPAINTING! Once a signal appears, it remains valid! This is a significant distinction from other indicators that might provide a signal and then alter it, potentially leading to deposit losses. Now, you can enter the market with higher probability and precision. There's also a function to colour candles after an arrow appears until the target (take profit) is reached or a reversal signal appears . Display of STOP LOSS / TA
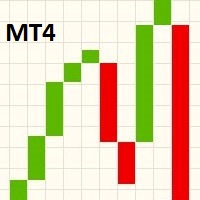
Данный индикатор отображает график линейного прорыва в главном окне графика. Чтобы посмотреть график линейного прорыва отдельно, переключите вид основного графика на показ в виде линии, а затем измените цвет линии на "None" (отсутствует) в свойствах графика, которые открываются нажатием клавиши F8. При скроллинге, увеличении/уменьшении масштаба или изменении символа/таймфрейма графика индикатор изменит размер блоков на следующем тике, чтобы они вписались в область просмотра основного графика. Гр
FREE

Ищете мощный индикатор для торговли на рынке Форекс, который поможет вам с легкостью определить прибыльные торговые возможности? Не ищите ничего, кроме Beast Super Signal. Этот простой в использовании индикатор, основанный на тренде, постоянно отслеживает рыночные условия, ищет новые развивающиеся тренды или отслеживает уже существующие. Beast Super Signal дает сигнал на покупку или продажу, когда все внутренние стратегии совпадают и на 100% совпадают друг с другом, что устраняет необходимость в

This is one of the most popular and highly rated volatility index (VIX) indicators on the market. It provides the same readings as the VIX does for stock indexes. However, this indicator works across all asset classes. VIX Fix Finds Market Bottoms. This indicator is not for inexperienced traders. Use it for day and swing trading. MT5 Version - https://www.mql5.com/en/market/product/112284
Bernard Baruch summed it out best: "Markets fluctuate." The Chicago Board Options Exchange (CBOE) Vola
FREE

Индикатор был создан бывшим сотрудником хедж-фонда, и он разработан для нахождения самых сильных трендов на рынке Форекс. Этот индикатор анализирует скользящие средние по всем 28 парам на 8 таймфреймах. И потом он расставляет каждую пару по силе тренда. Помните: институциональные трейдеры используют скользящие средние больше, чем любой другой индикатор.
Особенности Отображает всю информацию на одном экране. Одновременно отслеживает все 28 пар. Отслеживает 8 последовательных таймфреймов, от M5
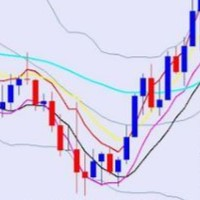
BBMA Terdiri dari indikator BB dan 5 Moving Averages, BBMA Oma Ally (OA) merupakan sistem trading buatan seorang trader asal Malaysia bernama Oma Ally. Setelah melalui penelitian dan pengujian selama bertahun-tahun, beliau membantu banyak trader sejak 2010 dengan sistem ciptaannya ini.
Di kalangan trader Indonesia sendiri, BBMA OA sudah mulai populer sejak beberapa tahun lalu. Saking populernya, sistem trading ini sampai mempunyai komunitas khusus gabungan trader dari beberapa negara.
Men
FREE
Индикатор является мультитаймфреймовой версией индикатора Supply and Demand . Он позволяет анализировать график, используя закон спроса и предложения на трех разных таймфреймах одновременно. Вы сможете увидеть, в каких ценовых зонах происходили покупки и продажи, и определить наиболее выгодные места для открытия позиций. В качестве основы индикатора используется принцип фрактальности рынка. Зоны на графике отображают места, где наличие сильного покупателя либо продавца заставило цену развернутьс

Индикатор Chart Overlay отображает ценовое действие нескольких инструментов на одном и том же графике, позволяя вам оценить, как по-разному колеблются валютные пары относительно друг друга. [ Руководство по установке | Руководство по обновлению | Устранение неполадок | FAQ | Все продукты ]
Легко находите перекупленные или перепроданные валютные пары Нарисуйте до шести валютных пар на одном графике При необходимости отобразите перевернутые символы Адаптировать к размеру графика, масштабирова
FREE
Данный индикатор находит фигуры технического анализа "Двойное дно" и "Двойная вершина", показывает их на графике валютной пары и может сигнализировать, если фигура была сформирована недавно. Эти фигуры являются разворотными, часто после из появления тренд поворачивает обратно или происходит коррекция. Чтобы не искать их самостоятельно, достаточно добавить индикатор на график, после этого, можно изменять разные таймфреймы, чтобы быстро найти такие фигуры на одном из тайфреймов. Имеются некоторые
FREE

Откройте для себя революционный подход к торговле с помощью индикатора Shepherd Numerology Levels. Этот инновационный инструмент сочетает древнюю мудрость нумерологии с передовыми торговыми методами, чтобы помочь вам выявлять ключевые уровни поддержки и сопротивления на ваших графиках. Используя метод Квадрата Девятки, этот индикатор предлагает уникальную перспективу на динамику рынка, позволяя вам принимать более обоснованные решения в торговле. Основные характеристики и преимущества: Нумеролог

Представляем индикатор ON Trade Numerology Mirror: Раскрываем паттерны разворота с помощью нумерологии Откройте новое измерение в техническом анализе с индикатором ON Trade Numerology Mirror. Этот инновационный инструмент использует древнюю мудрость нумерологии для выявления ключевых уровней разворота цены на ваших графиках. Путем перестановки чисел в зеркальном порядке этот индикатор раскрывает скрытые паттерны, которые могут сигнализировать о значительных разворотах цен, предоставляя уникальн

Сложно найти и дефицит по частоте, дивергенции являются одним из самых надежных торговых сценариев. Этот индикатор автоматически находит и сканирует регулярные и скрытые расхождения, используя ваш любимый осциллятор. [ Руководство по установке | Руководство по обновлению | Устранение неполадок | FAQ | Все продукты ]
Легко торговать
Находит регулярные и скрытые расхождения Поддерживает много известных генераторов Реализует торговые сигналы на основе прорывов Отображает подходящие уровни ст

The Turtle Trading Indicator implements the original Dennis Richards and Bill Eckhart trading system, commonly known as The Turtle Trader. This trend following system relies on breakouts of historical highs and lows to take and close trades: it is the complete opposite to the "buy low and sell high" approach. The main rule is "Trade an N-day breakout and take profits when an M-day high or low is breached (N must me above M)". [ Installation Guide | Update Guide | Troubleshooting | FAQ | All Prod
FREE

Ultimate Renko – надежное решение для отображения графиков ренко в MetaTrader 4. Позволяет создавать пользовательские графики в виде медианных ренко ( Median Renko ), средних ренко ( Mean Renko ), турбо ренко ( Turbo Renko ) и лучших свечей ренко ( Better Renko ), а также классических ренко ( Vanilla Renko ) и ренко с тенями ( Renko with wicks ), а также графиков PointO . Это универсальное решение выдает все необходимые сигналы для внутридневных трейдеров, скальперов и даже долгосрочных трейдеро

Линейный график Volume Percentage Line Graph — это индикатор, предназначенный для предоставления информации об объеме данных. Он извлекает информацию об общем объеме для каждой свечи и представляет ее в процентах от общего объема. Индикатор отображает эти данные в виде линий графика в отдельном окне, что позволяет пользователям легко визуализировать битву между покупателями и продавцами. Одной из ключевых особенностей этого индикатора является его способность отображать объем в процентах в в
FREE

PrecisionWedge Detector X
Description: PrecisionWedge Detector X is an innovative indicator designed to identify and analyze wedge patterns on financial charts with unparalleled accuracy and precision. Developed using advanced algorithms, this indicator provides traders with a powerful tool to detect potential trading opportunities based on wedge formations. Key Features: Automatic Wedge Detection: Powered by sophisticated algorithms, PrecisionWedge Detector X automatically scans price data to
FREE

What is Ikoku Kairi Band?
It is an oscillator indicator that combines Kairi Relative Index with Bollinger Band and displays signals with possible position entry points. It is meant to be used to trade against the trend, so it is perfect for scalping in a range market. It shouldn’t be used in a trend market. It will display arrow signals at possible entry points for buy and sell position. You can be notified when they appear with, push, alert or email notifications. You can customise the indica
FREE

Индикатор VR ATR Pro – это мощный профессиональный инструмент для определения целевых уровней на финансовом инструменте. Эффективность индикатора доказана тысячами тестов на реальных и демонстрационных счетах. VR ATR Pro индикатор, работающий на реальных данных с использованием живой настоящей статистики. Статистика вещь упрямая, использование реальных статистических данных в математических подсчетах позволяет рассчитать точные целевые уровни для финансового инструмента. Больше профессиональных

Introducing the Consecutive Green/Red Candle Alert Indicator for MT4 - Your Trend Spotting Companion! Are you ready to take your trading to the next level? We present the Consecutive Green/Red Candle Alert Indicator, a powerful tool designed to help you spot trends and potential reversals with ease. Whether you're a new trader looking for clarity in the market or an experienced pro seeking additional confirmation, this indicator is your trusted companion. Key Features of the Consecutive Green/Re
FREE

Надоело строить трендовые линии? Индикатор PZ TrendLines применяет механический подход к построению трендовых линий за вас! Он может нарисовать до 18 линий По желанию трендовые линии могут основываться на фракталах Каждая линия представляет уровень пробоя Каждая трендовая линия может быть пробита или отклонена Настраиваемое число линий Настраиваемое число цветов
Автор Артуро Лопез Перез, частный инвестор, биржевой спекулянт, программист и основатель Point Zero Trading Solutions.
FREE

Данный индикатор определяет внутренние бары нескольких диапазонов, тем самым упрощая обнаружение и принятие мер по пробою внутреннего бара трейдерам, торгующим по ценовому действию. Прост в понимании и использовании Настраиваемый выбор цвета В индикаторе предусмотрены визуальные/почтовые/push/звуковые уведомления. Индикатор не перерисовывается и не рисует на истории Внутренним называется бар (или серия баров), который полностью находится в пределах диапазона предыдущего бара. Синяя рамка - это б
FREE

This is a unique Gold Indicator On channel trading pullbacks and gives accurate entries on gold and major Fx Pairs on M15tf. It has the ability to pass any prop firm Challenge and get accurate entries on gold and major fx pairs.
EA FOR PROP FIRM AND CHANNEL INDICATOR IS FREE ALONG WITH THIS POWERFUL INDICATOR ALONG WITH THE BEST SET FILE FOR FIRST 25 USERS. Strategy tester report is in comment section. INDICATOR FEATURES: INDICATOR IS BEST ON M15 GIVES ACCURATE ENTRIES EA AND CHANNEL INDICAT

Введение Период низкой волатильности и нетрендового движения на финансовом рынке считается периодом бокового рынка (Sideways Market). Рано или поздно волатильность начинает расти и рынок переходит в трендовую фазу. Период бокового рынка (флет) может служить хорошим временем входа в рынок. Кроме того, боковой рынок часто означает накопление на рынке объемных ордеров крупных инвесторов. Информация о господстве на рынке флета может помочь вам определить хорошие моменты для входа в рынок и выхода из

Order Blocks are supply or demand zones in which big traders can find the comfort of placing large buy and sell orders and completing a big, very big transaction. Order blocks are a unique trading strategy that helps traders find a direction in the market. Usually, it allows traders to find out what financial institutions are planning to do in a particular market and better indicate the next price movement.

Have you ever wanted to be able to catch a trend just as it is beginning? This indicator attempts to find the tops and bottoms of a trend. It uses in-built indicators and studies their reversal patterns. It cannot be used on its own it requires Stochastic(14) to confirm signal. Red for sell, Blue for buy. There are no parameters required just attach to a chart and it is ready to go. Check out other great products from https://www.mql5.com/en/users/augustinekamatu/seller A Winning Trading Stra
FREE

Indicator function Choose to buy and sell according to the system prompts It is best to use 1H for testing About update questions In order to be more suitable for market fluctuations, the company regularly updates the indicators Product cycle and trading time applicable to indicators Applicable mainstream currency pair EUR/USD GBP/USD NZD/USD AUD/USD USD/JPY USD/CAD USD/CHF Applicable mainstream cross currency pair EUR/JPY EUR/GBP EUR/CHF EUR/CAD EUR/NZD AUD/CAD AUD/NZD AUD/CHF AUD/JPY GBP/

Discover the power of precision and efficiency in your trading with the " Super Auto Fibonacci " MT4 indicator. This cutting-edge tool is meticulously designed to enhance your technical analysis, providing you with invaluable insights to make informed trading decisions. Key Features: Automated Fibonacci Analysis: Say goodbye to the hassle of manual Fibonacci retracement and extension drawing. "Super Auto Fibonacci" instantly identifies and plots Fibonacci levels on your MT4 chart, saving you tim
FREE

This Dashboard is free to download but is dependent on you owning the Gold Pro MT4 indicator. Get the indicator here: https://www.mql5.com/en/market/product/60430
The Dashboard will show you on a single chart all the timeframes (M1 to Monthly) with their own status for the indicator: Gold Pro MT4
all time frame and all symbol: smart algorithm detects the trend, filters out market noise and gives entry signals!!!
How to understand the status: Dashboard Show "Buy" - Buy Signa
FREE

The Candle Countdown Timer for MetaTrader 4 (also available for MT5) is a vital indicator designed to help you manage your trading time effectively. It keeps you updated about market open and close times by displaying the remaining time before the current candle closes and a new one forms. This powerful tool enables you to make well-informed trading decisions. Key Features: Asia Range: Comes with an option to extend the range. Broker Time, New York, London Time: Displays the current broker time
FREE

Индикатор отображает в виде стрелок пересечение индикатора Скользящая Средняя Осциллятора (Moving Average of Oscillator, OsMA) нулевого уровня. Индикатор является мультитаймфреймовым и отображает сигналы с других временных интервалов В индикаторе есть уведомление при появлении сигнала - всплывающее окно (Alert), отправка на EMail.
Параметры Time-frame - Выбор временного интервала для отображения сигналов индикатора. Fast EMA Period - Быстрое EMA – скользящая средняя от цены, экспоненциального
FREE

Индикатор рисует шкалу времени на чарте. Вы можете указать смещение времени, настроить размер и шрифт для отображения на графике. Также вы можете выбрать желаемый формат отображения даты и времени. При зажатой средней кнопке мышки, и движении курсора, будет появляться ползунок на шкале. Параметры
Hours (time shift) — сдвиг времени (часы); Minutes (time shift) — сдвиг времени (минуты); Show time on mouse — показывать время под указателем; Precise time scale — рассчитывать время между барами
FREE

Индикатор позволяет отобразить на экране уменьшенные графики любой валютной пары любого таймфрейма. Максимальное количество отображаемых графиков 28. Графики можно размещать как в основном окне, так и в "подвале". Два режима отображения: свечи и бары. Количество отображаемых данных (баров и свеч) и размеры графиков регулируются. Параметры: Corner - угол начала отображения (выбирается из списка) CandleMode - режим отображения: true - свечи, false - бары ShowLastBid - включить/отключить отображени
FREE
This indicator informs the user when the ATR is above a certain value defined by the user, as well as when the ATR prints a percentage increase or percentage decrease in its value, in order to offer the user information about the occurrence of spikes or drops in volatility which can be widely used within volatility-based trading systems or, especially, in Recovery Zone or Grid Hedge systems. Furthermore, as the volatility aspect is extremely determining for the success rate of any system based o
FREE

Introduction RSI divergence is a main technique used to determine trend reversing when it’s time to sell or buy because prices are likely to drop or pick in the charts. The RSI Divergence indicator can help you locate the top and bottom of the market. This indicator finds Regular divergence for pullback the market and also finds hidden RSI Divergence to show continuing trend. This indicator shows divergence on the RSI that is a strong hint for an excellent entry point and finds immediately with
FREE

Session Killzone Indicator
Indicator that helps you to identify the killzone times of both London and NewYork sessions which usually is the most times for high volatility and taking liquidity from the market. Killzone times are configurable through indicator parameters. The indicator adjusts the range of the killzones based on the daily trading range.
FREE

Индикатор R 3MA Cross — это популярный трендовый индикатор с предупреждениями, основанными на пересечении трех скользящих средних, он состоит из более быстрой, средней и более медленной скользящих средних.
Ключевые моменты Предупреждение о покупке появится, когда более быстрая скользящая средняя пересечет среднюю и более медленную скользящую среднюю вверх.
Оповещение о продаже возникает, когда более быстрая скользящая средняя пересекает среднюю и более медленную скользящую среднюю вниз.
К
FREE
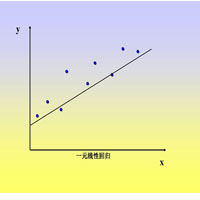
This index is used to calculate the linear regression slope of the K line in a period of time. The algorithm adopts the least square method.
1. Suitable for each cycle chart.
2. Can be used to calculate opening price, closing price, high price, low price, middle price.
3. Specify the start time and end time in the parameters.
Note that the start time and end time cannot be weekends, select the calculated price, pay attention to capital letters.
FREE
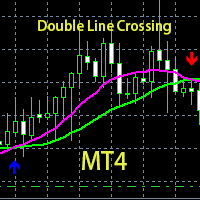
his is a custom indicator based on double-average crossing and arrow marking.
Make multiple lists when blue arrows appear up.
Make a blank list when the red arrow appears down.
When the pink line crosses the green line upwards, the pink line is above, the green line is below, the golden fork appears, and the blue arrow appears.
When the pink line crosses down through the green line, the pink line is below, the green line is above, a dead fork appears, and a red arrow appears.
This is a
FREE

Статистика панели управления учетной записью
Это инструмент, который поможет вам иметь сфокусированное представление, чтобы узнать о прибылях и убытках вашего счета, чтобы вы могли отслеживать их, а также проводит анализ просадки, чтобы узнать полученный риск. Скачав и активировав его в личном кабинете, вы должны привязать его к любому символу например EURUSD H1, тогда с этого момента инструмент начнет отслеживать вашу статистику
панель полностью расширена, ее можно скрыть и переместить куд
FREE
Данный индикатор основывается на работах легендарного трейдера Вильяма Ганна, а точнее на математических моделях используя данные прошлых дней. Он рассчитывает потенциальное время разворота по выбранным парам на текущий день. Время отображается на будущее, на открытие дня и больше не изменяется. Так же данный индикатор оснащен алертами когда приходит потенциальное время. В индикатор встроен алгоритм возможного движения цены . Когда приходит время подается алерт, а так же изменяется цвет строки

ALQANNAS (Sniper) Indicator Overview: Welcome to ALQANNAS, your ultimate sniper in the forex market! ALQANNAS is a powerful and versatile trading indicator designed to enhance your trading experience. Whether you're a beginner or an experienced trader, ALQANNAS provides you with accurate non repainting signals, trend direction and strength, and advanced features to elevate your trading strategy. Key Features: Buy and Sell Signals: ALQANNAS is equipped with a sophisticated algorithm that genera

IceFX SpreadMonitor - специальный индикатор, фиксирующий значение спреда. Он показывает текущий, минимальный/максимальный и средний спред. Эти значения остаются видимыми даже после перезагрузки. Также SpreadMonitor может сохранять необходимые значения спреда в CSV файл для последующего анализа.
Параметры индикатора: SpreadLowLevel - низкий уровень спреда (зеленый цвет) SpreadHighLevel - высокий уровень спреда (красный цвет) BGColor - фон панели SpreadNormalColor - цвет при нормальном спреде Sp
FREE

"Capture the sleeping and waking alligator." Detect trend entrance/exit conditions - this indicator can also be tuned according to your trading style. You can adjust a confidence parameter to reduce false positives (but capture less of the trend). This is based on a modification of the Alligator indicator by Bill Williams, an early pioneer of market psychology. 2 main strategies: either the " conservative" approach to more frequently make profitable trades (at a lower profit), or the " high r
FREE

Принципы построения индикатора. Индикатор Absolute Bands ( AB ) напоминает своим видом и функциями индикатор Bollinger Bands , но только более эффективен для торговли из-за существенно меньшего количества выдаваемых им ложных сигналов, что обусловлено его более робастным характером. В индикаторе Bollinger Bands по обе стороны от скользящего среднего – Ma откладываются среднеквадратичные отклонения Std=Sqrt(<(X- Ma )^2>) (где X - история цены, <…> - процедура усред
FREE

The " YK Find Support And Resistance " indicator is a technical analysis tool used to identify key support and resistance levels on a price chart. Its features and functions are as follows:
1. Displays support and resistance levels using arrow lines and colored bands, with resistance in red and support in green.
2. Can be adjusted to calculate and display results from a specified timeframe using the forced_tf variable. If set to 0, it will use the current timeframe of the chart.
3. Uses t
FREE

Just another plain Super Trend indicator.
On this one i have added another buffer (on index 2) which can be used on EA; the values is -1 to identify a bearish trend while for bullish trend the value is 1.
Here a code snippet:
int trend = ( int ) iCustom ( NULL , Timeframe, "SuperTrend" , Period , Multiplier, 2 , 1 ); It work on every timeframe.
If you need help to integrate it on your EA, don't hesitate to contact me.
FREE

How To Trade
Execute your trades in 3 Easy Steps!
Step 1: Trade Setup Entry Buy in Line color Blue Touch on line color Red. Entry Sell in Line color Blue Touch on line color Green. Success Rate ≥ 80% 100:20 depend your experience and fast your take. Step 2: Set Stop Loss Stop loss BUY ----> You can not put stoploss with a fixed price, your speed in determining the closing request------>Line color Blue Touch on line color Green. Stop loss SELL ----> You can not put stoploss with a fixed price,
FREE

Индикатор ищет консолидацию(флэт) на рынке в определенное время, строит коробку-канал и отмечает уровни с отступом от него на пробой. После пересечения одного из уровней индикатор отмечает зону для тейкпрофита и считает соответствующий профит или убыток в направлении данного входа на панели. Таким образом, индикатор, подстраиваясь под рынок, находит флэтовый участок с началом трендового движения для входа в него. Версия для МТ5: https://www.mql5.com/ru/market/product/58380
Преимущества:
уник
FREE

RaysFX Supertrend + Alert RaysFX Supertrend è un indicatore di tendenza superiore progettato per i trader che desiderano avere un vantaggio nel mercato. Questo indicatore utilizza una combinazione di CCI (Commodity Channel Index) e ATR (Average True Range) per identificare le tendenze del mercato e fornire segnali di trading accurati. Caratteristiche principali Indicatori CCI e ATR: Utilizza due degli indicatori più popolari e affidabili per identificare le tendenze del mercato e generare segnal
FREE

* Pivot Points Magic : Effortlessly Plot Pivot Levels on Any Chart**
Pivot Points Magic simplifies the process of identifying critical pivot levels on any chart, across all timeframes. With just a few clicks, traders can instantly visualize pivot points, enabling them to make more informed trading decisions.
We value your feedback! Share your experience with Pivot Points Magic and help us improve. Your reviews and suggestions are essential for shaping future updates and enhancements to the
FREE

The Supertrend draws a line following the current trend.. Green Line under the candle means a likely bullish trend Red Line above the candle means a likely bearish trend
How to trade with SuperTrend indicator Buy when the Supertrend Green line is below the price, Sell when the Supertrend Red line is above the price. It is strongly suggested to use this indicator in a trending market.
Parameters Multiplier - the lower it is and the more sensitive is the line, meaning it will follow the price
FREE

This indicator is a simple trend line indicator.
The upper trend line is the highest price of 60 past candlesticks, the highest price of 30 past candlesticks,
The bottom line is the trend line that connects the lowest price of 60 past candlesticks and the lowest price of 30 past candlesticks.
*The color of the trend line is white.
Notes
This indicator is created with the above configuration, so if the highest and lowest prices of the past 60 candlesticks and 30 candlesticks are the s
FREE

The indicator shows divergence between the slope of lines connecting price and MACD histogram peaks or troughs. A bullish divergence (actually a convergence) occurs when the lines connecting MACD troughs and the lines connecting the corresponding troughs on the price chart have opposite slopes and are converging. A bearish divergence occurs when the lines connecting MACD peaks and the lines connecting corresponding price peaks have opposite slopes and are diverging. In such a case, the indicato

Presenting the uGenesys Break of Structure and Change of Character Indicator The uGenesys Market Structure Indicator is the advanced solution designed specifically for forex traders seeking a competitive edge. This innovative tool goes beyond merely identifying Break of Structure (BoS) and Change of Character (CHoC); it also illuminates optimal entry and exit points on your forex charts, transforming your trading experience.
While the uGenesys Market Structure Indicator can reveal pivotal pa
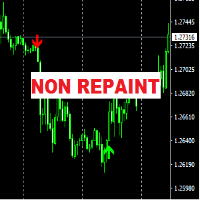
The "FCK Trend Arrow No Repaint" indicator is designed for analyzing market dynamics and determining potential trading signal moments. The main feature of this indicator is the absence of signal repainting, which contributes to more accurate and reliable forecasting of price movements in the market.
Mechanism of Operation: The "FCK Trend Arrow No Repaint" indicator uses several types of graphical elements to indicate trading signals: Up and Down Arrows: The indicator marks possible market ent

SmartChanel - универсальный индикатор для всех типов рынка. Данный индикатор должен иметь в своем арсенале каждый трейдер, так как он представляет собой классический подход к анализу цены торгового инструмента и является готовой торговой стратегией. Индикатор формирует верхний, средний предел движения цены.
Преимущества индикатора работает с любым торговым инструментом работает на любом временном периоде можно использовать как на классическом рынке, так и на рынке бинарных опционов индикатор н

PipTick Heiken Ashi - это наша версия индикатора Heiken Ashi. В отличие от конкурирующих продуктов, этот индикатор предлагает широкие возможности для расчета свечей Heiken Ashi. Он может отображаться в классическом или сглаженном виде. Данный индикатор рассчитывает Heiken Ashi со скользящей средней четырьмя способами: SMA - простая скользящая средняя SMMA - сглаженная скользящая средняя EMA - экспоненциальная скользящая средняя LWMA - линейно-взвешенная скользящая средняя
Основные характеристи
FREE

Master Candle (MC) Indicator automatically detects "Master Candles", also known as "Mother Candles", i.e. candle that engulf several candles that follow them. See screenshots. You can choose how many candles Master Candle should engulf. By default it is set to 4. Feel free to change colour and thickness of lines as it suites you.
I find this indicator to be very useful to identify congestions and breakouts, especially on 60 minutes charts. Usually if you see candle closing above or below "Mast
FREE

MA Crossover Arrows – простой индикатор, отображающий стрелки и алерты при пересечении двух скользящих средних.
Поддерживаемые типы скользящих средних Простая Экспоненциальная Сглаженная Линейно-взвешенная
Поддерживаемые типы цены Закрытия (Close) Открытия (Open) Максимальная (High) Минимальная (Low) Медианная (HL/2) Типичная (HLC/3) Взвешенная цена закрытия (HLCC/4) Когда быстрая скользящая средняя пересекает медленную снизу вверх, на графике появляется зеленая стрелка вверх. Когда быстрая
FREE
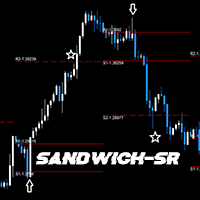
GENERAL DESCRIPTION
Simple SR Projection based on selected instrument's historical data. Best used in conjunction with current market sentiment, and fundamental analysis. Currently limited to selected pairs due to of historical data to project accurate levels.
Generally, for support and resistance, 2 levels are drawn, respectively. The inner levels (R1,S1) project the highs and lows during the opening stages of selected time frame. The outer levels, represent the targets to reach during the c
FREE

Advanced Bollinger Bands Scanner is a multi symbol multi timeframe Bollinger bands dashboard that monitors and analyzes the Bollinger Bands indicator from one chart. This panel monitors the Bollinger bands indicator in up to 28 configurable instruments and 9 timeframes for price overbought/oversold, price consolidation (Bollinger bands squeeze), and consolidation breakout (squeeze break) with a deep scan feature to scan all market watch symbols (up to 1000 instruments!).
Download Demo here

RECOMMEHDATION Trade with this indicator for 2-3 weeks and you will feel significant progress in your trading. This indicator is developed based on the use of HMA, Laguerre, CCI . Indicator will help you: accurately enter the market; reduce the number of errors when opeinng orders; visually see market movement; predict price movement(in absent of significant news); do not rush to close profitable trades prematurely and increase profit; do not rush to enter the market and wait for "easy prey".
FREE

Whether trading stocks, futures, options, or FX, traders confront the single most important question: to trade trend or range? This tool helps you identify ranges to either trade within, or, wait for breakouts signaling trend onset.
Free download for a limited time! We hope you enjoy, with our very best wishes during this pandemic!
The issue with identifying ranges is some ranges and patterns are easy to miss, and subject to human error when calculated on the fly. The Automatic Range Identi
FREE
MetaTrader Маркет - единственный магазин, где можно скачать демоверсию торгового робота и подвергнуть его проверке и даже оптимизации на исторических данных.
Прочитайте описание и отзывы других покупателей на заинтересовавший вас продукт, скачайте его прямо в терминал и узнайте, как протестировать торгового робота перед покупкой. Только у нас вы можете получить представление о программе, не заплатив за неё.
Вы упускаете торговые возможности:
- Бесплатные приложения для трейдинга
- 8 000+ сигналов для копирования
- Экономические новости для анализа финансовых рынков
Регистрация
Вход
Если у вас нет учетной записи, зарегистрируйтесь
Для авторизации и пользования сайтом MQL5.com необходимо разрешить использование файлов Сookie.
Пожалуйста, включите в вашем браузере данную настройку, иначе вы не сможете авторизоваться.