Watch the Market tutorial videos on YouTube
How to buy а trading robot or an indicator
Run your EA on
virtual hosting
virtual hosting
Test аn indicator/trading robot before buying
Want to earn in the Market?
How to present a product for a sell-through
New Expert Advisors and Indicators for MetaTrader 4 - 287
This is a multicurrency indices cluster indicator with extended functionality. It displays linear changes in relative value of tickers and currencies on annual, monthly, weekly basis. It calculates the values in the same way as CCFpExtra does, but does not use moving averages. Instead, all numbers are compared to an initial value at some point in history, for example, at beginning of a year, a month, or a week. As a result, one may see exact changes of values, and apply traditional technical ana

Ever wondered why standard ADX is made unsigned and what if it would be kept signed? This indicator gives the answer, which allows you to trade more efficient. This indicator calculates ADX values using standard formulae, but excludes operation of taking the module of ADX values, which is forcedly added into ADX for some reason. In other words, the indicator preserves natural signs of ADX values, which makes it more consistent, easy to use, and gives signals earlier than standard ADX. Strictly s

The Expert Advisor opens orders at the points of possible price reversal using repeated entries (adding to a position). Parameters for repeated entries (volume, price and time) are set by the functions. Function equations are integrated into the EA. Only initial parameters and equation type should be selected for optimization. Features By selecting different combinations of parameters and equations integrated into the EA, you can create its varieties that are quite different in their trading

Trades Viewer is a trading helper app for a serious trader. It offers several important data like day range, 22 days average range and predefined PL. It draws trades history and current open positions on a chart. It has a detail panel for viewing a particular trade with just a click on that trade. All these make it very convenient and straightforward to view your entry/exit positions and thus improve your trading system.
Features Profit/loss of the current symbol, counting all trades of the sy

Price Breakout pattern Scanner is the automatic scanner for traders and investors. It can detect following patterns automatically from your chart. Head and Shoulder - Common tradable pattern. Reverse Head and Shoulder - This pattern is the reverse formation of the Head and Shoulder. Double Top - When the price hits resistance level twice and decline toward the support level, the trader can anticipate sudden bearish breakout through the support level. Double Bottom - The double bottom pattern is

This is the full version of "SAR Trading Station" SAR Trading Station is a semi-auto trading system based on Parabolic SAR and Stochastic etc, and trend driven swing trading strategy. This is an agile platform allowing you to setup various parameters to optimize the specific symbol pair trading strategy for yourself! Enquire email: info@startrading.com.au, Facebook:mengmeng_cn@hotmail.com Risk(Max Loss$): : Default is 50, Max loss Per order(Position size is calculated by stop loss amount) Round:

Trend is the direction that prices are moving in, based on where they have been in the past . Trends are made up of peaks and troughs. It is the direction of those peaks and troughs that constitute a market's trend. Whether those peaks and troughs are moving up, down, or sideways indicates the direction of the trend.
The indicator PineTrees is sensitive enough (one has to use input parameter nPeriod) to show UP (green line) and DOWN (red line) trend.

This is a unique tick chart indicator for MetaTrader 4 platform. The software is capable to graphically display the last 100 ticks and in addition to that it displays the current spread, bid / ask and time values in an elegant IceFX style dashboard. The indicator is an efficient tool for traders using M5 or even M1 timeframe.
Indicator parameters: Corner - corner of panel CornerXOffset - horizontal offset from the corner CornerYOffset - vertical offset from the corner ChartType - type of cha
FREE

Auto Trade Copier is designed to copy trades to multiple MT4, MT5 and cTrader accounts/terminals with 100% accuracy. The provider and receiver accounts must be on the same PC/VPS. With this tool, you can copy trades to receiver accounts on the same PC/VPS. All trading actions will be copied from provider to receiver perfectly. This version can be used on MT4 accounts only. For MT5 accounts, you must use Auto Trade Copier for MT5 . Reference: - For MT4 receiver, please download Trade Receiver Fre
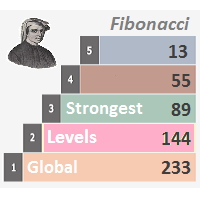
Description Strongest Levels Global is a colored multicurrency/multisymbols indicator that automatically plots a system of the nearest levels of strongest resistance and support in the separate window on one of nine different indicators of the current timeframe in accordance with user's choice. Repeated usage of the indicator with various number of bars creates an extended and confirmed system of support and resistance! The indicator calculates and plots levels based on the number of bars set b
This is a technical indicator that put on strategy tester the buttons of the expert adviser "Control adora". Usually when applied the controladora to the strategy tester, the buttons do not appear and therefore its functions (like directly buy, sell, close orders or place stop loss indicator) can't be used. But now you can if have the Manual Backtest indicator. If you don't have Control adora, you can get it from here . This indicator get on the chart the buttons that can be of use in strategy t
FREE

This is a simple script that places a defined number of lines above and below a given price. The script lets you set the number of lines, the separation in pips and the color. Instructions:
Drop the script on a chart to draw the level lines If the last parameter is set to false, the script will delete the lines previously placed by it.
Parameters:
English? Turn it yes to use English language, false will turn language to Spanish Separation Set the pips distance among lines From Price
FREE

Gann Line indicator is usually used in combination with other Gann’s techniques, some say this is a key point in its success. The Gann line is interpreted as trend indicator, a series of higher highs and higher lows in it's trend are considered bullish, and a series of lower lows and lower highs are bearish. As with other technical indicators, for better results Gann Line should be used in combination with other technical concepts as Gann Fan, fibo, swings, supports and resistance, etc. When rev
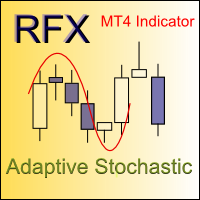
Stochastic Oscillator is one of the most popular and accurate oscillators widely used by traders to capture overbought and oversold areas of price action. Although the Stochastic indicator works fine for an interval of the market, it fails to generate profitable signals when the market conditions change, and hence it produces wrong signals resulting in big losses. Have you ever thought about an adaptive Stochastic indicator that adapts its period of calculation based on the market conditions? Th

This is an aggregator of several ZigZag levels predictions based on probability. It uses the same approach as another ZigZag-based prediction indicator - ZigZagProbability . But unlike ZigZagProbability, this indicator combines analysis of 5 zigzags with different ranges. For every zigzag, it processes the available history for calculating density distribution of the zigzag edges and conditional probability of their consecutive pairs. Then it sums up the probabilities of all noticeably price lev

This indicator is based on multiple instances of CCFpExtra cluster indicator and provides super position of their results. The indicator creates a set of CCFpExtra instances with carefully selected periods and combines their results using smart weighting and normalization algorithms. No more worries about settings to choose for cluster analysis, no more false signals. And it inherits all advantages of CCFpExtra : arbitrary groups of tickers or currencies, time alignment of bars for different sym
This EA provides the following functions: Open a position: When the price crosses the trend line, open a long or short order Closing: When the price crosses the trend line, close the long or short position Trailing stop loss: EA will continue to increase the stop loss of long orders or lower the stop loss of short orders along the trend line. The line can be a trend line or a horizontal line, Trend lines can be rays or line segments. Line segments have a special function, which is to only

MACD indicator in MetaTrader 4/5 looks different than MACD does in most other charting software. That is because the MetaTrader 4/5 version of MACD displays the MACD line as a histogram when it is traditionally displayed as a line. Additionally, the MetaTrader 4/5 version computes the Signal line using an SMA, while according to MACD definition it is supposed to be an EMA. The MetaTrader 4/5 version also does not compute a true MACD Histogram (the difference between the MACD/Signal lines). This
FREE

BreakEven shows the location of the average price level of the orders in the symbol, to which the indicator is attached. This information allows you to find the break-even. The indicator is helpful if you manage several positions, since it allows you to evaluate the performance of your open trades in a glance. If you trade a single order, it allows you to evaluate the effect of your stop loss and the profit or loss during the time your trade is open. Apart from drawing a break-even level line (w

Description Fibo Levels Custom is a color multicurrency/multi-symbol indicator that automatically plots Fibonacci levels on the Market Mood Oscillator in a separate window below the chart of the main financial instrument. It can be used with any broker, regardless of the name of a financial instrument used because the symbol name must be entered manually as an input parameter. If you enter a non-existent or invalid name of a financial instrument, you will receive an error message sayin

The Bull and Bear Power indicators identify whether the buyers or sellers in the market have the power, and as such lead to price breakout in the respective directions. The Bears Power indicator attempts to measure the market's appetite for lower prices. The Bulls Power indicator attempts to measure the market's appetite for higher prices. This particular indicator will be especially very effective when the narrow histogram and the wide histogram reside on the same side (above or under the Zero

This is an adaptive ZigZag based on modification of HZZ indicator (original source code is available in this article ). Most important changes in this version: two additional indicator buffers added for zigzag evolution monitoring - they show cross signs at points where zigzag direction first changes; zigzag range (H) autodetection on day by day basis; time-dependent adjustment of zigzag range. Parameters: H - zigzag range in points; this parameter is similar to original HZZ, but it can take 0
FREE

The main idea of this indicator is rates analysis and prediction by Fourier transform. The indicator decomposes exchange rates into main harmonics and calculates their product in future. The indicator shows 2 price marks in history, depicting price range in the past, and 2 price marks in future with price movement forecast. Buy or sell decision and take profit size are displayed in a text label in the indicator window. The indicator uses another indicator as an engine for calculations - FreqoMet

This indicator monitors the market for a flat state and possible breakout. The flat state is detected as a predefined number of consecutive bars during which price fluctuates inside a small range. If one of the next bars closes outside the range, breakout is signaled. The indicator shows 3 lines: blue - upper bound of flat ranges AND consecutive breakout areas; red - lower bound of flat ranges AND consecutive breakout areas; yellow - center of flat ranges (NOT including breakout areas). When a b
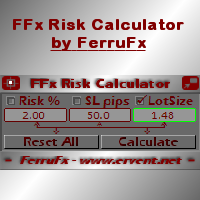
FFx Risk Calculator panel will help you to calculate very easily your trades size, SL or the risk directly on the chart. All features are described below: Option to select which parameter to calculate: Risk, Stop Loss or Lot Size The panel will show if the lot size is allowed according to the current account free margin Button to maximize/minimize the panel Drag and Drop the panel anywhere on the chart How to use it? Select the parameter you want to be calculated. It will be based on the 2 other
This indicator predicts next ZigZag move based on historical ZigZag edges probabilities. It processes available history for calculating density distribution of ZigZag edges and conditional probability of their consecutive pairs. Then it uses the probabilities for estimating levels where future extremums (reversal points) may appear. This indicator builds zigzag by HZZM indicator , but does not display zigzag itself. You may use HZZM for zigzag visualization. The indicator displays up to 8 horizo

This indicator is intended for trend, support and resistance lines formation based on ZigZag extremums traversal. Indicator builds straight lines passing through latest ZigZag extremums and detects their crossing with future prices generating a buy or sell breakout signal. One of built-in ZigZag indicators can be used as an engine. Warning: Most of zigzags either redraw latest segment or delay latest extremum output for several bars. Due to this fact, ZZTrends output differs on a static history

This is a breakout indicator using Linear Regression (LR) and Standard Deviation (SD) adaptive channels. It finds a best fitting of linear regression and standard deviation channels on consecutive bars, then monitors prices on breaking out the channel, and if so - generates a signal. The best fitting is performed by picking up the channels length which provides less difference between LR and SD channels width. On every bar the channels may have different - adaptive - length. Indicator displays p
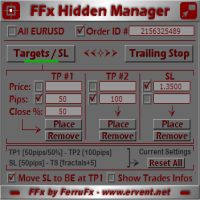
The FFx Hidden Manager panel will help you to manage easily your orders directly on the chart. Below all features described: TP, SL and TrailingStop are hidden Each order has its own lines on chart Drag & Drop any line to change the TP/SL as per your need Option to move automatically the SL line at breakeven when TP #1 is reached Option to choose the TP/SL type (by pips or price) Option to choose the TrailingStop type (by pips, MA, Fractals, PSAR or ATR) Define which order(s) you want to manage

Gann Time Clusters Indicator This indicator is based on W. D. Gann's Square of 9 method for the time axis. It uses past market reversal points and applies the mathematical formula for Gann's Square of 9 and then makes projections into the future. A date/time where future projections line up is called a 'time cluster'. These time clusters are drawn as vertical lines on the right side of the chart where the market has not advanced to yet. A time cluster will result in a market reversal point (ex.,

This is an extension of the previous published DollarIndex with the addition of the function for calculating EURO Index under ICE Formula. Note that the broker should provide the following data:
For Dollar Index formula, EURUSD, USDJPY, GBPUSD, USDCAD, USDSEK and USDCHF are needed. For Euro Index formula, EURUSD, EURGBP, EURSEK and EURCHF are needed. Now in this version if the SEK (the most uncommon) is not provided, the formula still works, since it adds 0.0001 to its value, but the index will
FREE

Description Fibo Retracement is an indicator that automatically plots Fibonacci levels in the main chart based on Close prices , which distinguishes it from the Fibo Levels indicator that plots levels based on High/Low prices. Thus, using both indicators provides the trader with the opportunity of determining support and resistance zones by Fibonacci! The levels are calculated and plotted over a certain interval using the number of bars specified by the user. The user can display Fibonacci l

Ilanis is and Expert Advisor for stock trading, it can be used for trading on Forex and other markets, including commodities, metals and index markets. To determine the market entry, the EA uses the modern and ultra-light adaptive indicator FourAverage. Principle of position maintaining is similar to that of the popular Forex robot Ilan, using averaging. But unlike Ilan, Ilanis uses an accurate entry into the market. The robot pays a lot of attention to position control, if the price goes in the
The new version of MirrorSoftware 2021 has been completely rewriten and optimized.
This version requires to be loaded only on a single chart because it can detect all actions on every symbol and not only the actions of symbol where it is loaded.
Even the graphics and the configuration mode have been completely redesigned. The MirrorSoftware is composed of two components (all components are required to work): MirrorController (free indicator): This component must be loaded into the MAST
FREE

The indicator draws a histogram of important levels for several major currencies attached to the current cross rates. It is intended for using on charts of crosses. It displays a histogram calculated from levels of nearest extremums of related major currencies. For example, hidden levels for AUDJPY can be detected by analyzing extremums of AUD and JPY rates against USD, EUR, GBP, and CHF. All instruments built from these currencies must be available on the client. This is an extended version of
"Support" and "Resistance" levels - points at which an exchange rate trend may be interrupted and reversed - are widely used for short-term exchange rate forecasting. One can use this indicator as Buy/Sell signals when the current price goes above or beyond Resistance/ Support levels respectively and as a StopLoss value for the opened position.

The three basic types of trends are up, down, and sideways. An uptrend is marked by an overall increase in price. Nothing moves straight up for long, so there will always be oscillations, but the overall direction needs to be higher. A downtrend occurs when the price of an asset moves lower over a period of time. This is a separate window indicator without any input parameters. Green Histogram is representing an Up-Trend and Red Histogram is representing a Down-Trend.

When the bands come close together, constricting the moving average, it is called a squeeze. A squeeze signals a period of low volatility and is considered by traders to be a potential sign of future increased volatility and possible trading opportunities. Conversely, the wider apart the bands move, the more likely the chance of a decrease in volatility and the greater the possibility of exiting a trade. This indicator can be used at any time frames and currency pairs. The following input parame

This is a signal indicator for automatic trading which shows probability measures for buys and sells for each bar. It is based on statistical data gathered on existing history and takes into account all observed price changes versus corresponding bar intervals in the past. The core of the indicator is the same as in PriceProbablility indicator intended for manual trading. Unlike PriceProbability this indicator should be called from MQL4 Expert Advisors or used for history visual analysis. The in

The main idea of this indicator is rates analysis and prediction by Fourier transform. Indicator decomposes exchange rates into main harmonics and calculates their product in future. You may use the indicator as a standalone product, but for better prediction accuracy there is another related indicator - FreqoMaster - which uses FreqoMeterForecast as a backend engine and combines several instances of FreqoMeterForecast for different frequency bands. Parameters: iPeriod - number of bars in the ma

This is a very powerful indicator that provides a mix of three running totals of linear weighted returns. Each one is similar to a specific mode of ReturnAutoScale indicator. The result is a scaled superposition of three integrated and difference-stationary time series, each for different trading strategy. Indicator displays three lines: yellow - slow market returns, corresponds to mode 0 in ReturnAutoScale; blue - medium market returns, corresponds to mode 1 in ReturnAutoScale; red - fast marke

This indicator helps to find high/low points. This is not perfect trend indicator, because sometime it shows anti-market trend. But it never misses highest and lowest price in history. So that, the rules for entry are: Sell with downtrend (red line), Buy with uptrend (blue line). Yellow arrows for Sell, but it should be confirmed by downtrend. Aqua arrows for Buy, but it should be confirmed by uptrend.

Visit our all-new Stein Investments Welcome Page to get the latest information, updates and trading strategies. Do you want to become a constantly profitable 5-star forex trader? Then get our Stein Investments trading tools and send us a screenshot to get your personal invitation to our exclusive trading chat with 500+ members.
This Trade Manager is the ideal addition for all FX Trend users which like to use a fully automated trade management. It detects your manually opened trades im

This is a reduced version, demo if you like, of the published Elliott Wave Tool 7Pasos . The limitations for this tool vs Elliott Wave Tool 7pasos are the following: Only one account possible, the original tool has 1 principal and 4 alternative accounts. Only one degree (Primary) is available, in the original tool 12 different degrees (6 in micro) are at your disposition. As only one degree is available, the functions to upgrade and downgrade the degree of the selected wave are disabled. Fixed c
FREE

Description Strongest Level is an indicator that automatically plots the nearest levels of strongest resistance and support in the main chart based on prices of the current timeframe. Repeated usage of the indicator with various number of bars creates a system of support and resistance! The indicator calculates and plots levels based on number of bars set by the user. It is recommended to set numbers from a golden ratio according to Fibonacci (13, 21, 34, 55, 89, 144, 233, 377, 610 etc.). Users

Free Hand Drawer is a small app that runs as technical indicator and the only thing that does is that it draws continuous line. To activate it, after adding the indicator to the chart just press the D on your keyboard and click where you want to start drawing. Then every click you make on your chart will be the next nod in your drawing. Use it to draft Elliott waves, or to illustrate ideas on your chart. If you like to draw manually your Gann line you’ll find it handy as well. Each time you want
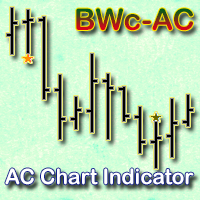
The indicator displays Accelerator Oscillator (AC) signals in accordance with Bill Williams' strategy on a chart. The AC histogram is a five-period simple moving average drawn on the difference between the value 5/34 of the AO histogram and a 5-period simple moving average of this histogram. Interpretation of AC is based on the following rules - if AC is above the zero line, it is considered that the market acceleration will continue its upward movement. The same rule applies to the downward mov
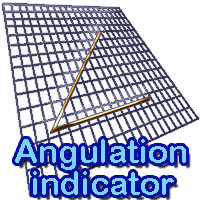
The indicator draws angulation lines on a chart. These lines can help make decision on whether to enter the market or stay out of it. It is used to filter the signal "The First Wise Man" described in Bill Williams' strategy. Angulation in this indicator is displayed for any bar that is formed after Alligator's mouth is crossed (not only for reversal). Settings: Show angulation lines . Show info - show additional details (angulation degree, calculation points, number of bars). Minimal angle to fi
FREE

Fibonacci Arcs in the full circles are based on the previous day's candle (High - Low).
These arcs intersect the base line at the 23.6%, 38.2%, 50%, 61.8%, and 78.6%. Fibonacci arcs represent areas of potential support and resistance.
Reference point - the closing price of the previous day.
These circles will stay still all day long until the beginning of the new trading day when the indicator will automatically build a new set of the Fibonacci Arcs.

This indicator is using 10 classical indicators: Moving Averages Larry Williams' Percent Range Parabolic Stop and Reverse Moving Averages Convergence/Divergence Moving Average of Oscillator Commodity Channel Index Momentum Relative Strength Index Stochastic Oscillator Average Directional Movement Index for calculating the up or down trend for the current currency pair by majoritarian principle for the all TimeFrames.

Description I think, almost all traders dream about non-lagging MA. I have realized that dream in my indicator. It allows forecasting future MA values! The indicator can be used in four different ways: The first one - forecast for the desired amount of bars. Thus, you are able to evaluate future price behavior. The second one - generating non-lagging "averages". That can be implemented by moving MA back by the half of the averaging period and setting the forecast the necessary amount of bars ahe
FREE

Support and resistance represent key junctures where the forces of supply and demand meet. On an interesting note, resistance levels can often turn into support areas once they have been breached. This indicator is calculating and drawing 5 pairs of "Support and Resistance" lines as "High and Low" from the current and 4 previous days.

The indicator calculates running total of linear weighted returns. It transforms rates into integrated and difference-stationary time series with distinctive buy and sell zones. Buy zones are shown in blue, sell zones in red. Parameters: period - number of bars to use for linear weighted calculation; default value - 96; smoothing - period for EMA; default value - 5; mode - an integer value for choosing calculation mode: 0 - long term trading; 1 - medium term trading; 2 - short term trading; defa
FREE

MWC COX indicator shows the extreme zones of net short/long positions for four periods of time. Default settings are periods of 12, 26, 52 and 156 weeks.
Additional Features
- Displays the sum of all 4 periods in one line
- MA, MOM and RSI indicators are integrated
Please make sure that you download the MWC_Demo.zip file and unpack it into [...]/MQL4/Files folder. -> www.myweeklycot.com/teaser-demo
FREE
Identifying the trend of the market is an essential task of traders. Trendometer implements an advanced algorithm to visualize the trend of the market. The major focus of this indicator is to evaluate the market in the lower time frames (i.e., M1, M5 and M15) for the scalping purposes. If you are a scalper looking for a reliable indicator to improve your trade quality, Trendometer is for you. The indicator runs on a separate window showing a histogram of red and green bars. A two consecutive gre

Description Strongest Higher Level is an indicator that automatically plots the nearest level of strongest resistance and support in the main chart based on prices of the higher timeframe that differs it from Strongest Level indicator. Repeated usage of the indicator with various number of bars creates a system of support and resistance! The indicator calculates and plots levels based on number of bars set by the user. It is recommended to set numbers from a golden ratio according to Fibonacci

I like trading manually, so I created this tool to make my trade more easier and faster.
Features Money management. Click for place order ( Buy/Sell/BuyStop/BuyLimit/SellStop/SellLimit). Many buttons for control your account (Close All, Remove Pendings, Breakeven, Hedging). Auto hide if not use for 2 minutes. See profit on current symbol. Free to move panel to where you want. Save your settings for using on next time. Special: It's work on backtest mode! You can use this for training yourself.

This is a semi-automatic Expert Advisor. A user draws a support or a resistance line in the form of a horizontal line or a trendline on a chart. A command in the format of UP|DN_xxxx:yyyy is specified in the line name; the Expert Advisor understands it as a signal to buy or sell setting a stop loss and a take profit. EA settings include a parameter with a lot size and a value for moving stop loss to breakeven. If stop loss = 0, the EA does not use breakeven. If this parameter is greater than zer

Introduction Harmonic Patterns are best used to predict potential turning point. Traditionally, Harmonic Pattern was identified manually connecting peaks and troughs points in the chart. Manual harmonic pattern detection is painfully tedious and not suitable for everyone. You are often exposed under subjective pattern identification with manual pattern detection. To avoid these limitations, Harmonic Pattern Plus was designed to automate your harmonic pattern detection process. The functionality

This indicator detects price reversals in a zig-zag fashion, using only price action analysis and a donchian channel. It has been specifically designed for short-term trading, without repainting or backpainting at all. It is a fantastic tool for shrewd traders aiming to increase the timing of their operations. [ Installation Guide | Update Guide | Troubleshooting | FAQ | All Products ]
Amazingly easy to trade It provides value on every timeframe It provides suitable SL and TP levels
It impl

Auto Trade Driver is an automatic powerful tool (run as Expert Advisor) that helps you to manage risk and control orders and maximize your profit in multi-protect/trailing-stop rules. This tool is very useful for both scalpers and trend followers. It not only calculates the trade risk exactly, but also protects and maximizes your profits in real-time. With this tool, the only thing you have to do is to enter trade by your own strategy, then it will auto-drive your position with exit strategy you

Automatic, live & interactive picture of all trendlines. Assign push, email and sound alerts to the lines of your choice and be informed about price rollback, breakout, rollback after breakout, number of rollbacks, line expiration by double breakout. Correct, drag or delete the lines and interactively tune the line system. https://youtu.be/EJUo9pYiHFA . Chart examples https: //www.mql5.com/en/users/efficientforex
Price Interaction Events
All events are effective immediately and only after on

Description Abuza 4 is an intraday trading system making profit during the price rollback. The Expert Advisor has been optimized for working on EURUSD. However, it can successfully work with other currency pairs as well. Martingale can be enabled, but you should be extremely careful (take profit often and at a proper time!). You can examine the Expert Advisor's trading statistics for different brokers and symbols in the MetaTrader 4 Trading Signals sections. Parameters Risk management: enter vol

This indicator shows price changes for the same days in past years. D1 timeframe is required. This is a predictor indicator that finds D1 bars for the same days in past 8 years and shows their relative price changes on the current chart. Parameters: LookForward - number of days (bars) to show "future" price changes; default is 5; Offset - number of days (bars) to shift back in history; default is 0; ShowAverage - mode switch; true - show mean value for all 8 years and deviation bounds; false - s
FREE
Relative Strength Index (RSI) is one of the most popular and accurate oscillators widely used by traders to capture overbought and oversold areas of price action. Although the RSI indicator works fine for a period of market, it fails to generate profitable signals when market condition changes, and hence produces wrong signals which results in big losses. Have you ever thought about an adaptive RSI indicator that adapts its period of calculation based on the market conditions? The presented indi

UPDATE: I apologize for increasing the price from 15$ to 30$, but that was required by MetaQuotes during the version update. The old compilation from 2015 stopped working due to incompatibility with a new terminal. What is Squeeze? A contraction of the Bollinger Bands inside the Keltner Channel reflects a market taking a break and consolidating, and is usually seen as a potential leading indicator of subsequent directional movement or large oscillation movement. When Bollinger bands leave Keltn

What is Squeeze? A contraction of the Bollinger Bands inside the Keltner Channel reflects a market taking a break and consolidating, and is usually seen as a potential leading indicator of subsequent directional movement or large oscillation movement. When Bollinger bands leave Keltner Channel it means markets switching from a low volatility to high volatility and high volatility are something all traders are looking for. What I was missing in some indicators is possibility of monitoring many ti

Controladora means in Spanish controller, this is a simple yet powerful Expert Advisor that allows you to control your trading easily and precisely. Do you want to stop your trade when the price cross a trend line? Don't worry, Controladora can do it. Do you want to take profit when the price reaches the top of a channel? Controladora can do it as well. Calculating the exact proportion of your account by opening a trade, which size represents in case of loss a percentage of your balance, is time

The purpose of this new version of the MT4 standard indicator provided in your platform is to display in a sub-window multiple timeframes of the same indicator. See the example shown in the picture below. But the display isn’t like a simple MTF indicator. This is the real display of the indicator on its timeframe. Here's the options available in the FFx indicator: Select the timeframes to be displayed (M1 to Monthly) Define the width (number of bars) for each timeframe box Alert pop up/sound/ema
FREE
The MetaTrader Market offers a convenient and secure venue to buy applications for the MetaTrader platform. Download free demo versions of Expert Advisors and indicators right from your terminal for testing in the Strategy Tester.
Test applications in different modes to monitor the performance and make a payment for the product you want using the MQL5.community Payment System.
You are missing trading opportunities:
- Free trading apps
- Over 8,000 signals for copying
- Economic news for exploring financial markets
Registration
Log in
If you do not have an account, please register
Allow the use of cookies to log in to the MQL5.com website.
Please enable the necessary setting in your browser, otherwise you will not be able to log in.