from EA plot ask/bid prices on current chart
pkoral:
OBJ_CHART
In my EA I'd like to plot on current chart. For example I'd like to draw ask/bid price in `onTick()` function.
How should I start to achieve it?

Documentation on MQL5: Constants, Enumerations and Structures / Objects Constants / Object Types / OBJ_CHART
- www.mql5.com
OBJ_CHART - Object Types - Objects Constants - Constants, Enumerations and Structures - MQL5 Reference - Reference on algorithmic/automated trading language for MetaTrader 5
pkoral:
In my EA I'd like to plot on current chart. For example I'd like to draw ask/bid price in `onTick()` function.
How should I start to achieve it?
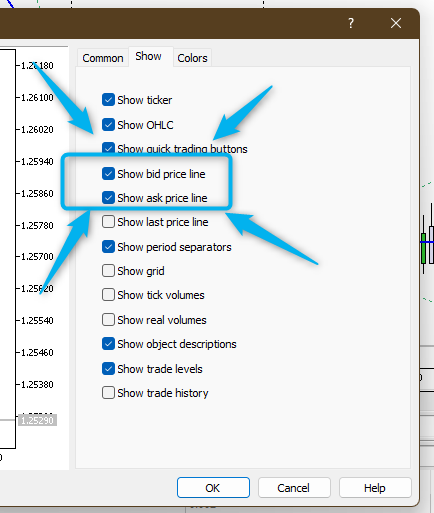
or just right click chart goto properties and tick show bid/ask instead.
Bid ans adk prices are just examples. Let's say I want to draw only a chart with coordinates:
X = current time (in OnTick)
Y = bid-10*_Point
And I want to see them in strategy tester window.
How to draw plots?
Create a custom indicator, then you can access to its value(s) anytime. Its value appears in data window for easy reading.
U can also use CreateObjects function to draw objects
You are missing trading opportunities:
- Free trading apps
- Over 8,000 signals for copying
- Economic news for exploring financial markets
Registration
Log in
You agree to website policy and terms of use
If you do not have an account, please register
In my EA I'd like to plot on current chart. For example I'd like to draw ask/bid price in `onTick()` function.
How should I start to achieve it?