Fibonacci line tool
Dear forum users, especially those who trade using Fibonacci lines!
Please share your experiences on how/by an additional tool to identify strong Fibonacci levels. I've been using Fibonacci lines for a long time myself, but not all of the expected levels work out the way I'd like them to.
Because it's just as bad as Elliott waves )
Because it's as fucked up as Elliott waves )
There are 13 patterns in Elliott Waves, any development will fall under one of them, which makes it harder to master the whole technique. But that is another question.
I am now interested in some simple method to determine the importance of one of the levels. If not Fibonacci, maybe someone combines horizontal/trend lines with some method to confirm the significance of the lines.
Because it's as bad as Elliott Waves)
As well as the rest of TA, which is more like a religious doctrine (guess who its preachers are). Quite recently I have been modeling the predictive properties of TA elements at different time intervals, including candlestick analysis and MA, and not a simple one, but rather a complex one, which I use myself. The results are that TA and its elements have no predictive properties - deviations up and down are absolutely equal. I will show you a picture, it doesn't matter what it is based on, they are all absolutely identical. Further price movement does not depend on the "readings" of indicators.
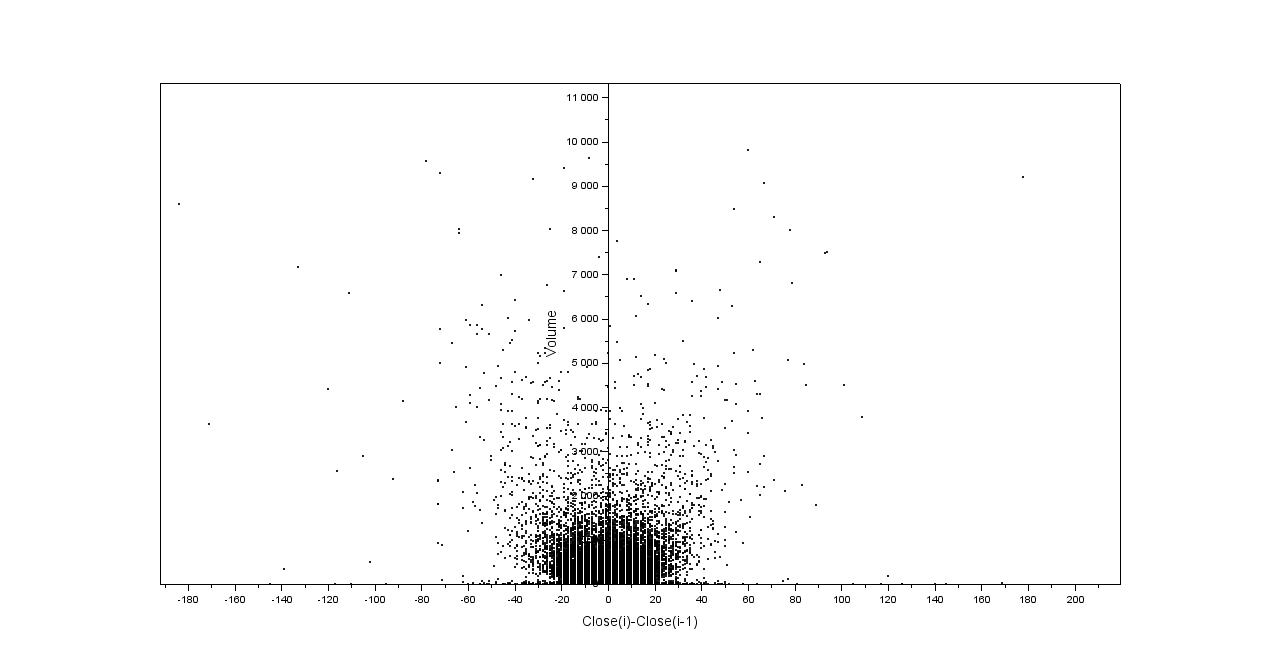
Good luck to you, TAS guys. The market is more complicated than you imagine.
I should add, for the sake of clarity, - I'm dealing exclusively with scalping and intraday.
You just need to understand what to use TA for and combine it with more real data. then the result becomes much more interesting... in particular for scalping and grid trading.
i wish i was a programmer... i would have tested a lot of ideas =)
Too bad I'm not a programmer... I'd have tested a lot of ideas =)
There are 13 patterns in Elliott Waves, any development will fall under one of them, which makes it harder to master the whole technique. But that is another question.
I am now interested in some simple method to determine the importance of one of the levels. If not by Fibonacci, maybe someone combines horizontal/trend lines with some method to confirm the significance of the lines.
Waves are difficult to determine programmatically. And on the subject of Fibonacci:
I tried to find the current section to be ascending (i.e. absolute maximum is fresher than the absolute minimum) and to measure correction from the maximum and enter by it, for shorts it's vice versa.
Different variations for example:
a certain percentage of the maximum correction in the gap where the minimum and the maximum were set after the extremum,
adding shift filtering to make the correction higher or lower than it,
crossing the stock chart, etc.
I did not find anything interesting.
.....
Didn't find anything of interest.
Waves are difficult to define programmatically. As for Fibonacci:
I tried to find that the current section was rising (i.e. the absolute maximum is fresher than the absolute minimum) and from the maximum to measure the correction and to enter by it, for shorts it is vice versa.
Different variations for example:
a certain percentage of the maximum correction in the gap where the minimum and the maximum were set after the extremum,
adding shift filtering to make the correction higher or lower than it,
crossing the stock chart, etc.
I did not find anything interesting.
- Free trading apps
- Over 8,000 signals for copying
- Economic news for exploring financial markets
You agree to website policy and terms of use
Dear forum users, especially those who trade using Fibonacci lines!
Please share your experiences on how/by an additional tool to identify strong Fibonacci levels. I've been using Fibonacci lines for a long time myself, but not all of the expected levels work out the way I'd like them to.