About MT5 code profiler
Dominik Egert:
Q2: Other references arithmetic operations inside your code. Basics like addition, subtraction.
Q3: The counter also includes the calls to the function CopyHistoryData itself. Thus the calls inside will not sum up to the overall total.
Not possible. And anyway it's not coherent with the documentation. 1 measurement could not count more than 1 tick.
For my own analysis, I do measurements myself, it gives a much better picture of where the time is spent.
But, yes I will read the docs...
For my own analysis, I do measurements myself, it gives a much better picture of where the time is spent.
But, yes I will read the docs...
Before doing my own measurements I want to check and test the new profiler in depth. In my opinion it's promising, but for sure it needs to be reliable. It also needs some practice to understand how to use it.
Any help would be welcome, always more in several head than in one.
Up to now the profiler doesn't make any sense to me. Example :
Profilling on History data.
2021.07.10 08:00:37.101 MQL5 profiler 39289 total measurements, 0/0 errors, 141 mb of stack memory analyzed (93304/1073741824)
2021.07.10 08:00:37.101 MQL5 profiler 464876 total function frames found (39328 mql5 code, 30115 built-in, 269752 other, 125681 system)
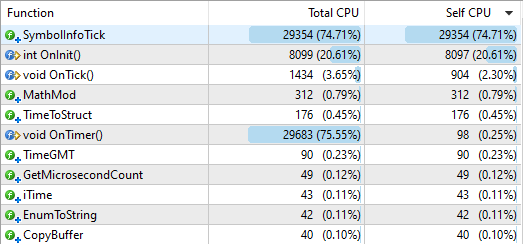
On the line of code with SymbolInfoTick a tooltip says : Total CPU : 29353 (99.85%) Self CPU : 0 (0.00%)
The backtest is executed in :
2021.07.10 08:00:37.101 Core 01 EURUSD,H1: 230861 ticks, 998 bars generated. Environment synchronized in 0:00:00.144. Test passed in 0:03:09.367 (including ticks preprocessing 0:00:00.515).
I added code to measure SymbolInfoTick() execution time with GetMicrosecondCount().
      ulong start=GetMicrosecondCount();

      //--- Get tick information
      if(!SymbolInfoTick(symbol,tick))
         return(false);

      BENCH += GetMicrosecondCount()-start;
Result is :
2021.07.10 08:00:37.101 Core 01 2021.05.30 23:59:59 Total = 1209572 Executed = 836973 in 661874 microseconds
So SymbolInfoTick() in total took 661 milliseconds on 3 minutes 9 seconds backtest. Still the profiler shows it's using 74.71% of the measurements. How is that accurate or useful is beyond my mind.
Up to now the profiler doesn't make any sense to me. Example :
Profilling on History data.
2021.07.10 08:00:37.101 MQL5 profiler 39289 total measurements, 0/0 errors, 141 mb of stack memory analyzed (93304/1073741824)
2021.07.10 08:00:37.101 MQL5 profiler 464876 total function frames found (39328 mql5 code, 30115 built-in, 269752 other, 125681 system)
On the line of code with SymbolInfoTick a tooltip says : Total CPU : 29353 (99.85%) Self CPU : 0 (0.00%)
The backtest is executed in :
2021.07.10 08:00:37.101 Core 01 EURUSD,H1: 230861 ticks, 998 bars generated. Environment synchronized in 0:00:00.144. Test passed in 0:03:09.367 (including ticks preprocessing 0:00:00.515).
I added code to measure SymbolInfoTick() execution time with GetMicrosecondCount().
Result is :
2021.07.10 08:00:37.101 Core 01 2021.05.30 23:59:59 Total = 1209572 Executed = 836973 in 661874 microseconds
So SymbolInfoTick() in total took 661 milliseconds on 3 minutes 9 seconds backtest. Still the profiler shows it's using 74.71% of the measurements. How is that accurate or useful is beyond my mind.
So much about the profiler... Ive read up the docs and tried to make an understanding for myself and currently I figure out following.
The documentation is, as almost all technical docs, prebiased by the developers and the main concept in place. I looked up wikipedia, here: https://en.wikipedia.org/wiki/Profiling_(computer_programming)
According tho the article, I would categorize mqls profiler as an statistical profiler. This makes sense for the use case. When thinking about how this profiler works, and according to the documentation, found here: https://www.metatrader5.com/en/metaeditor/help/development/profiling
the main algorithm loop is MT5-Strategy-Tester -> EA -> OnInit() -> MT5 -> OnTick() -> MT5 ... MT5 -> OnDeinit()
At least as a simple schema for understanding the workflow.
The main time spent while executing will be (very most probably) inside MT5 code block. While the time measured inside the EA is in total refering to the values of the Code Profiler from MT5 Editor.
This means, the Profiler is working with a long code flow chain, which will be "snapshotted" while running -> sampling. Taken fom log and documentation. Sampling is used for statistical profiling.
Following this thought, we can now conclude how these values could be interpreted on the background of this assumption.
The total time spent inside the EA is given as 100%, this will now be split as percentage used over certain functions.
The value of "Self" is to be seen as the time that has been spent on this function.
Time was measured to an average value of the reported samples which have been taken while the algorithm was executing the above shown loop.
So the amount of samples is indipendent from the amount of apprearances of a functions on the call stack. as these will be counted within the execution path and therefore should be an accurate number.
The selection of functions and "hooking" the results into the source code, is important for the type of analysis, which the developer wants to conduct.
Since we already know which profiling technique seems to be in use, we might be able to determine the way how functions are selected for tracing.
I will skip this part, since it is obviusly visible in the given screenshots.
But for short, top node elements in the list get the percentage time assigned on the value "Self", more detailed times have not been recorded inside this function, no tracedepth data available. - This seems reasonable, since the tracecode could interfere with the flowtimes of the client code. - Read up on wiki.
My interpretation of Total includes also the times spent inside the MT5 block, when calling an API-Function and therefore branching out of the EA execution block into the MT5 block, shortly after returning back to the EA, most probably processing the received data in some way.
I assume, it is not an easy task to configure a profiler and make it useful when being faced with unknown variations of algorithms and to be able to identify any useful hooks i nthe client source code. So results obviously are not all to useful, although the profiler tries its best as it seems.
Please add your conclusions as well, maybe we get the full picture.
Not sure what are all these explanations (sorry I know the theory, that's not the point). The profiler method is clear, there is no problem with the concept... In practice it gives discrepancies and contradictions, so up to now I can't do anything with it.
The full picture for now is the profiler is buggy. The EA is not spending 74.71% of it's time in SymbolInfoTick() it doesn't make sense at all. In the meantime I found the explanation and without any doubt it's a bug :
SymbolInfoTick() was used on an other place in the code (just at the start, called 1 time), and the % probably comes from here, but as both call "share" the same value, it makes me think there was a problem with my main call to SymbolInfoTick(), and so I lost hours and hours to figure it out.An other example of weird data.

The global stats says SymbolInfoTick() was 209 times on the call stack. But inside the code it says 210. Nice precision.
The global stats says the sampling reach SymbolInfoTick 209 times (which is 0.83% of the total samples). Ok. Now the data on the code says it reached it 1 time (which is now 1.49%, so refering to an other total, which one ?). After calculating 1 being 1.49% means the total (100%) is 67. So 1.49% refers to OnTimer() which is well the main function in this case. But how could it be possible to have 1 there and 209 in global stats ?
Even if that's not bug, how could this be useful quickly (what a profiler is supposed to be in my opinion) ?
An other one
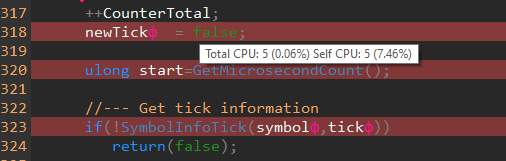
This is the line of code above SymbolInfoTick() as seen previously. So an assignment like newTick = false was "sampled" 5 times ! 5 more times then SymbolInfoTick() call ? Seriously ?
For my own analysis, I do measurements myself, it gives a much better picture of where the time is spent.
But, yes I will read the docs...
- Free trading apps
- Over 8,000 signals for copying
- Economic news for exploring financial markets
You agree to website policy and terms of use
Some questions about strange things on the data returned by the profiler.
Used on an EA running on historical data, the profiling report is :
2021.07.08 15:43:06.269 MQL5 profiler 139098 total measurements, 0/0 errors, 320 mb of stack memory analyzed (92848/1073741824)
2021.07.08 15:43:06.269 MQL5 profiler 982065 total function frames found (279627 mql5 code, 122460 built-in, 571051 other, 8927 system)
The results are (Functions by Calls) :
Q1. The report says 139098 measurements, but OnTick() Total CPU is 150026, how is that possible ? (however CopyHistoryData 80087 as 57.58% means correctly a 100% = 139098).
Q2. The report talk about 571,051 other "function". What are these functions if they are no mql nor built-in nor system ?
Q3. CopyHistoryData shows 80087 Total CPU, with 3 reported functions call (CopyHigh, CopyLow, CopyTime) having different total CPU, ok. However the Self CPU for these functions is the same and equal to the total CPU (call stack). It's seems incorrect data as on the 80087 (stacks) for CopyHistoryData, the sum for the 3 functions is 62,161 (44286+9448+8427), how call it be that on 62,161 calls, it detects 80,087 pauses on these 3 functions ? Not possible, the only explanation is this number is global for CopyHistoryData and so useless. I missed something ?