
|
6+ 年
经验
|
32
产品
|
136
演示版
|
|
0
工作
|
0
信号
|
0
订阅者
|
👑 理论物理学家,程序员,交易员,拥有15年的经验。
-------------------------------------------------------------
💰 生產的產品:
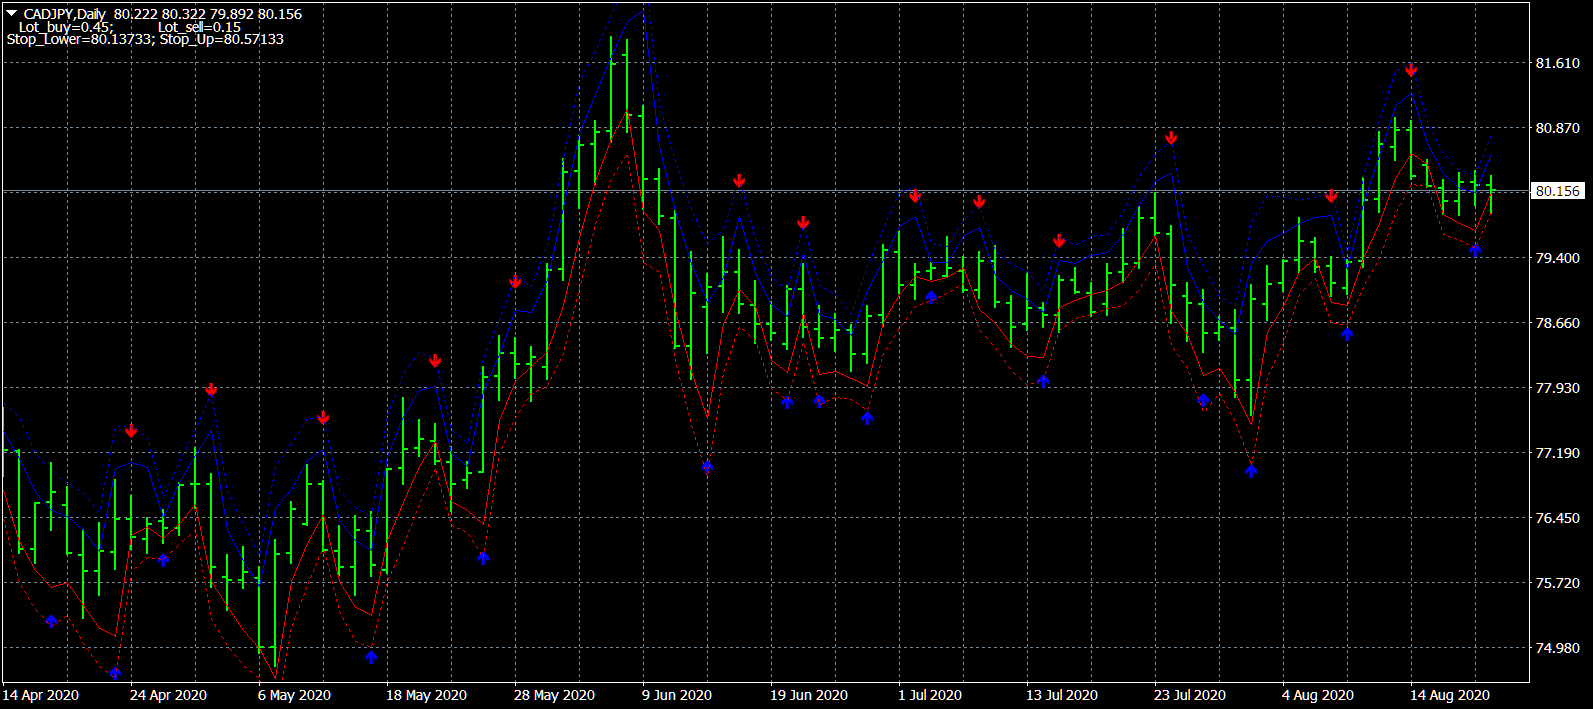
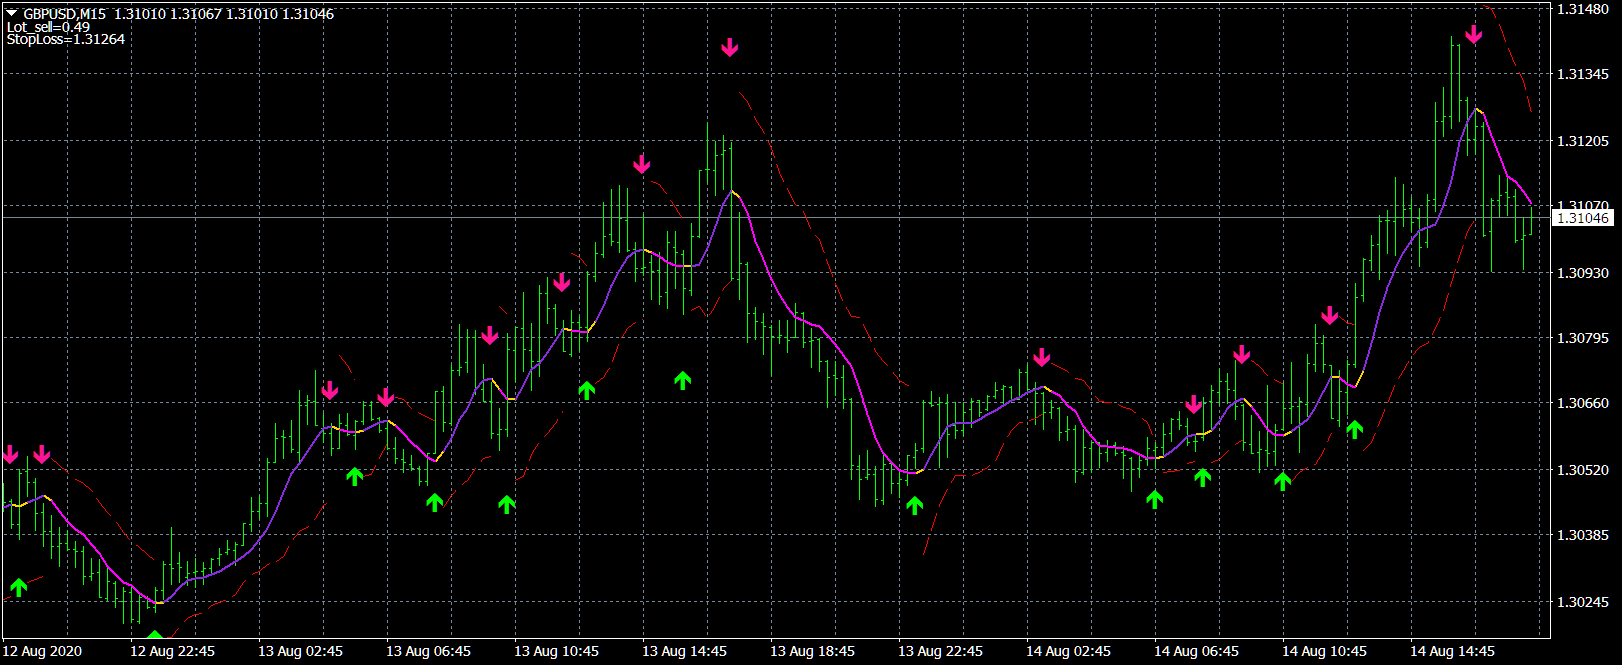
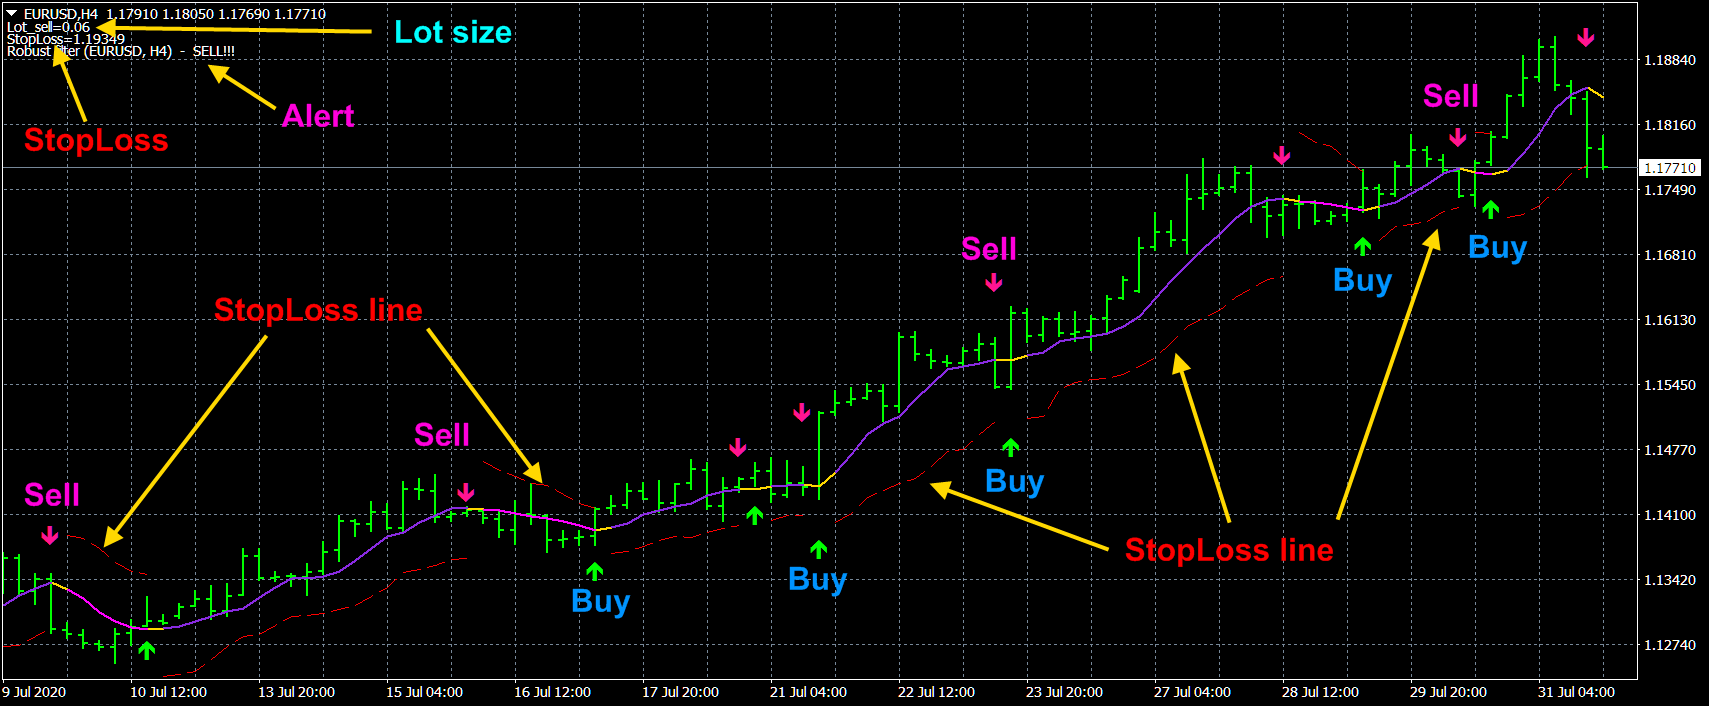
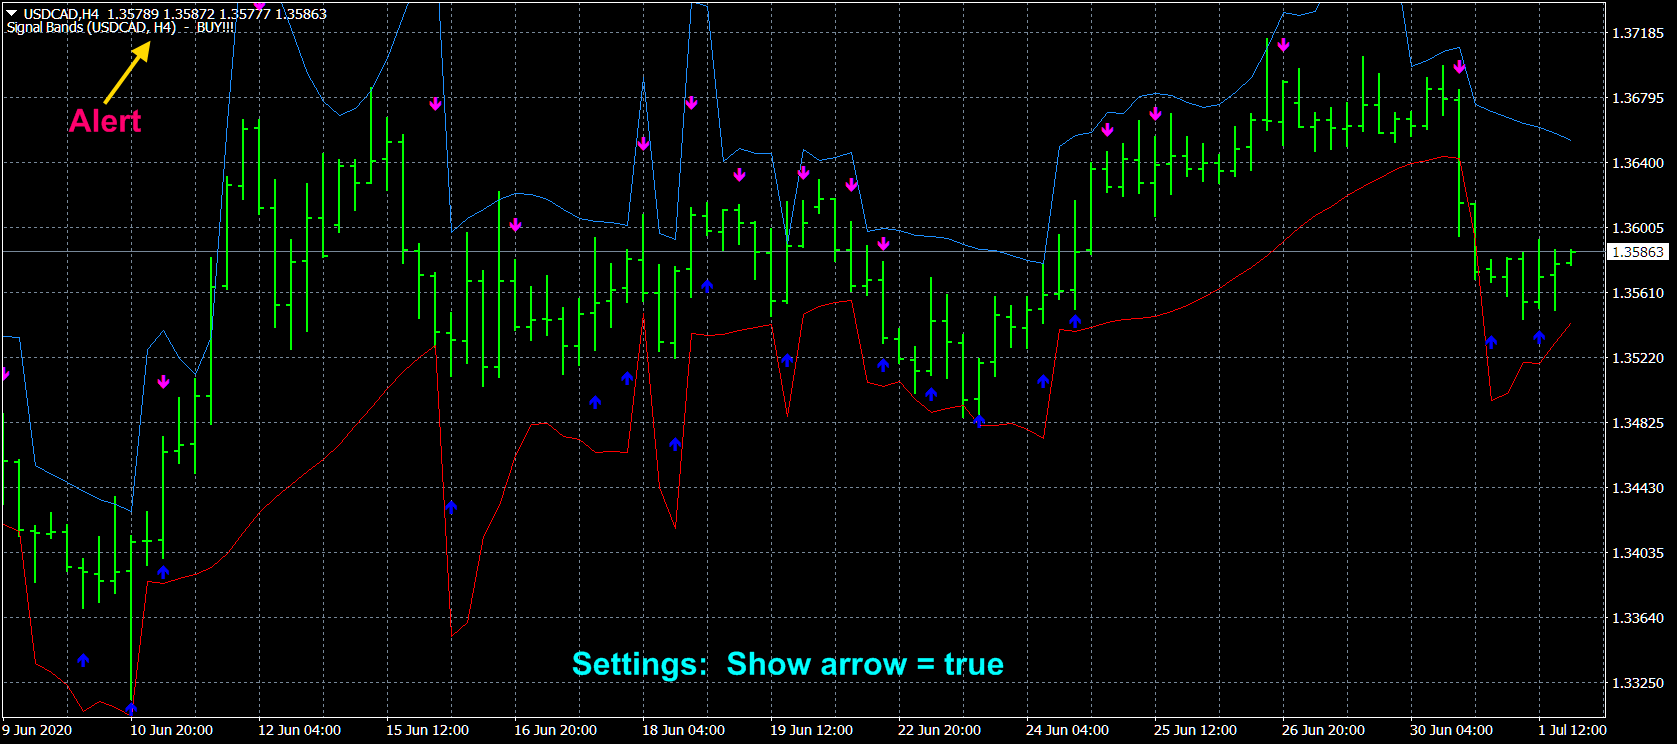
1) 🏆 具有对市场噪音进行最佳过滤的指标(用于选择开仓和平仓点)。
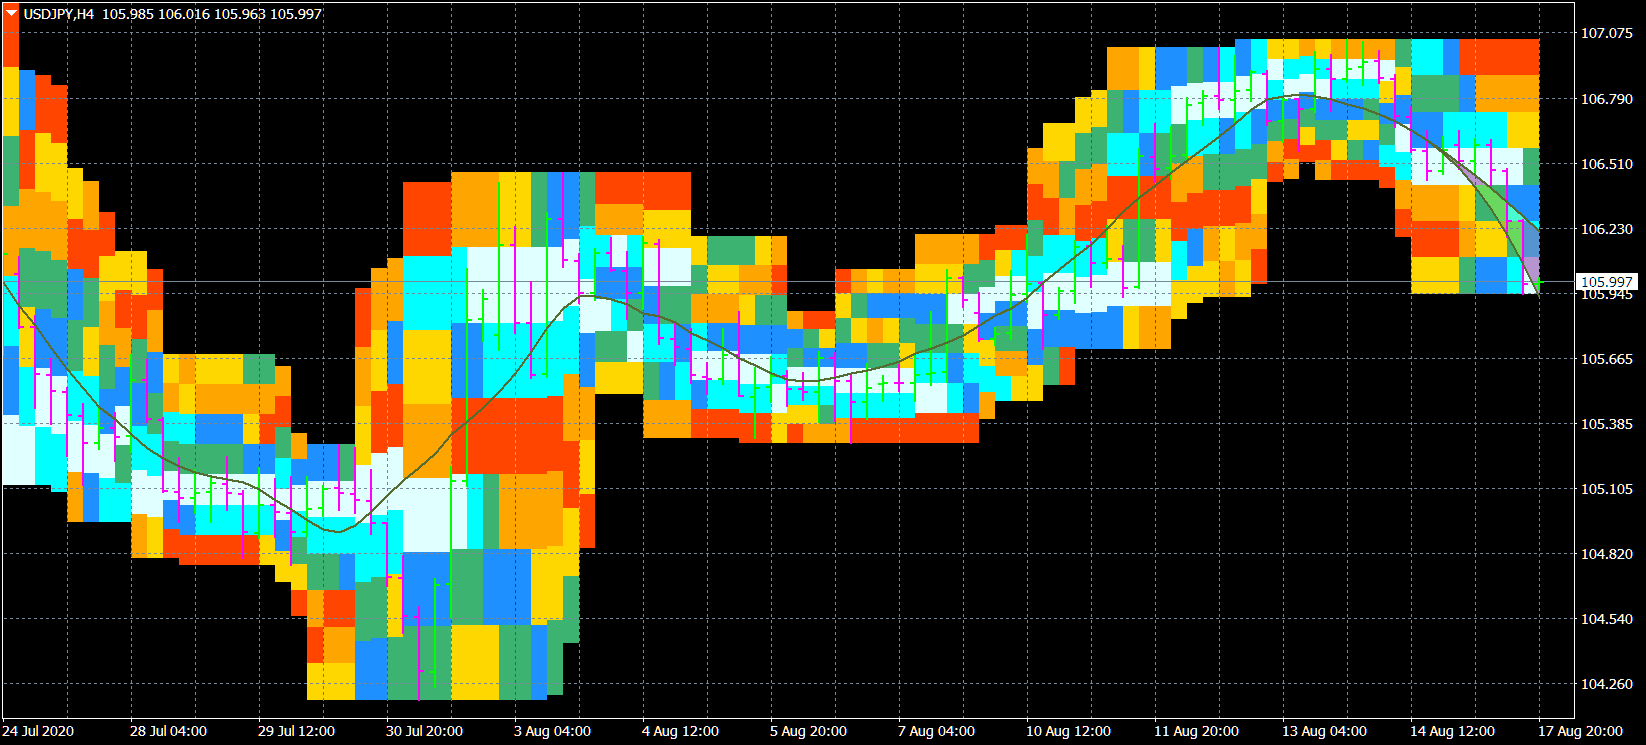
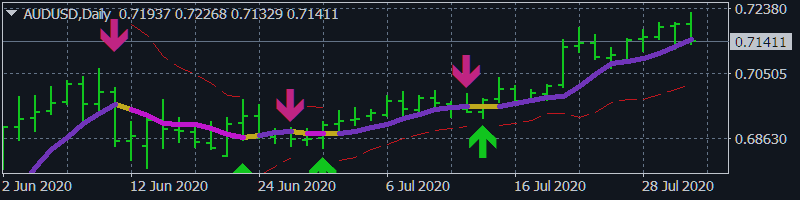
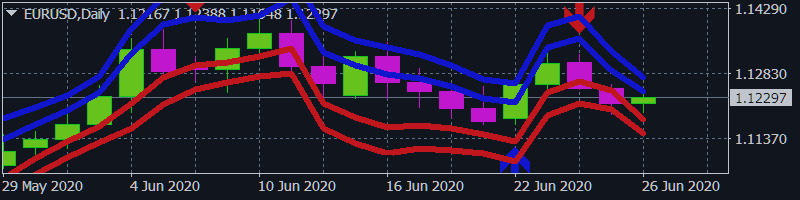
2) 🏆 统计指标(确定全球趋势)。
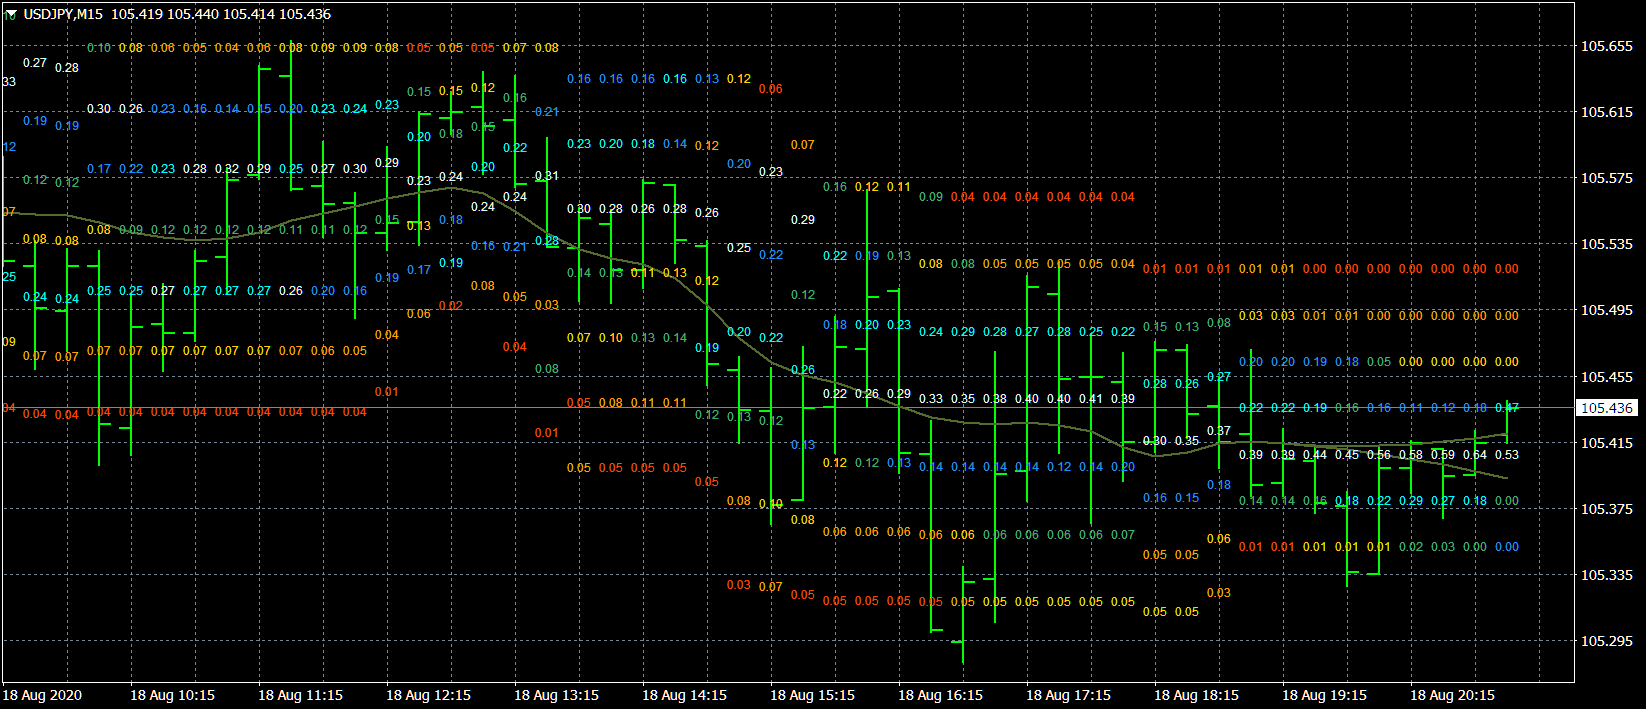
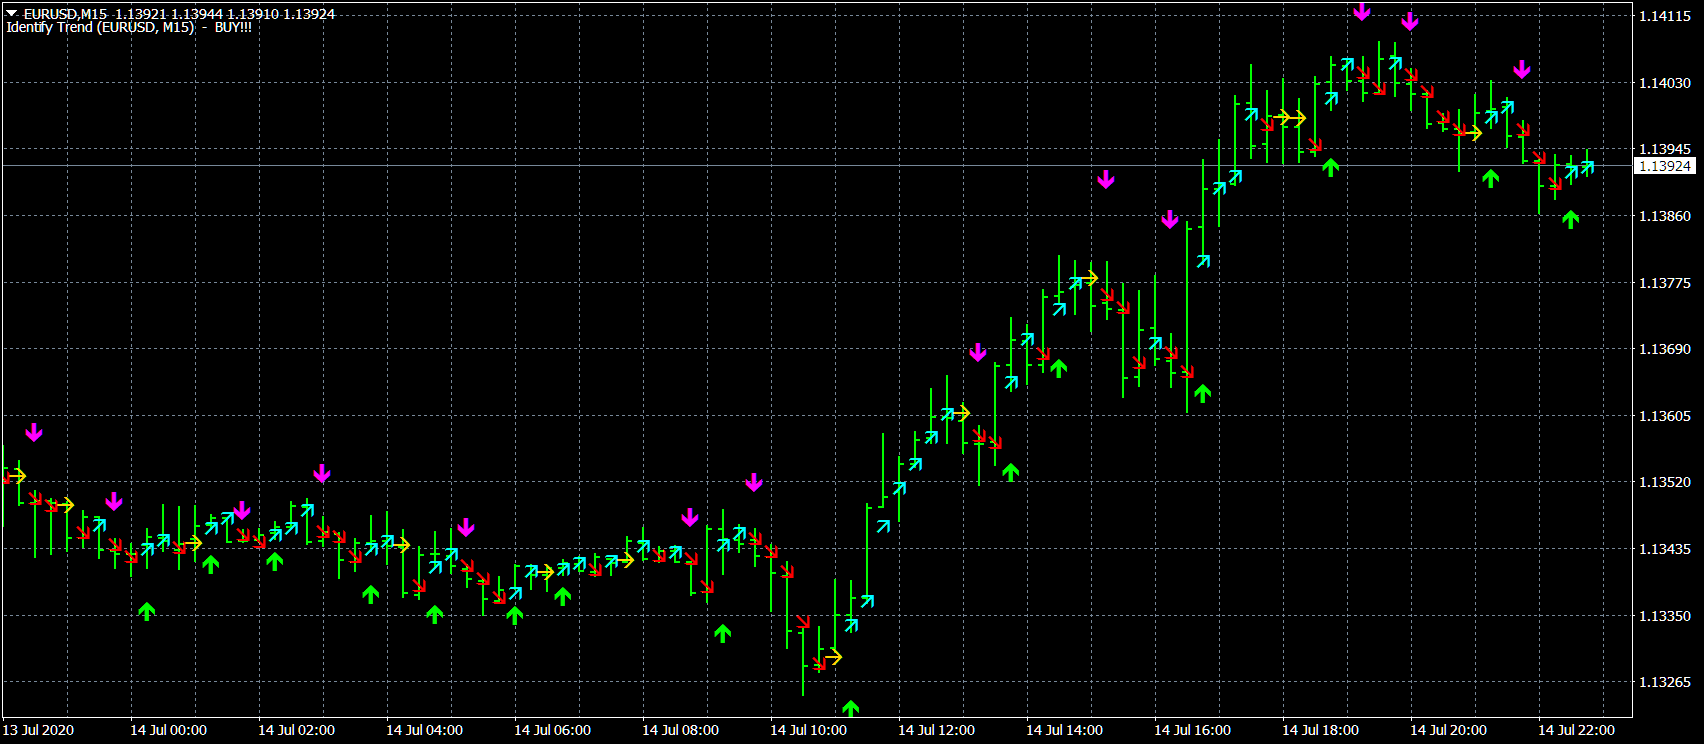
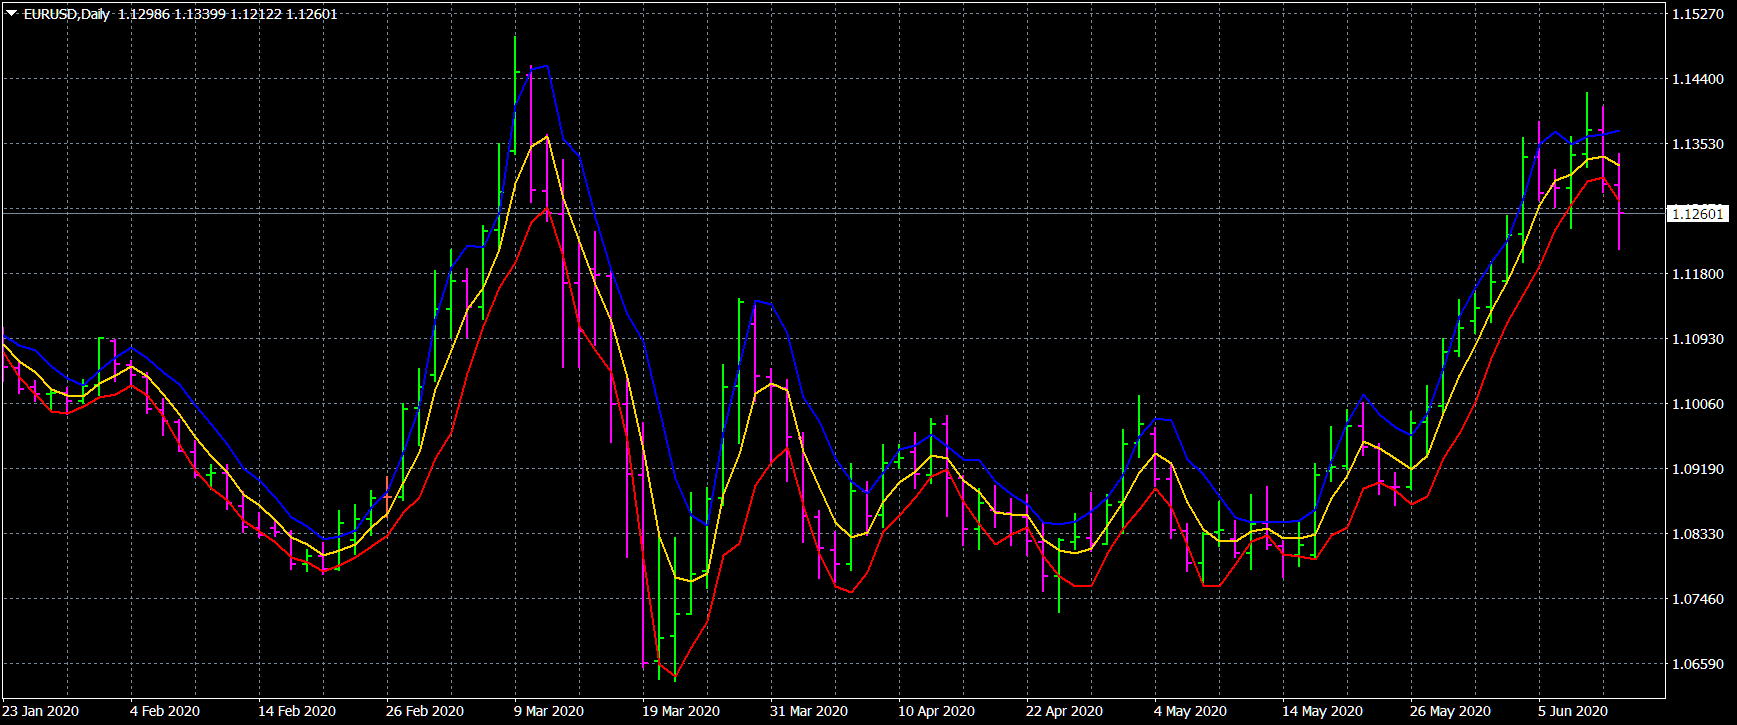
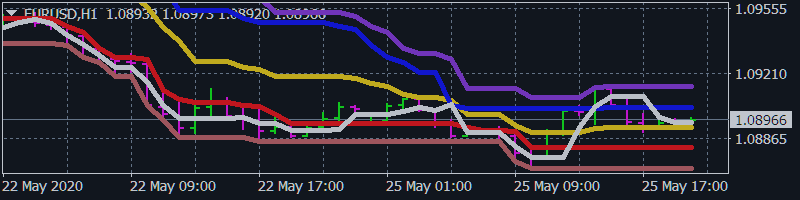
3) 🏆 市场研究指标(以澄清价格的微观结构,建立渠道,识别趋势反转和回调之间的差异)。
---------------------------------------------------------------------------
☛ 博客中的更多信息 https://www.mql5.com/en/blogs/post/741637
-------------------------------------------------------------
💰 生產的產品:
1) 🏆 具有对市场噪音进行最佳过滤的指标(用于选择开仓和平仓点)。
2) 🏆 统计指标(确定全球趋势)。
3) 🏆 市场研究指标(以澄清价格的微观结构,建立渠道,识别趋势反转和回调之间的差异)。
---------------------------------------------------------------------------
☛ 博客中的更多信息 https://www.mql5.com/en/blogs/post/741637

Aleksey Ivanov

· 2
Dirceu Francisco De Nadal
2020.07.02
I suggest create a (Tradeable Volatility Identifier), then we can use the bunch of EAs that depends on it and do not forecast volatility. This is the problem of all EAs that operates forex pairs. For example from a specific level and up a pair is tradeable, from the same specific level and down pair is not tradeable.


Aleksey Ivanov
· 1
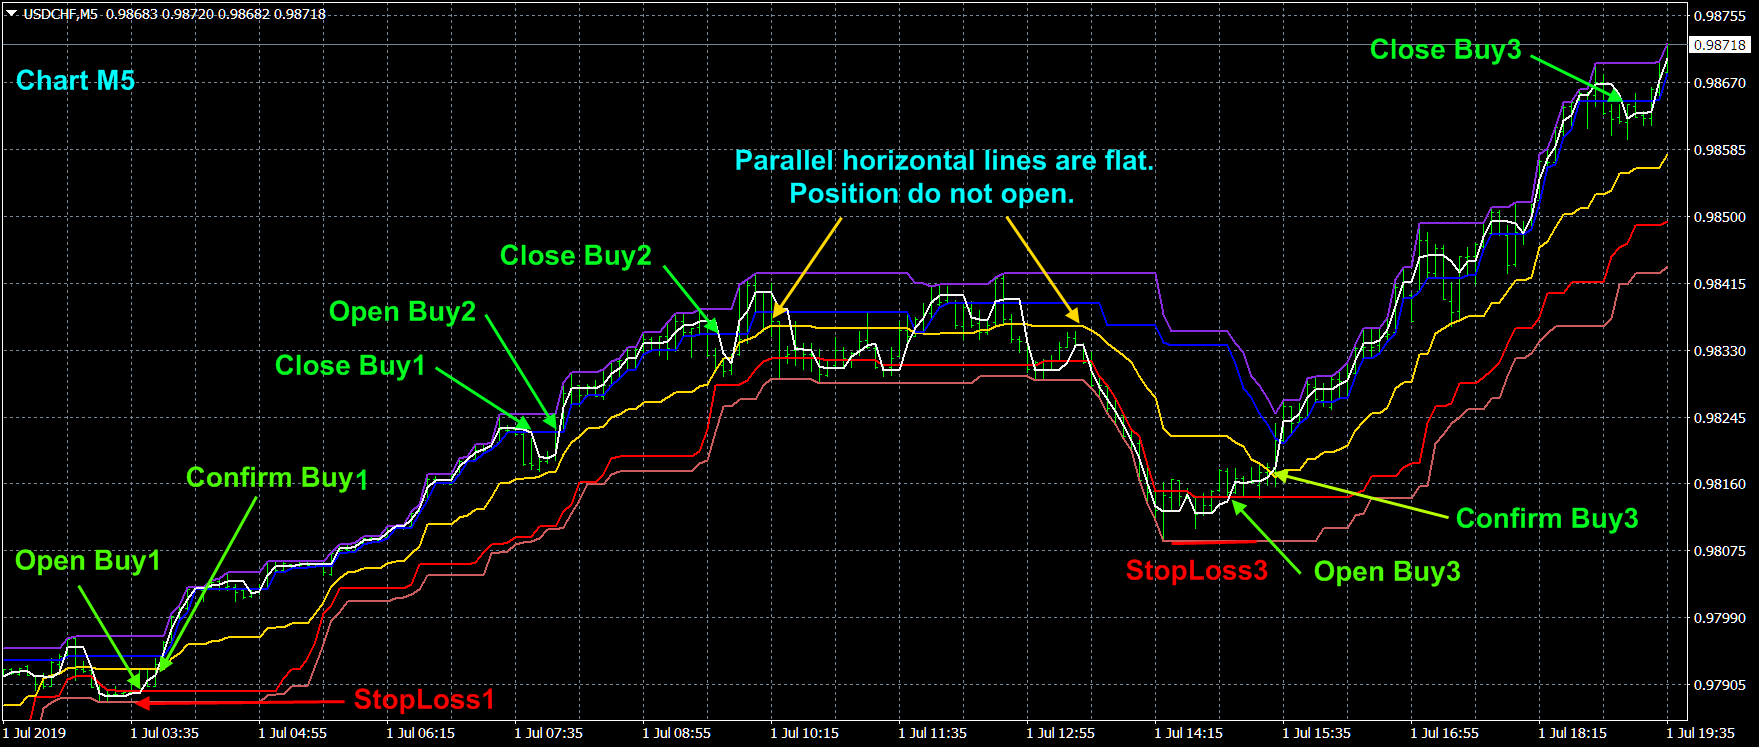
Aleksey Ivanov
2020.05.24
Here is a screenshot of a future blog describing how to work with this indicator. First, on a larger chart, the direction of the trend is determined, which is identified as a long-term upward trend, so you need to play to buy. Then, on the smaller tamframe already presented here, positions open to buy. At the end of the flat area, there is indeed a strong pullback; but we don’t play on the rollback in this strategy, because when it begins we cannot know how long it will last.
