
在 MetaTrader 5 中的连续期货合约

介绍
交易者不能在 MetaTrader 5 中创建自己的图表,它只能由交易商创建。交易者需要一个组合产品 – 连续期货合约。问题是只有交易商能够接续合约,并且只有交易商能够决定是否连接期货至给定的品种名。
幸运的是, 已关闭期货的历史可以在客户端一直存在。在客户端上使用历史数据来接续期货合约。
约定:
- 本文中所有数据, 绘图以及截图均基于真实的乌克兰股指期货。
- 本文中替换的、增加的代码片断将会用 颜色标记。例如:
//+------------------------------------------------------------------+
//|                                               This is an example |
//|                                               of the edited code |
//+------------------------------------------------------------------+
第一个问题: 日期覆盖
邻近期货的交易日期重叠。
意思是, 一个正在交易的期货, 有另外的期货尚有两个月才会关闭。

图例. 1. 期货合约的日期覆盖
图例显示,UX-3.14 期汇交易在 2013.09.16 开始, 尽管 UX-12.13 期货还在交易。
第二个问题: 选择接续方式
此处有两种接续方法:
- 简单追加 – 在当前品种的循环日期过期后,并且新的品种已经另外开盘。在图表上简单追加价格可以符合历史数值, 但所有相同日期会在特殊位置一直有价格间隙, 即图表不够平滑。

图例. 2. 接续。简单追加
- 偏移追加: 当前品种还有 5-10 日关闭,我们此时用下个品种的柱线替代这 5-10 根柱线。这 5-10 根柱线称为过渡周期。偏移追加会显示错误价格数值 (它们与当前品种不对应) 但是对比简单追加方法, 图表更加平滑。

图例. 3. 接续。偏移追加
客户端设置
在 "市场报价" 窗口期货会被降序排列:

图例. 4. 市场报价
编写指标
省缺指标会被放在 客户端数据文件夹\MQL5\Indicators 文件夹中。在 MyIndicators (在您打开的 \Indicators) 中创建 Synthetics 文件夹。它可以让您在标准库的 \Indicators 文件夹中节省空间,而且便于 MQL5 存储 启动指标同步。文件夹的最终路径看来像这样: 客户端数据文件夹\MQL5\Indicators\MyIndicators\Synthetics。
在 Synthetics 文件夹中创建新文件:

图例. 5. 创建指标新文件
设置新文件类型 - "自定义指标":

图例. 6. 新文件类型 - "自定义指标"
按 "下一步" 并打开 "自定义指标一般属性" 窗口。输入指标名称 - "SYNT", 加两个选项。第一个选项 "接续期货数量" 确定连接的品种数量。注意, "接续期货数量" 的最小可能数值为 2。第二个选项 "胶合型" 确定接续类型,指标省缺是 - "简单追加":

图例. 7. 自定义指标参数
注意 "胶合类型" 选项: 拼接可以是 "简单追加" 或 "偏移追加"。在这个阶段您不可以在这两个拼接类型列表上添加。这就是为什么预留省缺 "简单追加"。在 "SYNT" 指标代码编写时切换到 Later 选项来看看拼接类型的下拉菜单。
在下一窗口选择指标时间处理器:

图例. 8. 指标事件处理器
注释, 这个 OnTimer() 函数将用在 "SYNT" 指标中。指标的主要功能是在 OnTimer() 中设置。指标可以在图表上附加完成的交易 (不包括 OnCalculate 事件), 以及活跃交易。
按下 "下一步" 并在 "自定义指标程序绘图属性" 中点击 "指标在分离窗口":

图例. 9. "指标在分离窗口" 选项
按下 "完成" 按钮您可以看到 "SYNT" 指标模板。
组织下拉列表
为了让拼接类型显示为下拉列表您需要在指标选项中声明 ENUM_GLUING_TYPE 枚举类型。
在输入参数块的开始声明全局枚举类型:
#property indicator_separate_window
//+------------------------------------------------------------------+
//|  Splicing types enumeration                                      |
//+------------------------------------------------------------------+
enum ENUM_GLUING_TYPE
  {
   simple_addition,        // simple addition||simple addition
   addition_with_shift     // addition with shift||addition with shift
  };
//--- input parameters || input parameters
input ENUM_GLUING_TYPE  gluing_type=simple_addition;
//+------------------------------------------------------------------+
//| Custom indicator initialization function                         |
//+------------------------------------------------------------------+
现在您可以检查下拉列表如何显示。
您编译这个指标 (F7) 文件。现在, 加挂指标之后, 您可以看到在选项中下拉列表启动:

Fig. 10. 现在您的参数里已经有了
下拉列表
加入指标描述,它可以在指标首次加挂到图表时,或是更改属性时,显示在 "一般" 栏里:
#property version   "1.00"
//+------------------------------------------------------------------+
//| version   "1.00": The timer history swapping                     |
//+------------------------------------------------------------------+
#property description "Indicator for several futures splicing."
#property description "Is drawn in the latest futures window"
#property description "Uses N first symbols for drawing"
#property description "which were taken from the \"Market review\"."

#property indicator_separate_window
指标构造方法 - DRAW_COLOR_CANDLES - 彩色蜡烛。
您需要 4 个指标缓存区和 1 个保存颜色索引的缓存区。指标线风格 - STYLE_SOLID - 实线。在指标代码中显示所有:
#property description "taken from the \"Market review\"."

//--- indicator settings || indicator settings
#property indicator_separate_window
#property indicator_buffers 5
#property indicator_plots   1
//--- plot Bars || bars plotting
#property indicator_label1    "SYNT"
#property indicator_type1     DRAW_COLOR_CANDLES
#property indicator_style1    STYLE_SOLID
#property indicator_width1    1
//+------------------------------------------------------------------+
//|  enumeration of splicing methods                                 |
//+------------------------------------------------------------------+
输入 "number_futures_gluing" 输入参数 - 需要构造的品种数量。省缺 "number_futures_gluing" 值等于 2:
//--- input parameters || input parameters
input int               numder_futures_gluing=2;
input ENUM_GLUING_TYPE  gluing_type=simple_addition;
声明 4 个指标缓存区, 1 个缓存区保存颜色索引,以及 LoadHistory[] 辅助数组:
#property indicator_style1    STYLE_SOLID
#property indicator_width1    1
//--- indicator buffers || indicator buffers
double            OpenBuffer[];
double            HighBuffer[];
double            LowBuffer[];
double            CloseBuffer[];
double            ColorCandlesColors[];
double            LoadHistory[];
//+------------------------------------------------------------------+
//|  enumeration of splicing methods                                 |
//+------------------------------------------------------------------+
绑定指标缓存区与一维动态数组, 设置缓存区索引 作为 时间序列:
//--- indicator buffers mapping
//--- indicator buffers mapping
   SetIndexBuffer(0,OpenBuffer,INDICATOR_DATA);
   SetIndexBuffer(1,HighBuffer,INDICATOR_DATA);
   SetIndexBuffer(2,LowBuffer,INDICATOR_DATA);
   SetIndexBuffer(3,CloseBuffer,INDICATOR_DATA);
   SetIndexBuffer(4,ColorCandlesColors,INDICATOR_COLOR_INDEX);
   SetIndexBuffer(5,LoadHistory,INDICATOR_CALCULATIONS);
//--- set buffer indexing as timeseries
//--- set buffer indexing as in timeseries
   ArraySetAsSeries(OpenBuffer,true);
   ArraySetAsSeries(HighBuffer,true);
   ArraySetAsSeries(LowBuffer,true);
   ArraySetAsSeries(CloseBuffer,true);
   ArraySetAsSeries(ColorCandlesColors,true);
//---
   return(INIT_SUCCEEDED);
为了在 "数据窗口" 显示指标的序列名称 ("开盘价", "最高价", "最低价" 和 "收盘价"),您需要 s_symbol 变量:
input int               numder_futures_gluing=2;
input ENUM_GLUING_TYPE  gluing_type=simple_addition;
//--- symbol name
string s_symbol;
//+------------------------------------------------------------------+
//| Custom indicator initialization function                         |
//+------------------------------------------------------------------+
为了激活指标您需要 shft_array 变量和两个 good_history 及 indicator_rendered 标志:
input ENUM_GLUING_TYPE  gluing_type=simple_addition;
//--- symbol name
string   s_symbol;
int      shift_array=0;
bool     good_history=false;        //history is not prepared||history not prepared
bool     indicator_rendered=false;  // indicator is not drawn
//+------------------------------------------------------------------+
//| Custom indicator initialization function                         |
//+------------------------------------------------------------------+
之后设置指标并连接缓存区颜色索引至选择的颜色:
   ArraySetAsSeries(CloseBuffer,true);
   ArraySetAsSeries(ColorCandlesColors,true);
//--- set accuracy || accuracy of the indicator values
   IndicatorSetInteger(INDICATOR_DIGITS,0);
//--- set drawing line empty value || empty value of the drawing line
   PlotIndexSetDouble(0,PLOT_EMPTY_VALUE,0.0);
//--- set labels for the line || displayed name in the DataWindow
   PlotIndexSetString(0,PLOT_LABEL,s_symbol+" Open;"+s_symbol+" High;"+s_symbol+" Low;"+s_symbol+" Close");
   IndicatorSetString(INDICATOR_SHORTNAME,"SYNT");
//--- set number of colors in color buffer || number of colors in the buffer
   PlotIndexSetInteger(0,PLOT_COLOR_INDEXES,9);
//--- set line color || set the line color
   PlotIndexSetInteger(0,PLOT_LINE_COLOR,0,clrBlue);
   PlotIndexSetInteger(0,PLOT_LINE_COLOR,1,clrOrange);
   PlotIndexSetInteger(0,PLOT_LINE_COLOR,2,clrRed);
   PlotIndexSetInteger(0,PLOT_LINE_COLOR,3,clrGreen);
   PlotIndexSetInteger(0,PLOT_LINE_COLOR,4,clrPink);
   PlotIndexSetInteger(0,PLOT_LINE_COLOR,5,clrIndigo);
   PlotIndexSetInteger(0,PLOT_LINE_COLOR,6,clrPaleVioletRed);
   PlotIndexSetInteger(0,PLOT_LINE_COLOR,7,clrDarkViolet);
   PlotIndexSetInteger(0,PLOT_LINE_COLOR,8,clrDimGray);
//---
   return(INIT_SUCCEEDED);
定时器初始化为 3 秒间隔,并在 OnInit() 函数里生成随机数字:
   PlotIndexSetInteger(0,PLOT_LINE_COLOR,7,clrDarkViolet);
   PlotIndexSetInteger(0,PLOT_LINE_COLOR,8,clrDimGray);
//---
   EventSetTimer(3);
//--- random number generator initializor
   MathSrand(GetTickCount());
//---
   return(INIT_SUCCEEDED);
它需要至少两个品种来处理拼接。
在 OnCalculate() 函数里检查拼接品种数量:
                const long &tick_volume[],
                const long &volume[],
                const int &spread[])
  {
//--- checking the number of instruments || checking the number of instruments
   if(numder_futures_gluing<=1)
     {
      //--- create the message line
      string comm=StringFormat("For the indicator choose not less than %d symbols",numder_futures_gluing);
      //--- display the message in comment in the chart main window
      Comment(comm);
      return(0);
     }
//--- return value of prev_calculated for next call
   return(rates_total);
在您检查拼接品种数量之后,您还要检查是否指标已经绘制。如果指标已经绘制, 则您要退出 OnCalculate() :
      Comment(comm);
      return(0);
     }
   if(indicator_rendered==true) return(rates_total);
//--- return value of prev_calculated for next call
   return(rates_total);
由于 "SYNT" 指标主要用来分析日线发展趋势, 我考虑, 不需要在每个即时价位处理重计算事件。此处 "SYNT" 指标不会在每个即时价位进行计算。
此外,仅在下列情况下指标需要重新计算:
- 如果指标首次加载;
- 如果历史数据改变 (例如, 追加)。
   if(indicator_rendered==true) return(rates_total);
//--- if calculations were started the first time
//--- or if we need to calculate the indicator for two or more bars (changes in history)
//--- remember, that the "0" bar - is the left-most
   if(prev_calculated==0 || rates_total>prev_calculated+1)
     {
     }
//--- return value of prev_calculated for next call
   return(rates_total);
强制指标缓存区初始化
指标 "SYNT" 的缓存区连接到动态数组。
当指标首次启动, 缓存区被强制初始化。在 OnCalculate() 中继续初始化。为什么您需要在 OnCalculate() 里这么做, 而非在 OnInit?解释如下图解:
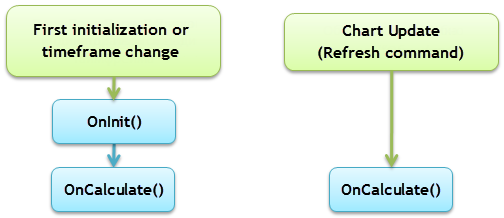
图例. 11. 数组在 OnCalculate() 中初始化
如您在图例.11 中所见, 这个 OnCalculate() 事件将在任何情况下发生, 而 OnInit() 仅在您通过 "更新" 命令更新图表时启动。所以, 数组初始化将会在 OnCalculate() 中进行:
//--- remember, that the "0" bar - is the left-most
   if(prev_calculated==0 || rates_total>prev_calculated+1)
     {
      //--- arrays initialization
      ArrayInitialize(OpenBuffer,0);
      ArrayInitialize(HighBuffer,0);
      ArrayInitialize(LowBuffer,0);
      ArrayInitialize(CloseBuffer,0);
     }
//--- return value of prev_calculated for next call
   return(rates_total);
此 ArrayInitialize() 函数初始化指标缓存区。在这种情况下初始化显示零。
如果您尝试初始化指标缓存区通过 EMPTY_VALUE , 您不可能在 "SYNT" 上拼接指标。
简单追加算法

图例. 12. 简单追加算法
图片中的日期是开始及结束日期 UX-9.13, UX-12.13 和 UX-3.14 期货循环。这些数据在表中呈现:
| 商品符号 | 循环开始 | 循环结束 |
|---|---|---|
| UX-9.13 | 2013.03.15 | 2013.09.16 |
| UX-12.13 | 2013.06.17 | 2013.12.16 |
| UX-3.14 | 2013.09.16 | 2014.03.17 |
在图例. 10 2013.12.25 日期 - 是真实日历日期。此 UX-3.14 品种依然有效。
"简单追加" 拼接方法将会在 SimpleAddition 函数里实现:
//+------------------------------------------------------------------+
//| Timer function                                                   |
//+------------------------------------------------------------------+
void OnTimer()
  {
//---
  }
//+------------------------------------------------------------------+
//| Simple addition                                                  |
//| Simple addition. Add in the indicator array                      |
//| sibmUP symbol                                                    |
//+------------------------------------------------------------------+
bool SimpleAddition(string simbUP,string simbDOWN,ENUM_TIMEFRAMES period,int Color)
  {
  }
//+------------------------------------------------------------------+
simbUP 是上边的期货, simbDOWN 是下边的期货, 它们两者均位于 "市场报价" 窗口。Color - 绘制期货的颜色。
SimpleAddition() 函数的完整代码给出如下:
//+------------------------------------------------------------------+
//| Simple addition                                                  |
//| Simple addition. Add in the indicator array                      |
//| sibmUP symbol                                                    |
//+------------------------------------------------------------------+
bool SimpleAddition(string simbUP,string simbDOWN,ENUM_TIMEFRAMES period,int Color)//////
  {
   datetime expiration_time_UP;     // simbUP symbol expiration date
   datetime expiration_time_DOWN;   // simbDOWN expiration date

   expiration_time_UP=int(SymbolInfoInteger(simbUP,SYMBOL_EXPIRATION_TIME));
   if(expiration_time_UP>TimeLocal())
     {
      expiration_time_UP=TimeLocal();
     }
   if(simbDOWN!="")
     {
      expiration_time_DOWN=int(SymbolInfoInteger(simbDOWN,SYMBOL_EXPIRATION_TIME));
     }
   else
     {
      expiration_time_DOWN=int(SymbolInfoInteger(simbUP,SYMBOL_START_TIME));
     }
//--- Open, High, Low and Close prices will be copied in the rates[] array
   MqlRates rates[];
   ArraySetAsSeries(rates,true);
   int copied=0;           //--- copied number
   copied=CopyRates(simbUP,period,expiration_time_DOWN,expiration_time_UP,rates);
   if(copied>0)
     {
      for(int j=shift_array;j<shift_array+copied;j++)
        {
         //--- write prices in buffers
         OpenBuffer[j]=rates[j-shift_array].open;
         HighBuffer[j]=rates[j-shift_array].high;
         LowBuffer[j]=rates[j-shift_array].low;
         CloseBuffer[j]=rates[j-shift_array].close;
         ColorCandlesColors[j]=Color;
        }
      shift_array=shift_array+copied;
      indicator_rendered=true;
      ChartRedraw();
     }
   else
     {
      Print("Unable to get the symbol history data",simbUP);
      indicator_rendered=false;
      return(false);
     }
//---  Simple addition end
   return(true);
  }
//+------------------------------------------------------------------+
偏移追加算法

Fig. 13. 偏移追加拼接算法
这个拼接算法, 对比简单追加, 在品种结束的前 10 天开始。此 "偏移追加" 拼接方法在 AdditionWithShift() 函数中处理:
//--- Simple addition end
   return(true);
  }
//+------------------------------------------------------------------+
//| Addition With Shift                                              |
//| Addition with Shift. Add in the indicator array only             |
//| sibmUP symbol                                                    |
//+------------------------------------------------------------------+
bool AdditionWithShift(string simbUP,string simbDOWN,ENUM_TIMEFRAMES period,int Color)
  {
//---
   return(true);
  }
//+------------------------------------------------------------------+
在 AdditionWithShift() 和 SimpleAddition() 函数之间的不同之处在这两行 - 您从日期中减去 10 天:
   .
   .
   .
   expiration_time_UP=int(SymbolInfoInteger(simbUP,SYMBOL_EXPIRATION_TIME))-86400*10;
   .
   .
   .
   expiration_time_DOWN=int(SymbolInfoInteger(simbDOWN,SYMBOL_EXPIRATION_TIME))-86400*10;
   .
   .
   .
由于代码的微小差别, 我无法显示 AdditionWithShift() 函数的完整代码, 您可以本文的指标文件中找到代码。
尽管在 AdditionWithShift() 和 SimpleAddition() 函数之间有这些微小差别, 如果您不能拼接它们来完成一个统一的函数,那这样更好 (有些情况下,如期货改变算法或者,例如,启动它用于测试)。
品种历史预加载
此 CheckLoadHistory() 函数复制 所有 品种历史数据至辅助缓存区 tmp_rates。
如果复制过程成功,则赋值 true 至 good_history 标志, 亦即您可以开始绘制指标。
//--- Addition With Shift end
   return(true);
  }
//+------------------------------------------------------------------+
//| Request to receive all history from a trade server               |
//| Request to recieve all history from a trade server               |
//+------------------------------------------------------------------+
bool CheckLoadHistory(string symbol,ENUM_TIMEFRAMES period)
  {
   MqlRates tmp_rates[];      // the Open, High, Low and Close prices will be copied in the rates[]array
   datetime start_time;       // start time of the instrument trades
   datetime expiration_time;  // expiration time of the instrument trade
   start_time=int(SymbolInfoInteger(symbol,SYMBOL_START_TIME));
   expiration_time=int(SymbolInfoInteger(symbol,SYMBOL_EXPIRATION_TIME));
   if(CopyRates(symbol,period,start_time,expiration_time,tmp_rates)>0)
     {
      good_history=true;
     }
   else
     {
      good_history=false;
     }
//---
   return(true);
  }
//+------------------------------------------------------------------+
您可以复制 所有 品种历史数据,因为期货生存期很短并且 所有 历史数据复制不会占用太多空间。
OnTimer - 指标主函数
现在您已经有了两种拼接方法的代码,以及历史数据加载代码, 所以您可以改变 OnTimer() 函数:
//+------------------------------------------------------------------+
//| Timer function                                                   |
//+------------------------------------------------------------------+
void OnTimer()
  {
   if(indicator_rendered==true) return;
   if(good_history==true)
     {
      int t=0;       // color || color
      int number;
      switch(gluing_type)
        {
         case simple_addition:
            for(int n=0;n<numder_futures_gluing;n++)
              {
               //--- get the random number
               number=MathRand();
               //--- get the color index as the modulo
               t=number%(PlotIndexGetInteger(0,PLOT_COLOR_INDEXES)-1);
               SimpleAddition(SymbolName(n,true),SymbolName(n+1,true),PERIOD_D1,t);
              }
            break;
         case addition_with_shift:
            for(int n=0;n<numder_futures_gluing;n++)
              {
               //--- get random number
               number=MathRand();
               //--- get the color index as the modulo
               t=number%(PlotIndexGetInteger(0,PLOT_COLOR_INDEXES)-1);
               AdditionWithShift(SymbolName(n,true),SymbolName(n+1,true),PERIOD_D1,t);
              }
            break;
        }
     }
   else
     {
      for(int n=0;n<numder_futures_gluing;n++)
        {
         CheckLoadHistory(SymbolName(n,true),PERIOD_D1);
        }
     }
  }
//+------------------------------------------------------------------+
指标构造。您可以编译它并加载到图表。最好选择关闭的品种并设在 H1 周期。
初始 "SYNT" 指标输入
当您在图表中加载两个不同拼接方法的 "SYNT" 指标模板之后, 您可以比较这些方法:
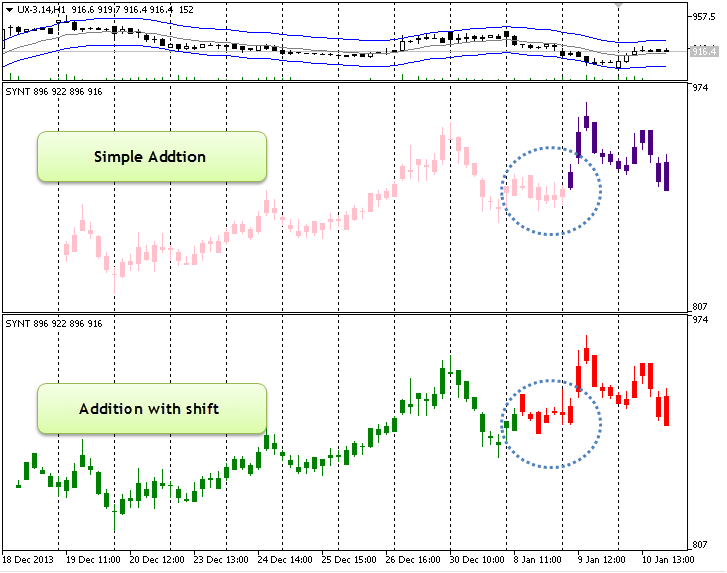
图利. 14. 期货的两种拼接方法比较
拼接指标的可能性 (标准和定制)
定制指标可以拼接 OnCalculate 的首次调用以及 "SYNT" 指标:
int OnCalculate (const int rates_total,      // size of the array price[]
                 const int prev_calculated,  // calculated bars during the previous call
                 const int begin,            // tangible data starting point
                 const double& price[]       // calculation array
   );
在 "浏览器" 窗口打开列表 "自定义指标"。之后打开列表 "例子", 选择指标并且把它放到 "SYNT" 中。在 "参数" 选卡从下拉列表中选择 "以前的指标数据"。
这列表里的指标您可以与 "SYNT" 指标拼接, 它们可以在 "SYNT" 里启动而不会出错:
此指标 "SYNT" 拼接三个加挂 自定义均线 指标的期货:

Fig. 15. 拼接三个品种的例子
结论
它很容易在日线图表中分析旧的开放品种。虽然技术指标的数量受到限制,这种方法有助于跟踪连续期货价格行为。
本文由MetaQuotes Ltd译自俄文
原文地址: https://www.mql5.com/ru/articles/802
 自动交易的传说: 是少或多?