Resistance Support Lines Pro
- Göstergeler
- Serhii Fertikov
- Sürüm: 1.7
- Güncellendi: 3 Ağustos 2023
- Etkinleştirmeler: 5
Gösterge, teknik olarak psikolojik destek/direnç çizgileri olan fraktal çizgileri hesaplar.
Aslında bunlar, belirli bir süre boyunca fiyatın en yüksek ve en düşük seviyeleridir.
Gösterge tüm grafiklerde ve zaman dilimlerinde çalışır.
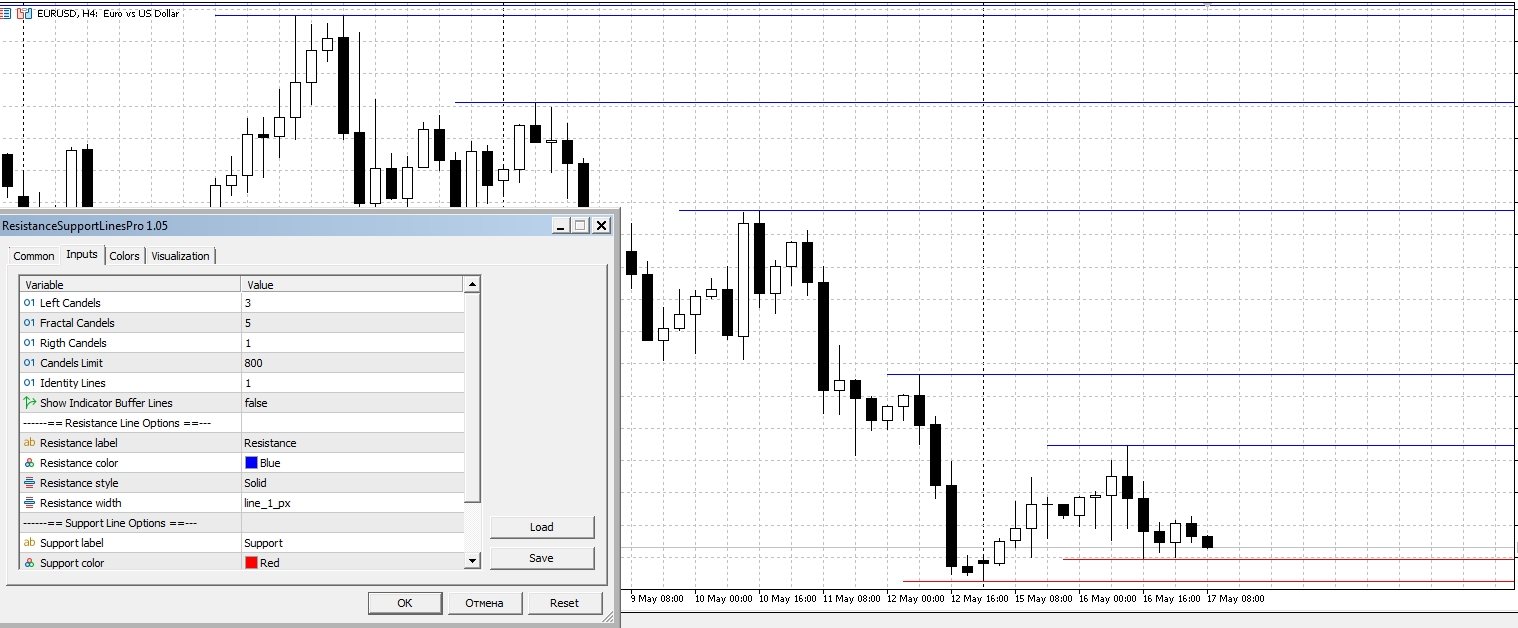
Ayarlar:
- Fractal Candels - temelinde bir fraktalın oluşturulduğu mum çubuklarının sayısı. Psikolojik fiyatın hesaplanabileceği maksimum/minimum değeri hesaplar
- Rigth Candels - yanlış fraktalların sağına doğru filtrelendiği mum sayısı
- Left Candels - yanlış fraktalların soluna doğru filtrelendiği mum sayısı
- Candels Limit - göstergenin çalıştığı son mum sayısı. Varsayılan ayar optimaldir. Daha uzun bir süre için daha fazla satıra ihtiyacınız varsa, bu değeri artırın.
- Identity Lines - aynı tipteki iki çizgi arasındaki minimum mesafedir. Bu katsayı, fiyat olarak yakın olan hatların sayısını azaltır.
- ... gelişmiş renk ayarları ve grafik üzerinde görüntüleme stilleri
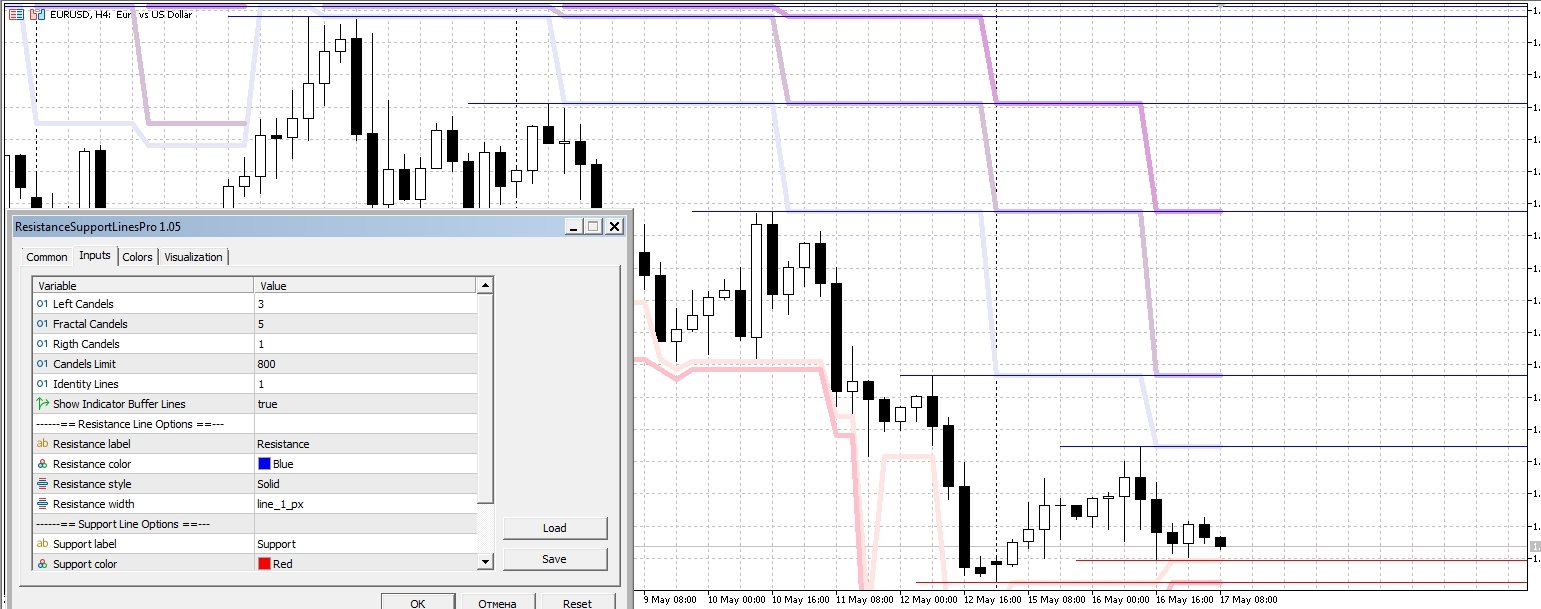
Önceden oluşturulmuş çizgi fiyat tarafından kırılırsa, kesilir ve grafikte bir süre daha kalır, ardından bu segmentler grafikten silinir. Gösterge tamponu için bu çizginin varlığı sona erer.
Uzmanlarda ve diğer komut dosyalarında kullanın:
Göstergenin bu sürümü gösterge tamponları ile birlikte gelir ve otomatik ticaret için EA'larınızda kullanılabilir.
Göstergede toplamda 6 tampon vardır (dirençler için 3 ve destekler için 3): 0,2,4 - direnç çizgisi tamponlarının indeksleri; 1,3,5 - destek çizgisi tamponlarının indeksleri, burada 0 en yakın direnç çizgisidir ve 4 uzak çizgidir.
İletişim:
Herhangi bir sorunuz varsa veya yardıma ihtiyacınız varsa, lütfen özel mesaj yoluyla benimle iletişime geçin.
Автор:
Fertikov Serhii, Göstergelerimin, danışmanlarımın, komut dosyalarımın daha fazlası satıcı profilinde mevcuttur.