Big Figure Indicator
- Göstergeler
- Vonjinirina Alfred Randrianiaina
- Sürüm: 1.2
- Güncellendi: 10 Nisan 2023
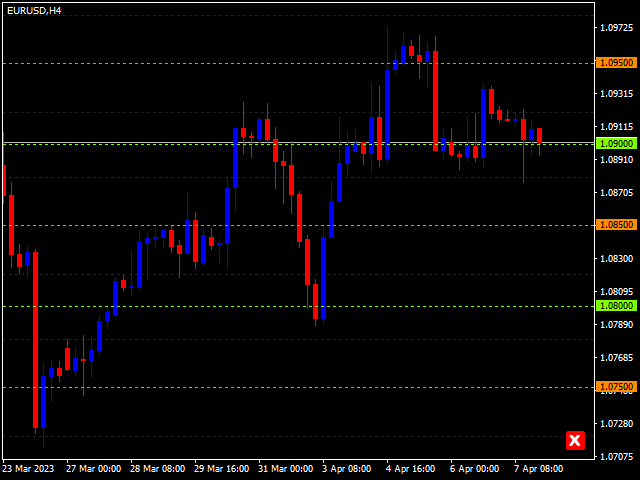
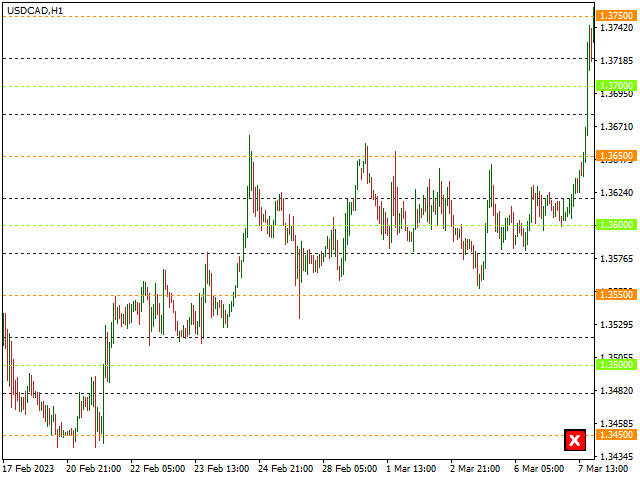
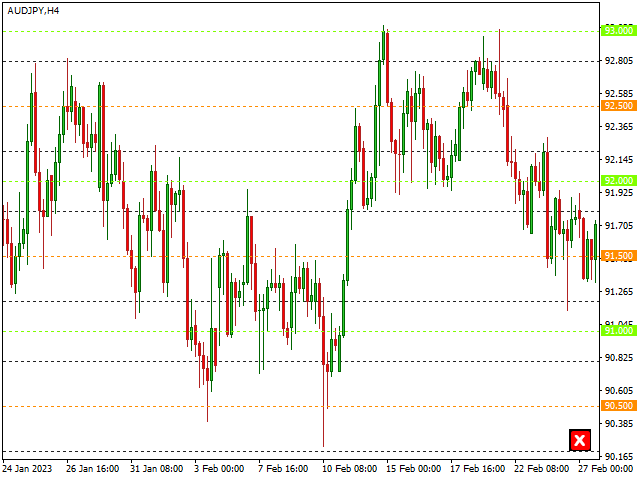
"BIG FIGURE INDICATOR", otomatik olarak fiyat grafiklerindeki belirli seviyelerde yatay çizgiler tanımlar ve çizer; örneğin, bütün sayılar veya yarım sayılar gibi (örneğin, para birimi işlemlerinde 1.0000 veya 1.5000). Bu seviyeler, büyük tüccarların ve yatırımcıların odaklanabileceği yuvarlak sayıları temsil ettikleri için psikolojik olarak önemli kabul edilir ve potansiyel destek veya direnç seviyelerine yol açabilir. Büyük rakam göstergesi, tüccarların önemli fiyat seviyelerini belirlemelerine ve bu seviyelere dayalı işlem kararları almalarına yardımcı olabilir.
Çizgiler sadece M1 ve H4 ZAMAN ÇERÇEVESİ Grafikleri arasında görülebilir
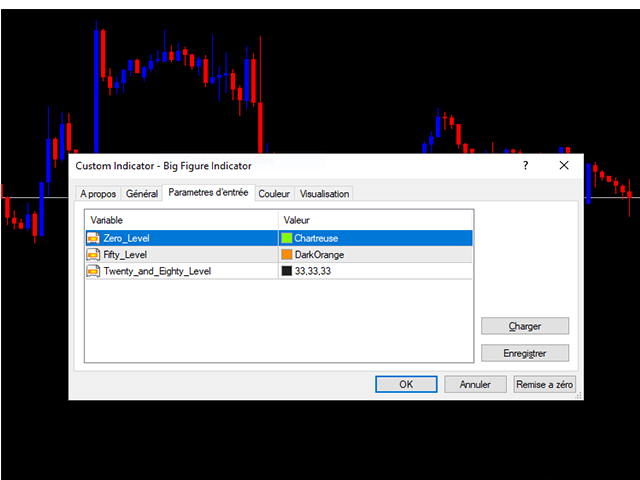
Çizgi rengi, Giriş Parametresi sekmesinde değiştirilebilir
Tüm para çiftleriyle kullanılabilir
MT5 sürümü: https://www.mql5.com/fr/market/product/96750
NOT: Göstergemizin en iyi şekilde çalışması için öncelikle Günlük (D1) zaman dilimini yüklemek gereklidir.