Weis Wave Double Side
- Göstergeler
- Eduardo Da Costa Custodio Santos
- Sürüm: 1.3
- Güncellendi: 27 Mayıs 2024
- Etkinleştirmeler: 5
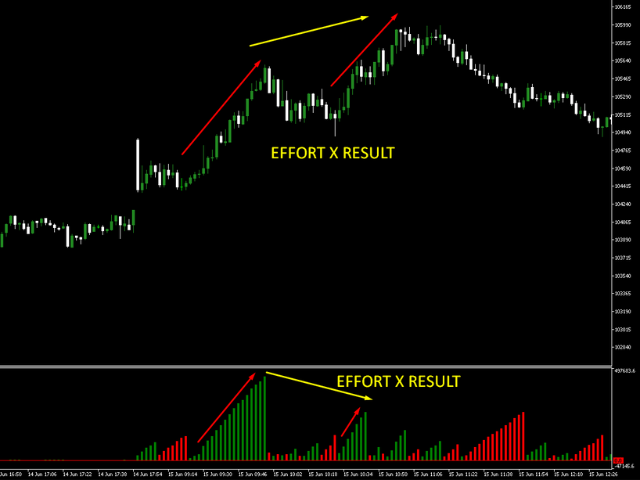
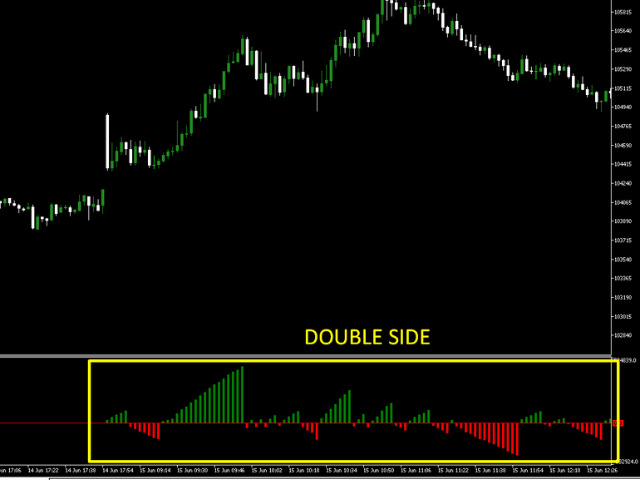
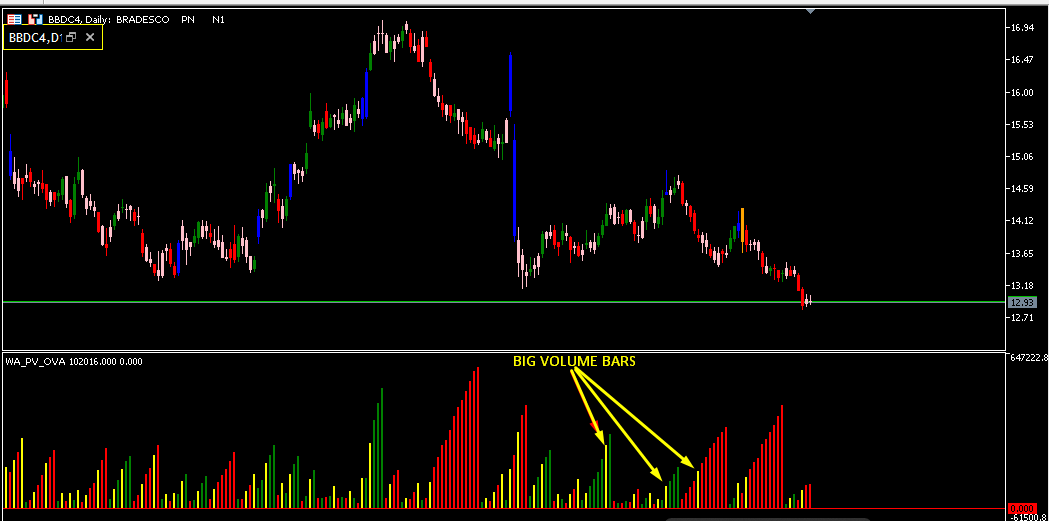
MT5 için Weis Wave Bouble Yan Göstergesi, araç setinin bir parçasıdır (Wyckoff Academy Wave Market) MT5 için Weis Wave Bouble yan Göstergesi, David Weis tarafından oluşturulan halihazırda kurulmuş Weis Wave'e dayalı olarak oluşturulmuştur. Weis Wave Çift Taraflı göstergesi, piyasayı olduğu gibi dalgalar halinde okur 1900 yılında R. Wyckoff tarafından. Çaba x sonuç, neden ve sonuç ve arz ve talebi belirlemeye yardımcı olur. Diferansiyeli, sıfır ekseninin altında kullanılabilmesi ve daha da iyileştirilmesidir. artı operatör okuma R. Wyckoff teorisine dayalı olarak oluşturulan gösterge göstergenin nasıl okunduğuna bakın.