Ticks ATR
- Göstergeler
- Andrej Nikitin
- Sürüm: 1.12
- Güncellendi: 17 Kasım 2021
- Etkinleştirmeler: 5
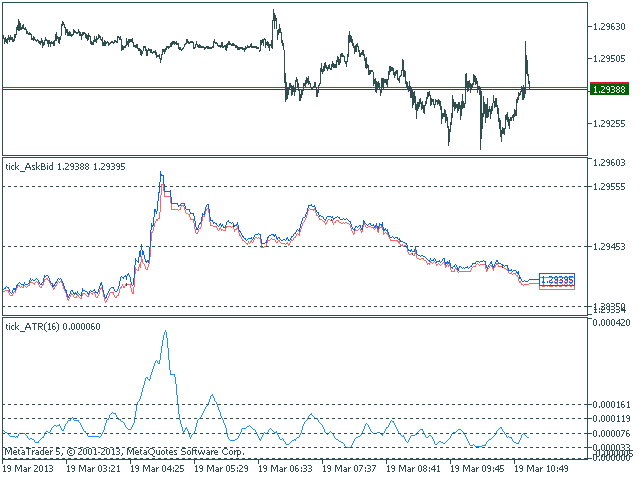
The Average True Range (ATR) indicator drawn using a tick chart.
After launching it, wait for enough ticks to come.
Parameters:
- ATR Period - number of single periods used for the indicator calculation.
- The number of ticks to identify Bar - number of single ticks that form OHLC.
- Price levels count - number of displayed price levels (no levels are displayed if set to 0 or a lower value).
- Сalculated bar - number of bars for the indicator calculation.