MACD Intraday Trend PRO MT4
- Göstergeler
- JETINVEST
- Sürüm: 1.10
- Güncellendi: 7 Haziran 2021
- Etkinleştirmeler: 20
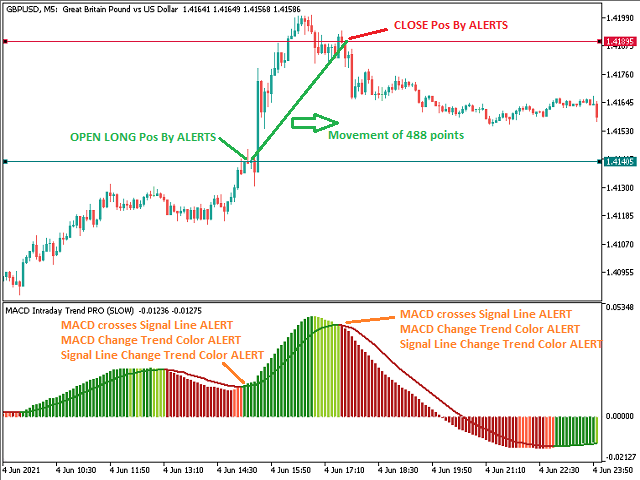
MACD Gün İçi Trend PRO, 1960'larda Gerald Appel tarafından oluşturulan orijinal MACD'nin uyarlanmasıyla geliştirilen bir Göstergedir.
Yıllarca süren ticaret sayesinde, MACD'nin parametrelerini Fibonacci oranlarıyla değiştirerek, trend hareketlerinin sürekliliğinin daha iyi bir sunumunu sağladığımız ve bir fiyat trendinin başlangıcını ve sonunu daha verimli bir şekilde tespit etmeyi mümkün kıldığımız gözlemlendi.
Fiyat trendlerini tespit etmedeki etkinliği sayesinde, üst ve dip farklarını çok net bir şekilde tespit etmek ve böylece ticaret fırsatlarından daha iyi yararlanmak mümkündür.
Özellikleri
- Gösterge MACD Gün İçi Trend PRO, herhangi bir döviz çifti ile, herhangi bir zaman diliminde ve Renko çizelgeleriyle çalışır.
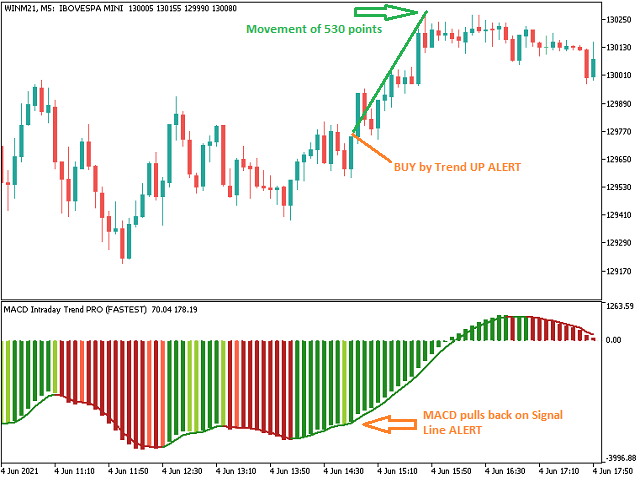
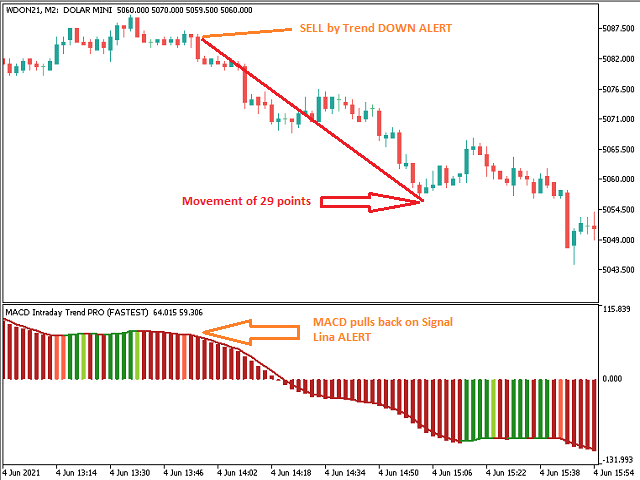
- Trend Algılama Hızını 5 mod seçerek ayarlamak mümkündür:
- EN HIZLI
- HIZLI
- NORMAL
- YAVAŞ
- EN YAVAŞ
Kaynaklar
- 6 yapılandırılabilir uyarısı vardır:
- MACD, Sinyal Hattını geri çekiyor
- MACD Sinyal Hattını geçiyor
- MACD sıfır seviyesini geçiyor
- Sinyal Hattı sıfır seviyesini geçiyor
- MACD TREND Rengi değiştir
- Sinyal Hattı değişikliği TREND Renk
- Her uyarı için aşağıdakileri yapılandırmak mümkündür:
- Açılır
- Ses(13 çeşit ses vardır.)
- Akıllı telefon bildirimi
- Açılır Pencere ve Ses
- Pop-up ve Akıllı Telefon bildirimi
- Ses ve Akıllı Telefon bildirimi
- Açılır Pencere, Ses ve Akıllı Telefon bildirimi
Uzman Danışmanlar veya diğer Göstergeler ile Entegrasyon
- Uzman danışmanlar veya diğer göstergelerle erişim ve entegrasyon için kullanılabilen 8 arabellek vardır, bunlar uyarılar kapalıyken bile doldurulur, bunlar:
- Tampon Kimliği 5: MACD Değeri
- Tampon Kimliği 6: Sinyal Hattı Değeri
- Tampon Kimliği 12: Uyarı 1
- Tampon Kimliği 13: Uyarı 2
- Tampon Kimliği 14: Uyarı 3
- Tampon Kimliği 15: Uyarı 4
- Tampon Kimliği 16: Uyarı 5
- Tampon Kimliği 17: Uyarı 6
- 6 Uyarıya atıfta bulunan Tamponlar aşağıdaki değerleri içerebilir:
- Düşüş trendi: (-1)
- Tanımlanmamış eğilim: (0)
- Yükseliş trendi: (+1)
Hâlâ sorularınız varsa, lütfen doğrudan mesajla bana ulaşın: https://www.mql5.com/tr/users/robsjunqueira/


Hello!Cannot customize parameters, unfortunately.Can it be upgraded so that users can customize parameters like traditional MACD?If this can be achieved, thank you very much!!!Look forward to......