• Genel bakış
  • İncelemeler
  • Yorumlar
  • Yenilikler

Higher Timeframe Price Line

Rob Smith'in TheStrat'ını öğrenirken bu basit göstergeyi oluşturdum ve çok faydalı buldum, sizinle paylaşayım dedim. Yararlı bulursanız, lütfen MQL5'te yayınladığım diğer göstergelere bakın.

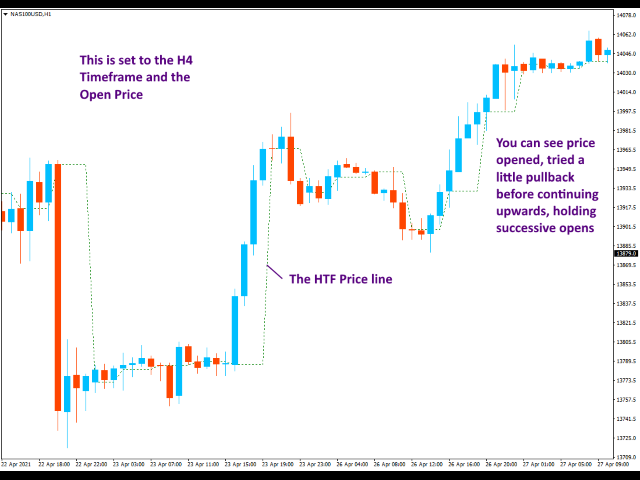
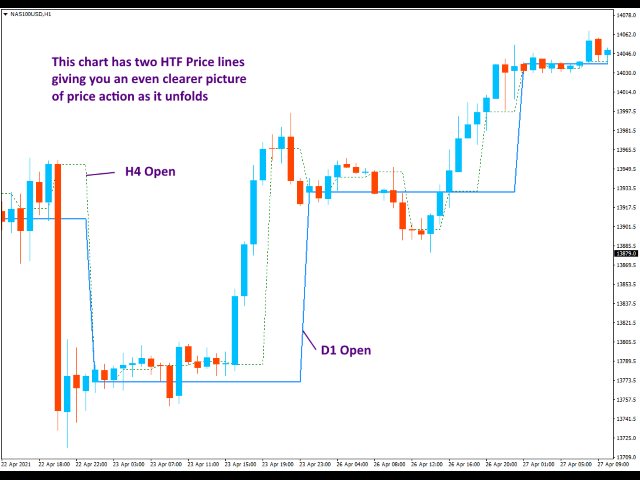
Gösterge, grafik üzerinde daha yüksek bir zaman aralığından seçtiğiniz fiyat seviyesini gösteren tek bir çizgi çizer.

Ayarları kullanarak, görüntülediği zaman çerçevesi üzerinde tam kontrole sahip olursunuz, ancak varsayılan olarak, ölçeği bir adım yukarı taşıyarak daha yüksek zaman dilimini kendisi hesaplar. Örneğin, bir H1 grafiği açarsanız, H4 grafiğindeki verileri gösterecektir.


Ayarlar

İzleme Zaman Çerçevesi

Fiyat seviyesinin çizileceği zaman dilimini seçin. Varsayılan Current ayarında bırakırsanız, sizin için uygun zaman dilimini seçecektir. Bir grafiği gözden geçiriyorsanız ve zaman dilimleri arasında geçiş yapıyorsanız bu çok yararlıdır, çünkü çizgi kendini her zaman yukarı doğru ayarlayacaktır.

İzleme Değeri

Aşağıdaki standart fiyat değerlerinden birini seçebilirsiniz. Varsayılan, Açık fiyattır.

PRICE_CLOSE

fiyatı kapat

PRICE_OPEN

Açık fiyat

FİYAT_YÜKSEK

Dönem için maksimum fiyat

FİYAT_DÜŞÜK

Dönem için minimum fiyat

PRICE_MEDYAN

Medyan fiyat, (yüksek + düşük)/2

PRICE_TYPICAL

Tipik fiyat, (yüksek + düşük + kapanış)/3

PRICE_WEIGHTED

Ağırlıklı kapanış fiyatı, (yüksek + düşük + kapanış + kapanış)/4


Önerilen ürünler
Necessary for traders: tools and indicators Waves automatically calculate indicators, channel trend trading Perfect trend-wave automatic calculation channel calculation , MT4 Perfect trend-wave automatic calculation channel calculation , MT5 Local Trading copying Easy And Fast Copy , MT4 Easy And Fast Copy , MT5 Local Trading copying For DEMO Easy And Fast Copy , MT4 DEMO Easy And Fast Copy , MT5 DEMO The homeopathic indicator is also called the CCI indicator. The CCI indicator was propos
FREE
ZigZag Fibo Retracement Indicator Optimize Your Trading Strategy! Are you seeking to optimize your trading strategy in the financial markets? Explore the unique features of the ZigZag Fibo Retracement Indicator, a powerful tool designed to help you identify potential support and resistance levels based on the combination of ZigZag patterns and Fibonacci ratios. Integration of ZigZag Patterns and Fibonacci: The ZigZag Fibo Retracement Indicator combines the effectiveness of ZigZag patterns, helpi
FREE
Free automatic Fibonacci is an indicator that automatically plots a Fibonacci retracement based on the number of bars you select on the BarsToScan setting in the indicator. The Fibonacci is automatically updated in real time as new highest and lowest values appears amongst the selected bars. You can select which level values to be displayed in the indicator settings. You can also select the color of the levels thus enabling the trader to be able to attach the indicator several times with differe
FREE
PZ Penta O MT4
PZ TRADING SLU
2.25 (4)
The Penta-O is a 6-point retracement harmonacci pattern which usually precedes big market movements. Penta-O patterns can expand and repaint quite a bit. To make things easier this indicator implements a twist: it waits for a donchian breakout in the right direction before signaling the trade. The end result is an otherwise repainting indicator with a very reliable trading signal. The donchian breakout period is entered as an input. [ Installation Guide | Update Guide | Troubleshooting | FAQ | A
FREE
AdvanceZigZag
Gholamreza Mohammad Mojaveri
5 (1)
AdvaneZigZag Indicator Are you tired of the limitations of the traditional ZigZag indicator? Meet AdvaneZigZag, the ultimate tool to simplify your market structure analysis and enhance your trading strategies. Designed with flexibility and precision in mind, AdvaneZigZag brings you advanced features to navigate the market with confidence. Key Features: 1. Enhanced Flexibility:    - While maintaining the familiar simplicity of the conventional ZigZag indicator, AdvaneZigZag offers superi
FREE
Virtual Targets
Hoang Van Dien
4 (7)
This indicator is very useful for day traders or short term traders. No need to calculate the number of pips manually, just look at the chart and you will see the Virtual Take Profit / Virtual Stop Loss target line and evaluate whether the entry point is feasible to reach the intended target or not. Enter the intended Take Profit / Stop Loss pips for your trade. The indicator will display Virtual Take Profit / Virtual Stop Loss lines for you to easily see if the target is feasible or not.
FREE
Triple RSI
Pablo Leonardo Spata
2.5 (2)
LOOK AT THE FOLLOWING STRATEGY WITH THIS INDICATOR. Triple RSI is a tool that uses the classic Relative Strength Indicator, but in several timeframes to find market reversals.    1.  ️ Idea behind the indicator and its strategy: In Trading, be it Forex or any other asset, the ideal is to keep it simple, the simpler the better . The triple RSI strategy is one of the simple strategies that seek market returns. In our experience, where there is more money to always be won, is in the marke
FREE
Discover the power of precision and efficiency in your trading with the " Super Auto Fibonacci " MT4 indicator. This cutting-edge tool is meticulously designed to enhance your technical analysis, providing you with invaluable insights to make informed trading decisions. Key Features: Automated Fibonacci Analysis: Say goodbye to the hassle of manual Fibonacci retracement and extension drawing. "Super Auto Fibonacci" instantly identifies and plots Fibonacci levels on your MT4 chart, saving you tim
FREE
Follow The Line
Oliver Gideon Amofa Appiah
4 (13)
FOLLOW THE LINE GET THE FULL VERSION HERE: https://www.mql5.com/en/market/product/36024 This indicator obeys the popular maxim that: "THE TREND IS YOUR FRIEND" It paints a GREEN line for BUY and also paints a RED line for SELL.  It gives alarms and alerts of all kinds. IT DOES NOT REPAINT and can be used for all currency pairs and timeframes. Yes, as easy and simple as that. Even a newbie can use it to make great and reliable trades. NB: For best results, get my other premium indicators for more
FREE
Email Drawdown Alert
Roman Starostin
5 (15)
Free informative Indicator-helper. It'll be usefull for traders who trade many symbols or using grid systems (Averaging or Martingale). Indicator counts drawdown as percent and currency separate. It has a number of settings: Count deposite drawdown according equity value and send e-mail or notifications to user if DD more than set; Sending e-mail when max open orders reached; Shows price and remaining pips amount before MarginCall on current chart and Account generally; Display summary trade lot
FREE
This powerful tool combines the Zigzag algorithm with Fibonacci retracement levels, enhancing your trading experience in the MetaTrader 4 (MT4) platform. Zigzag with Fibo Indicator Time Frame :- 1H and above The   Zigzag with Fibo Indicator   is designed to identify trend direction and provide precise entry and exit points for forex trading. Here’s what makes it stand out: Zigzag Algorithm Integration : The indicator utilizes the Zigzag algorithm, which helps filter out market noise and highligh
FREE
Multi Divergence Indicator for MT4 - User Guide Introduction Overview of the Multi Divergence Indicator and its capabilities in identifying divergences across multiple indicators. Importance of divergence detection in enhancing trading strategies and decision-making. List of Indicators RSI CCI MACD STOCHASTIC AWSOME MFI ACCELERATOR OSMA MOMENTUM WPR( Williams %R) RVI Indicator Features Indicator Selection: How to enable/disable specific indicators (RSI, CCI, MACD, etc.) for divergence detection.
FREE
OrderBlock TS Roman
Vladislav Vlastovskii
4 (7)
Индикатор строит блоки заказов (БЗ) по торговой системе (ТС) Романа. Поиск блоков осуществляется одновременно на двух таймфремах: текущем и старшем (определяемым в настройках). Для оптимизации и игнорирования устаревших блоков в настройках задается ограничение количества дней в пределах которых осуществляется поиск блоков. Блоки строятся по правилам ТС состоящем из трех шагов: какую свечу вынесли (что?); какой свечой вынесли (чем?); правило отрисовки (как?).
FREE
Trend arrow Indicator
NGUYEN NGHIEM DUY
3.23 (13)
Trend arrow Indicator is an arrow Indicator used as an assistant tool for your trading strategy. The indicator analyzes the standard deviation of bar close for a given period and generates a buy or sell signals if the deviation increases. It good to combo with Martingale EA to follow Trend and Sellect Buy Only/Sell Only for EA work Semi-Automatic. You can use this  Indicator with any EAs in my Products.
FREE
Pivot Point Fibo RSJ, Fibonacci oranlarını kullanarak günün destek ve direnç çizgilerini izleyen bir göstergedir. Bu muhteşem gösterge, Fibonacci oranlarını kullanarak Pivot Point üzerinden 7 seviyeye kadar destek ve direnç oluşturur. Fiyatların, bir operasyonun olası giriş/çıkış noktalarını algılamanın mümkün olduğu bu destek ve direncin her bir düzeyine uyması harika. Özellikleri 7 seviyeye kadar destek ve 7 seviye direnç Seviyelerin renklerini ayrı ayrı ayarlayın Girişler Pivot Tipi
FREE
TrendPlus
Sivakumar Subbaiya
4.21 (14)
Trend Plus   Trendplus  Indicator   Time Frame: Suitable for any time frame.  Purpose: Trend Prediction. Blue and red candle indicate the buy and sell call respectively. Buy: When the blue candle is formed buy call is initiated. close the buy trades when the next red candle will formed.   Sell: When the Red candle is formed Sell call is initiated. close the Sell trades when the next blue candle will formed.   Happy trade!!
FREE
Check my paid tools they work great and I share Ea's based on them for free please r ate The Dual Timeframe RSI (Relative Strength Index) indicator is a novel trading tool that allows traders to monitor RSI readings from two different timeframes on a single chart. This dual perspective enables traders to identify potential trend confirmations and divergences more effectively. For instance, a trader might use a 1-hour RSI alongside a daily RSI to ensure that short-term trades align with the bro
FREE
Индикатор "Buy Sell zones x2" основан на принципе "остановка/разворот после сильного движения". Поэтому, как только обнаруживается сильное безоткатное движение, сразу после остановки - рисуется зона покупок/продаж. Зоны отрабатывают красиво. Или цена ретестит зону и улетает в космос, или пробивает зону насквозь и зона отрабатывается с другой стороны так же красиво.  Работает на всех таймфреймах. Лучше всего выглядит и отрабатывает на Н1.    Может использоваться как: индикатор зон, где лучше
FREE
Kombajn Signal
Mariusz Piotr Rodacki
The indicator still has a few bugs but is ready for testing. This is my first indicator that determines entry and exit points. The entry point is based on breaking the peaks determined by a channel indicating highs and lows (invisible channels). TP1 is a probable target at which most positions can be closed. The channel determining the opening and closing of positions is based on different assumptions. The red stop loss line is determined based on lows and highs. The stop loss can be adjusted
FREE
RSX Signal 2 AM
Andriy Matviyevs'kyy
The indicator displays the signals of the RSX oscillator on the price chart. (To display these signals in a separate window, along with the oscillator, another indicator is used -  RSX Osc 4 AM ). It is optimal to use the indicator signals as signals to open a trade when the price overcomes the maximum or minimum of the bar at which the signal was given. An opposite signal cancels the previous signal. Settings: Data period for indicator calculation - data period for indicator calculation; Data
FREE
This trial scanner works with the other "Smart Market Structure Opportunity Scanner", and is basically an extension of that scanner with added features to find more accurate entry opportunities for day trading or refined swing trading.  The most important added features are:  1) The ADRs ( Average Daily Range ) for the last 5 days would have color and  +/- sign that shows the direction of each days ADR     move.  2) I added RSI values for each of the trading timeframes ( 1min, 5min, 15min, 30min
FREE
Head and Shoulders Pattern Indicator - Your Key to Recognizing Trend Reversals Unlock the power of pattern recognition with the "Head and Shoulders Pattern Indicator." This cutting-edge tool, designed for MetaTrader, is your trusted ally in identifying one of the most powerful chart patterns in technical analysis. Whether you're a novice or an experienced trader, this indicator simplifies the process of spotting the Head and Shoulders pattern, allowing you to make informed trading decisions. Key
FREE
Market Profile 3
Hussien Abdeltwab Hussien Ryad
4 (4)
Market Profile 3 MetaTrader 4 indicator  — is a classic Market Profile implementation that can show the price density over time, outlining the most important price levels, value area, and control value of a given trading session. This indicator can be attached to timeframes between M1 and D1 and will show the Market Profile for daily, weekly, monthly, or even intraday sessions. Lower timeframes offer higher precision. Higher timeframes are recommended for better visibility. It is also possible t
FREE
Just another Auto Fibonacci Retracement indicator . However, this is the most Flexible & Reliable one you can find for FREE. If you use this indicator and you like it, please leave a review/comment. If you are looking for a more advanced Fibo indicator, check this  Free  Trend-Based Fibo indicator . ### FEATURES ### Auto-calculate up to 7 Fibonacci levels on your customized frame. Adjust levels as your need. Use   High/Low price or  Open/Close price to calculate. Freeze the levels and don't re
FREE
Wave Reversal Indicator - determines the direction of trend waves and price reversals. The indicator shows wave movements and trend directions. It gives recommendations where to follow the trader, helps to follow the trading strategy. It is an addition to an intraday or medium-term strategy. Almost all parameters are selected for each time frame and are changed automatically, the only parameter for manual adjustment is the wavelength. Works on various trading instruments and timeframes, rec
FREE
Traditional MACD MT4
Daniel Lewis
4.61 (71)
MACD indicator in MetaTrader 4/5 looks different than MACD does in most other charting software. That is because the MetaTrader 4/5 version of MACD displays the MACD line as a histogram when it is traditionally displayed as a line. Additionally, the MetaTrader 4/5 version computes the Signal line using an SMA, while according to MACD definition it is supposed to be an EMA. The MetaTrader 4/5 version also does not compute a true MACD Histogram (the difference between the MACD/Signal lines). This
FREE
Extremum Reverse Bar
Yurij Izyumov
3.55 (11)
This indicator has been created for finding the probable reversal points of the symbol price. A small candlestick reversal pattern is used it its operation in conjunction with a filter of extremums. The indicator is not redrawn! If the extremum filter is disabled, the indicator shows all points that have a pattern. If the extremum filter is enabled, the condition works – if the history Previous bars 1 candles back contains higher candles and they are farther than the Previous bars 2 candle, such
FREE
Simple RSI Forex Trading Strategy
Victor Manuel Valderrama Zamora
2.5 (2)
Diversify the risk in your trading account by combining our Expert Advisors. Build your own custom trading system here:   Simple Forex Trading Strategies The expert advisor opens trades when RSI indicator enter in oversold or overbought areas. The Stop Loss, Take Profit, and Trailing Stop are calculated based on the ATR indicator. The recommended currency pair is EURGBP and the recommended timeframe to operate and to do backtests is H4. This Expert Advisor can be profitable in any TimeFrame a
FREE
Trend Yakalayıcı: Alarm İndikatörü ile Trend Yakalayıcı Stratejisi, piyasa trendlerini ve potansiyel giriş ve çıkış noktalarını belirlemede yardımcı olan çok yönlü bir teknik analiz aracıdır. Piyasa koşullarına uyum sağlayarak trend yönünün net görsel temsili için dinamik bir Trend Yakalayıcı Stratejisi sunar. Tüccarlar tercihlerine ve risk toleranslarına göre parametreleri özelleştirebilirler. Gösterge, trendleri tanımlamaya yardımcı olur, potansiyel ters dönüşleri sinyaller, trailing stop m
FREE
QuantumAlert Stoch Navigator is a free indicator available for MT4/MT5 platforms, its work is to provide "alerts" when the market is inside "overbought and oversold" regions in the form of "buy or sell" signals. This indicator comes with many customization options mentioned in the parameter section below, user can customise these parameters as needful. Join our   MQL5 group , where we share important news and updates. You are also welcome to join our private channel as well, contact me for the p
FREE
Bu ürünün alıcıları ayrıca şunları da satın alıyor
Gann Made Easy
Oleg Rodin
4.93 (70)
Gann Made Easy , bay teorisini kullanarak ticaretin en iyi ilkelerine dayanan, profesyonel ve kullanımı kolay bir Forex ticaret sistemidir. WD Gann. Gösterge, Zararı Durdur ve Kâr Al Seviyeleri dahil olmak üzere doğru SATIN AL ve SAT sinyalleri sağlar. PUSH bildirimlerini kullanarak hareket halindeyken bile işlem yapabilirsiniz. Lütfen satın aldıktan sonra benimle iletişime geçin! Alım satım ipuçlarımı ve harika bonus göstergelerini ücretsiz olarak sizinle paylaşacağım! Muhtemelen Gann ticaret y
Atomic Analyst
Issam Kassas
5 (3)
Öncelikle belirtmek gerekir ki bu Ticaret Göstergesi Yeniden Çizim Yapmaz, Gecikmez ve Gecikme Göstermez, bu da hem manuel hem de robot ticareti için ideal hale getirir. Kullanıcı kılavuzu: ayarlar, girişler ve strateji. Atom Analisti, Piyasada Daha İyi Bir Avantaj Bulmak İçin Fiyatın Gücünü ve Momentumunu Kullanan PA Fiyat Hareketi Göstergesidir. Gürültüleri ve Yanlış Sinyalleri Kaldırmaya ve Ticaret Potansiyelini Artırmaya Yardımcı Olan Gelişmiş Filtrelerle Donatılmıştır. Birden fazla katma
ŞU ANDA %26 INDIRIMLI Yeni Başlayanlar veya Uzman Tüccarlar için En İyi Çözüm! Bu Gösterge benzersiz, yüksek kaliteli ve uygun fiyatlı bir ticaret aracıdır çünkü bir dizi tescilli özellik ve yeni bir formül ekledik. Sadece BİR grafik ile 28 Forex çifti için Döviz Gücünü okuyabilirsiniz! Yeni bir trendin veya scalping fırsatının tam tetik noktasını belirleyebildiğiniz için ticaretinizin nasıl gelişeceğini hayal edin? Kullanım kılavuzu: buraya tıklayın Bu ilk olan, orijinal! Değersiz bir
Scalper Inside PRO
Alexey Minkov
4.75 (57)
An exclusive indicator that utilizes an innovative algorithm to swiftly and accurately determine the market trend. The indicator automatically calculates opening, closing, and profit levels, providing detailed trading statistics. With these features, you can choose the most appropriate trading instrument for the current market conditions. Additionally, you can easily integrate your own arrow indicators into Scalper Inside Pro to quickly evaluate their statistics and profitability. Scalper Inside
TPSpro RFI Levels
Roman Podpora
4.8 (15)
Reversal First Impulse levels (RFI)    INSTRUCTIONS        RUS       -       ENG              R ecommended to use with an indicator   -   TREND PRO -  Version MT5 A key element in trading is zones or levels from which decisions to buy or sell a trading instrument are made. Despite attempts by major players to conceal their presence in the market, they inevitably leave traces. Our task was to learn how to identify these traces and interpret them correctly. Main functions: Displaying active zones
Trend Punch
Mohamed Hassan
5 (6)
Manual guide:   Click here Starting price of  $88  for the first 25 copies only ( 1  left)! -- Next price is  $176 .  This indicator is unstoppable when combined with our other indicator called  Support & Resistance . After purchase, send us a message and you could get  it  for  FREE as a BONUS! I like to use Trend Punch on XAUUSD on the M1 timeframe!  Introducing Trend Punch , the revolutionary forex trend indicator that will transform the way you trade! Trend Punch is uniquely de
TPSproTREND PrO
Roman Podpora
4.78 (18)
TPSpro TRENDPRO  - is a trend indicator that automatically analyzes the market and provides information about the trend and each of its changes, as well as giving signals for entering trades without redrawing! The indicator uses each candle, analyzing them separately. referring to different impulses - up or down impulse. Exact entry points into transactions for currencies, crypto, metals, stocks, indices!  -  Version MT5               DETAILED DESCRIPTION                R ecommended to use with
Advanced Supply Demand
Bernhard Schweigert
4.92 (311)
CURRENTLY 26% OFF !! Best Solution for any Newbie or Expert Trader! This indicator is a unique, high quality and affordable trading tool because we have incorporated a number of proprietary features and a new formula. With this update, you will be able to show double timeframe zones. You will not only be able to show a higher TF but to show both, the chart TF, PLUS the higher TF: SHOWING NESTED ZONES. All Supply Demand traders will love it. :) Important Information Revealed Maximize the potenti
Öncelikle, bu Ticaret Aracının Non-Repainting, Non-Redrawing ve Non-Lagging Gösterge olduğunu vurgulamakta fayda var, bu da onu profesyonel ticaret için ideal hale getiriyor. Çevrimiçi kurs, kullanıcı kılavuzu ve demo. Akıllı Fiyat Hareketi Kavramları Göstergesi, hem yeni hem de deneyimli tüccarlar için çok güçlü bir araçtır. İleri ticaret fikirlerini, Inner Circle Trader Analizi ve Smart Money Concepts Ticaret Stratejileri gibi 20'den fazla kullanışlı göstergeyi bir araya getirerek bir araya g
Gold Stuff
Vasiliy Strukov
4.89 (257)
Gold Stuff, özellikle altın için tasarlanmış bir trend göstergesidir ve herhangi bir finansal enstrümanda da kullanılabilir. Gösterge yeniden çizilmez ve gecikmez. Önerilen zaman dilimi H1. Bu göstergede tam otomatik Uzman Danışman EA Gold Stuff çalışır. Profilimde bulabilirsiniz. Ayarları ve kişisel bir bonusu almak için satın alma işleminden hemen sonra benimle iletişime geçin!   AYARLAR Ok Çiz - açık kapalı. grafik üzerinde oklar çizmek. Uyarılar - sesli uyarılar kapalı. E-posta bild
TrendMaestro
Stefano Frisetti
5 (3)
note: this indicator is for METATRADER4, if you want the version for METATRADER5 this is the link:  https://www.mql5.com/it/market/product/108106 TRENDMAESTRO ver 2.4 TRENDMAESTRO recognizes a new TREND in the bud, he never makes mistakes. The certainty of identifying a new TREND is priceless. DESCRIPTION TRENDMAESTRO identifies a new TREND in the bud, this indicator examines the volatility, volumes and momentum to identify the moment in which there is an explosion of one or more of these data a
FX Volume
Daniel Stein
4.6 (35)
Sabah Brifingimiz aracılığıyla ayrıntılar ve ekran görüntüleri ile günlük piyasa güncellemenizi alın burada mql5 ve on Telegram ! FX Volume, bir brokerin bakış açısından piyasa duyarlılığı hakkında GERÇEK bir fikir veren İLK ve TEK hacim göstergesidir. COT raporlarından çok daha hızlı bir şekilde, brokerlar gibi kurumsal piyasa katılımcılarının Forex piyasasında nasıl konumlandıklarına dair harika bilgiler sağlar. Bu bilgileri doğrudan grafiğinizde görmek, ticaretiniz için gerçek oyun değiştir
Özel MT4 göstergemizle başarılı forex ticaretinin sırrını keşfedin! Forex piyasasında nasıl başarıya ulaşacağınızı hiç merak ettiniz, riski en aza indirirken sürekli olarak kar kazandınız mı? İşte aradığınız cevap! Ticaret yaklaşımınızda devrim yaratacak tescilli MT4 göstergimizi tanıtmamıza izin verin. Benzersiz çok yönlülük Göstergemiz, Renko ve RangeBar Mum oluşumlarını tercih eden kullanıcılar için özel olarak tasarlanmıştır. Bu grafik türlerinin birçok deneyimli tüccar tarafından ter
Fiyat tersine döndükçe ve geri çekildikçe piyasa yapısından elde edilen kâr değişir. Piyasa yapısını tersine çevirme uyarısı göstergesi, bir trendin veya fiyat hareketinin ne zaman tükenmeye yaklaştığını ve tersine dönmeye hazır olduğunu tanımlar. Genellikle bir geri dönüş veya büyük bir geri çekilme meydana gelmek üzereyken meydana gelen piyasa yapısındaki değişiklikler konusunda sizi uyarır. Gösterge, olası bir tükenme noktasının yakınında her yeni yüksek veya düşük oluştuğunda, başlangıçta
MT4 için Astronomi Göstergesini Tanıtıyoruz: En İleri Göksel Ticaret Arkadaşınız Ticaret deneyiminizi göksel seviyelere yükseltmeye hazır mısınız? MT4 için devrim niteliğindeki Astronomi Göstergemizi arayın. Bu yenilikçi araç karmaşık algoritmaları kullanarak eşsiz astronomik içgörüler ve hassas hesaplamalar sunmak için geleneksel ticaret göstergelerini aşmaktadır. Bilgi Evreni Parmaklarınızın Ucunda: Göksel verilerin hazinelerini açığa çıkaran kapsamlı bir paneli gözlemleyin. Gezegenlerin geo/h
Gann Swing Structure
Kirill Borovskii
5 (1)
This indicator is based on the mathematics of the great trader W.D. Ganna. With its help, you can easily find strong levels by analyzing swings to find the optimal entry point. The indicator works on all instruments and all timeframes. The indicator is fully manual and has control buttons. All you need to do is press the NEW button, a segment will appear, which you can place on any movement, swing or even 1 candle that you want to analyze. By placing the segment, press the OK button. A grid (th
Break and Retest
Mohamed Hassan
4.33 (12)
New update to V.4 where  Break & Retest automatically draws the take profit & stop loss levels and you also have more signals per day! ‍You can visually backtest Break & Retest to see how it behaved in the past!     Manual guide:   Click here $60 for a very limited time. Next price is $120   This Indicator only places quality trades when the market is really in your favor with a clear break and retest. Patience is key with this price action strategy! If you want more alert s
M1 Arrow
Oleg Rodin
5 (14)
Piyasanın iki temel ilkesine dayanan bir gün içi stratejisi. Algoritma, ek filtreler kullanarak hacimlerin ve fiyat dalgalarının analizine dayanmaktadır. Göstergenin akıllı algoritması, yalnızca iki piyasa faktörü bir araya geldiğinde bir sinyal verir. Gösterge, daha yüksek zaman çerçevesinin verilerini kullanarak M1 grafiğinde belirli bir aralıktaki dalgaları hesaplar. Ve dalgayı doğrulamak için gösterge, hacme göre analizi kullanır. Bu gösterge hazır bir ticaret sistemidir. Bir tüccarın ihtiya
Scalper Vault
Oleg Rodin
5 (29)
Scalper Vault , başarılı bir scalping için ihtiyacınız olan her şeyi size sağlayan profesyonel bir scalping sistemidir. Bu gösterge, forex ve ikili opsiyon tüccarları tarafından kullanılabilecek eksiksiz bir ticaret sistemidir. Önerilen zaman çerçevesi M5'tir. Sistem size trend yönünde doğru ok sinyalleri sağlar. Ayrıca size üst ve alt sinyaller ve Gann piyasa seviyeleri sağlar. Göstergeler, PUSH bildirimleri dahil her türlü uyarıyı sağlar. Göstergeyi satın aldıktan sonra lütfen benimle iletişim
FX Power MT4 NG
Daniel Stein
5 (10)
Sabah Brifingimiz burada mql5 ve on Telegram! FX Power MT4 NG , uzun zamandır çok popüler olan döviz gücü ölçerimiz FX Power'ın yeni neslidir. Peki bu yeni nesil güç ölçer ne sunuyor? Orijinal FX Power hakkında sevdiğiniz her şey PLUS GOLD/XAU güç analizi Daha da hassas hesaplama sonuçları Ayrı ayrı yapılandırılabilir analiz dönemleri Daha da iyi performans için özelleştirilebilir hesaplama limiti Özel çokluDaha fazlasını görmek isteyenler için örnek ayarlar Her grafikte en sevdiğiniz renkler i
Şu anda %20 İNDİRİMLİ! Herhangi bir Acemi veya Uzman Tüccar için En İyi Çözüm! Bu gösterge paneli yazılımı 28 döviz çifti üzerinde çalışıyor. Ana göstergelerimizden 2'sine (Gelişmiş Para Birimi Gücü 28 ve Gelişmiş Para Birimi Dürtüsü) dayanmaktadır. Tüm Forex piyasasına harika bir genel bakış sağlar. Gelişmiş Para Birimi Gücü değerlerini, para birimi hareket hızını ve tüm (9) zaman dilimlerinde 28 Forex çifti için sinyalleri gösterir. Trendleri ve / veya scalping fırsatlarını belirlemek içi
3 Indicators in 1 indicator Strategy based on price action Made specifically for the best forex currency pairs Can be used in the best time frame of the market at a very reasonable price This indicator is basically 3 different indicatos . But we have combined these 3 indicators in 1 indicator so that you can use 3 indicators at the lowest price. All three strategies are based on price action. But based on different trends. Long term, medium term and short term Attributes : No repaintin
Currency Strength Wizard , başarılı ticaret için size hepsi bir arada çözüm sağlayan çok güçlü bir göstergedir. Gösterge, birden çok zaman dilimindeki tüm para birimlerinin verilerini kullanarak şu veya bu forex çiftinin gücünü hesaplar. Bu veriler, şu veya bu para biriminin gücünü görmek için kullanabileceğiniz, kullanımı kolay para birimi endeksi ve para birimi güç hatları biçiminde temsil edilir. İhtiyacınız olan tek şey, işlem yapmak istediğiniz tabloya göstergeyi eklemektir ve gösterge size
PRO Renko Sistemi, RENKO grafikleri ticareti için özel olarak tasarlanmış son derece hassas bir ticaret sistemidir. Bu, çeşitli ticaret araçlarına uygulanabilen evrensel bir sistemdir. Sistemi etkin piyasa sana doğru ters sinyallerine erişim hakkı denilen ses nötralize eder. Göstergenin kullanımı çok kolaydır ve sinyal üretiminden sorumlu tek bir parametreye sahiptir. Aracı, seçtiğiniz herhangi bir ticaret aracına ve renko çubuğunun boyutuna kolayca uyarlayabilirsiniz. Yazılımımla karlı b
Trend Screener
STE S.S.COMPANY
4.83 (88)
Trend Göstergesi, Trend Alım Satım ve Filtreleme için Çığır Açan Benzersiz Çözüm, Tüm Önemli Trend Özellikleriyle Tek Bir Araç İçinde Yerleştirildi! Forex, emtialar, kripto para birimleri, endeksler ve hisse senetleri gibi tüm sembollerde/araçlarda kullanılabilen %100 yeniden boyamayan çoklu zaman çerçevesi ve Çoklu para birimi göstergesidir. Trend Screener, grafikte noktalarla ok trend sinyalleri sağlayan etkili bir trend trend göstergesidir. Trend analizörü göstergesinde bulunan özellikler: 1.
TrendDecoder Premium
Christophe Pa Trouillas
5 (5)
Aralıkları ve bir sonraki olası hamleleri belirleyin   |  Trendlerin en erken sinyallerini ve gücünü alın   |  Geri dönüşten önce net çıkışlar alın   |  Fiyatın test edeceği Fibo seviyelerini tespit edin Gecikmesiz, takip edilmeyen gösterge - manuel ve otomatik ticaret için ideal - tüm varlıklar ve tüm zaman birimleri için uygun Sınırlı süreli teklif >>   %50 İNDİRİM Satın aldıktan sonra, kişiselleştirilmiş ayarlar için bu kanaldan benimle iletişime geçin . MT5   sürümü:   buraya tıklayın Tam y
ADR Ters Çevirme Göstergesi, normal ortalama günlük aralığına göre fiyatın şu anda nerede işlem gördüğünü bir bakışta size gösterir. Fiyat, ortalama aralığı ve seçtiğiniz seviyenin üzerindeki seviyeleri aştığında, açılır pencere, e-posta veya push yoluyla anında uyarılar alacaksınız, böylece hızlı bir şekilde geri çekilmelere ve geri dönüşlere atlayabilirsiniz. Gösterge, grafikte ortalama günlük aralık uç noktalarında yatay çizgiler ve ayrıca fiyatları aşan matematiksel olasılıkları olan seviye
Full Forex Market View Dashboard
Opengates Success International
5 (2)
TAM FOREX PİYASASI GÖRÜNÜMÜ Pano Göstergesi Bu, Yatırımcılara piyasada neler olup bittiğine dair tam bir görüş sağlamak için oluşturulmuş özel bir göstergedir. Piyasaya erişmek ve başarılı ticaret yapmak için gereken her türlü bilgiyi görüntülemek için gerçek zamanlı bir veri kullanır. KURULUM: Bu Göstergeyi pencere grafiğinize eklemeden önce, MT4'ünüzün Piyasa İzleme paneline gidin ve ihtiyaç duymadığınız veya ticaret yapmadığınız tüm Döviz çiftlerini GİZLEYİN ve geri kalanını orada bı
ECM Elite Channel is a volatility-based indicator, developed with a specific time algorithm, which consists of finding possible corrections in the market. This indicator shows two outer lines, an inner line (retracement line) and an arrow sign, where the channel theory is to help identify overbought and oversold conditions in the market. The market price will generally fall between the boundaries of the channel. If prices touch or move outside the channel, it's a trading opportunity. The
Tanıtım       Kuantum Trend Keskin Nişancı Göstergesi   , trend tersine dönmeleri belirleme ve ticaret yapma şeklinizi değiştiren çığır açan MQL5 Göstergesi! 13 yılı aşkın ticaret tecrübesine sahip deneyimli tüccarlardan oluşan bir ekip tarafından geliştirilmiştir.       Kuantum Trend Keskin Nişancı Göstergesi       trend dönüşlerini son derece yüksek doğrulukla belirlemenin yenilikçi yolu ile ticaret yolculuğunuzu yeni zirvelere taşımak için tasarlanmıştır. ***Kuantum Trend Keskin Nişancı Gö
Yazarın diğer ürünleri
This indicator will draw patterns based on   Rob Smith's   The Strat   as they emerge in real time on your chart. As price evolves,   TheStrat   offers 18 distinct price action patterns that can help you get good entries in the market. Each pattern involves two or three candles, and this indicator will draw a bounding box around the candles and name the pattern. The indicator also shows when a potential setup is forming, known by stratters as an Actionable signal. Candles Each candle is de
Bu gösterge, farklı zaman ölçeklerinde birçok grafiğin gözden geçirilmesini daha hızlı ve daha kolay hale getirmek için tasarlanmıştır. Birden fazla grafikte Zaman ve Fiyatı İzleyin Bir grafikteki Sembolü Değiştirin ve aynı sembolün diğer tüm çizelgeleri de değişecektir. Kullanımı kolay, ustalaşması hızlı Gösterge, aynı Sembolde açık olan diğer tüm grafiklerde fare işaretçisinin geçerli grafikte bulunduğu fiyatı ve zamanı belirlemenize olanak tanır. Bu, birden fazla grafikteki bilgileri hızlı bi
TheStrat TFC Monitor MT5
Robert Gerald Wood
5 (1)
The Strat   kullanarak işlem yaparken, birden çok zaman dilimine göz kulak olmak önemlidir. Bu gösterge, her zaman dilimi için mevcut mumun Günlük, Haftalık, Aylık ve Üç Aylık durumunu gösterecektir. Daire simgesi, o zaman dilimindeki mumun şu anda TheStrat terminolojisinde bir Inside veya Type 1 olduğunu gösterir. Bir Inside Day mumu, fiyat hareketini pekiştiriyor ve biz, aralığın kırılmasını arıyoruz. Yukarıyı veya aşağıyı gösteren bir Üçgen simgesi, trend olan bir mum veya TheStrat terminoloj
Multi Chart Crosshairs
Robert Gerald Wood
5 (2)
This indicator is designed to make reviews of many charts on different timescales quicker, and easier to do. Track Time and Price across multiple charts Change Symbol on one chart and all other charts of the same symbol will be changed too. Easy to use, quick to master The indicator allows you to identify the price and time where the mouse pointer is on the current chart, across all other charts open on the same Symbol. This allows you to quickly see information on multiple charts whereas normal
TheStrat Monitor
Robert Gerald Wood
3 (2)
If you've not already learnt about The Strat trading strategy , go google it now. I promise it won't be a waste of your time, and you will likely learn some new tricks whether you use it or not. OK, so now you know what TheStrat is, you will be able to understand what this indicator can do for you. Key Features In short, the Indicator will: Show Timeframe Continuity for all supported timeframes Supports two timeset views, Day trader and Swing trader Show when Full Timeframe Continuity is in pl
TheStrat Levels
Robert Gerald Wood
This indicator draws the prior Highs and Lows for multiple timeframes, and can display potential Take Profit and Stop Loss levels. In Rob Smith's # The Strat   terms,   these are potential entry points, or alternatively potential targets for open positions. I like to use them in both ways. On a lower timeframe, say 5 minutes to get a good entry on a daily or weekly level, and then as a potential target. Very small stops required giving an excellent risk/reward ratio. Please watch the DEMO video
TheStrat Levels MT5
Robert Gerald Wood
5 (1)
This indicator draws the prior Highs and Lows for multiple timeframes, and can display potential Take Profit and Stop Loss levels. In Rob Smith's # The Strat  terms, these are potential entry points, or alternatively potential targets for open positions. I like to use them in both ways. On a lower timeframe, say 5 minutes to get a good entry on a daily or weekly level, and then as a potential target. Very small stops required giving an excellent risk/reward ratio. Key Features  - Levels from Ho
Bu Komut Dosyası, trend çizgileri, Fibonachi Düzeltmeleri vb. gibi herhangi bir türdeki çizim nesnelerini bir veya daha fazla başka grafiğe kopyalamanıza olanak tanır. Varsayılan olarak komut dosyası, geçerli grafikteki, yani komut dosyasının uygulandığı grafikteki tüm nesneleri, o anda yüklü olan aynı Symbol'ün diğer herhangi bir grafiğine kopyalar. Ayarlar HedefZaman Dilimi PERIOD_CURRENT dışında herhangi bir değere ayarlandığında, nesneleri komut dosyasının uygulandığı grafikle aynı Sem
FREE
Aralık Tükenmesi, fiyat cari dönem için beklenen aralığı karşıladığında veya aştığında gerçekleşir. Bu seviyelerde fiyat, dönemin başına göre momentumunu kaybetmeye başlar, bu nedenle yeni pozisyonlar almadığınızdan emin olmak için iyi bir nokta. Bu gösterge, Günlük, Haftalık ve Aylık dönemler için seviyeleri göstererek, grafiğinizde bunun olma olasılığının yüksek olduğu yerleri size gösterecektir. Fiyatların bu tükenme seviyelerini aştığını gördüğünüzde, bu size hareketin arkasındaki momentumun
Active Pivot Levels
Robert Gerald Wood
5 (1)
Pivot seviyeleri, her pazarda tanınan, iyi kurulmuş bir teknik seviyedir. Bu gösterge, herhangi bir sembol için mevcut Üç Aylık, Aylık, Haftalık, Günlük ve dört saatlik pivotları grafik üzerinde çizecektir. Ayrıca her dönem için Destek ve Direnç seviyelerini gösterebilir ve 1 ile 4 arasındaki seviyelerden hangisinin görüntüleneceğini seçebilirsiniz.     Şunlardan Pivot türünü seçin: Standart Camarilla DeMark Ormancı Fibonacci Lütfen dikkat, DeMark pivotlarının orijinal spesifikasyona göre tek bi
TheStrat Candles
Robert Gerald Wood
4.5 (2)
Bu gösterge, her mumun üstüne veya altına bir etiket çizecektir.       Rob Smith'in       Strat       grafiğinizde zamanla geliştikçe. Fiyat geliştikçe, bir mum üç durum arasında geçiş yapabilir. Mum ilk açıldığında, önceki yüksek ve alçak mumların içine tamamen oturursa, o zaman Tip 1 olarak başlar. tip 2 ve fiyat hareketi değişken ve yönsüz ise, önceki mumun karşı tarafını kırabilir ve tip 3 olabilir. mumlar Her mum, önceki mumla olan ilişkisi ile tanımlanır. Tip 1 - İç mum   - Mum tam
This indicator will draw a label above or below each candle based on   Rob Smith's   The Strat   as they develop over time on your chart. As price evolves, a candle can switch between three states. When the candle first opens, if it sits completely within the previous candles high and low, then it will start as a Type 1. As time moves on, if it breaks either the high or low of the previous candle, it will be come a type 2, and should the price action be volatile and directionless, it may then
A simple script that can delete all the drawing objects on a chart, or just the objects of a specific type. Settings: DeleteObjectsOfType By default the value will be blank which means ALL drawing objects on the chart will be deleted. If you only wish to delete specific types of drawing object, change this setting to the type of object to delete. For example, Fibonacci Retracement, Text, Label or Trend Line. Please see the demonstration video for more information.
FREE
This script allows you to toggle the "Show Trade Levels" option, but for the current chart only. Normally, you can only change the setting using the Options -> Chart menu for ALL charts, but this script allows you to do it for a SINGLE chart. I'm using it when I take screenshots, because most of the time I'm not trying to show the trades, just some functionality of one of my other tools. Iif you need that functionality, then this script is very helpful! If the script helps you, please let me
FREE
This indicator will draw patterns based on Rob Smith's The Strat as they emerge in real time on your chart. As price evolves, TheStrat offers 18 distinct price action patterns that can help you get good entries in the market. Each pattern involves two or three candles, and this indicator will draw a bounding box around the candles and name the pattern. The indicator also shows when a potential setup is forming, known by stratters as an Actionable signal. Candles Each candle is defined by i
TheStrat FTFC
Robert Gerald Wood
FTFC, Rob Smith'in   The Strat   tarafından tanımlandığı şekliyle Tam Zaman Çerçevesi Sürekliliği anlamına gelir. Bu gösterge grafikte iki çizgi çizer; Üç Aylık, Aylık, Haftalık, Günlük veya Saatlik açılış seviyelerinin en yükseği ve bu değerlerin en küçüğünün ikincisi. Bu size, ticaretin tek yönde çok güçlü olma olasılığının daha yüksek olduğu bir kanal verir. Satırlar arasında fiyat hareketi daha dalgalı olacak ve daha geniş stoplar kullanabilirsiniz. Yüksekler ve alçaklar arasındaki orta nokt
Piyasalar yuvarlak rakamları gerçekten sever ve genellikle düşen bir piyasada destek veya fiyat yükselirken direnç olarak hareket ederler. Bu gösterge, Yuvarlak değerlerde fiyat seviyeleri çizmek için tasarlanmıştır. Bunu otomatik olarak yapar, ancak bunu geçersiz kılma ve görmek istediğiniz seviyeleri belirleme seçeneğiniz de vardır. Yuvarlak bir seviye 10'luk adımlar kadar basit olabilir, yani 10, 20, 30 vb. Gösterge, her biri farklı formatta olan Major ve Minor olmak üzere iki sınıf çizgi çiz
The Strat   kullanarak işlem yaparken, birden çok zaman dilimine göz kulak olmak önemlidir. Bu gösterge, her zaman dilimi için mevcut mumun Günlük, Haftalık, Aylık ve Üç Aylık durumunu gösterecektir. Daire simgesi, o zaman dilimindeki mumun şu anda TheStrat terminolojisinde bir Inside veya Type 1 olduğunu gösterir. Bir Inside Day mumu, fiyat hareketini pekiştiriyor ve biz, aralığın kırılmasını arıyoruz. Yukarıyı veya aşağıyı gösteren bir Üçgen simgesi, trend olan bir mum veya TheStrat terminoloj
ATR Extremes
Robert Gerald Wood
Ortalama Gerçek Aralık (ATR), belirli bir süre boyunca fiyattaki hareket miktarını ölçen yaygın olarak kullanılan bir göstergedir. Ancak verdiği değerin herhangi bir sınır içinde tanımlanmaması, zararı durdur veya kar al hesaplamaları dışında herhangi bir amaçla kullanılmasını neredeyse imkansız hale getirir. Bu gösterge, standart ATR göstergenizdir, ancak uç noktaları görebilmeniz için yüzdelik sınırlar ekledik. Yüzdelikler ile Bölünmüş Medyanlar dediğimiz bir şey arasında seçim yapabilirs
Range Exhaustion
Robert Gerald Wood
Aralık Tükenmesi, fiyat cari dönem için beklenen aralığı karşıladığında veya aştığında gerçekleşir. Bu seviyelerde fiyat, dönemin başına göre momentumunu kaybetmeye başlar, bu nedenle yeni pozisyonlar almadığınızdan emin olmak için iyi bir nokta. Bu gösterge, Günlük, Haftalık ve Aylık dönemler için seviyeleri göstererek, grafiğinizde bunun olma olasılığının yüksek olduğu yerleri size gösterecektir. Fiyatların bu tükenme seviyelerini aştığını gördüğünüzde, bu size hareketin arkasındaki momentumun
FTFC, Rob Smith'in   The Strat   tarafından tanımlandığı şekliyle Tam Zaman Çerçevesi Sürekliliği anlamına gelir. Bu gösterge grafikte iki çizgi çizer; Üç Aylık, Aylık, Haftalık, Günlük veya Saatlik açılış seviyelerinin en yükseği ve bu değerlerin en küçüğünün ikincisi. Bu size, ticaretin tek yönde çok güçlü olma olasılığının daha yüksek olduğu bir kanal verir. Satırlar arasında fiyat hareketi daha dalgalı olacak ve daha geniş stoplar kullanabilirsiniz. Yükselişler ve düşüşler arasındaki orta no
TheStrat Monitor MT5
Robert Gerald Wood
5 (1)
Henüz   Strat ticaret stratejisini   öğrenmediyseniz, şimdi google'a gidin. Vaktini boşa harcamayacağına söz veriyorum ve kullansan da kullanmasan da muhtemelen bazı yeni numaralar öğreneceksin. Tamam, artık TheStrat'ın ne olduğunu biliyorsunuz, bu göstergenin sizin için neler yapabileceğini anlayabileceksiniz. Ana Özellikler Kısacası, Gösterge şunları yapacaktır: Desteklenen tüm zaman dilimleri için Zaman Çerçevesi Sürekliliğini Göster İki zaman seti görünümünü destekler, Günlük tüccar ve Swi
Pivot seviyeleri, her pazarda tanınan, iyi kurulmuş bir teknik seviyedir. Bu gösterge, herhangi bir sembol için mevcut Üç Aylık, Aylık, Haftalık, Günlük ve dört saatlik pivotları grafik üzerinde çizecektir. Ayrıca her dönem için Destek ve Direnç seviyelerini gösterebilir ve 1 ile 4 arasındaki seviyelerden hangisinin görüntüleneceğini seçebilirsiniz.     Şunlardan Pivot türünü seçin: Standart Camarilla DeMark Ormancı Fibonacci Lütfen dikkat, DeMark pivotlarının orijinal spesifikasyona göre tek bi
Piyasalar yuvarlak rakamları gerçekten sever ve genellikle düşen bir piyasada destek veya fiyat yükselirken direnç olarak hareket ederler. Bu gösterge, Yuvarlak değerlerde fiyat seviyeleri çizmek için tasarlanmıştır. Bunu otomatik olarak yapar, ancak bunu geçersiz kılma ve görmek istediğiniz seviyeleri belirleme seçeneğiniz de vardır. Yuvarlak bir seviye 10'luk adımlar kadar basit olabilir, yani 10, 20, 30 vb. Gösterge, her biri farklı formatta olan Major ve Minor olmak üzere iki sınıf çizgi çiz
ATR Extremes MT5
Robert Gerald Wood
Ortalama Gerçek Aralık (ATR), belirli bir süre boyunca fiyattaki hareket miktarını ölçen yaygın olarak kullanılan bir göstergedir. Ancak verdiği değerin herhangi bir sınır içinde tanımlanmaması, zararı durdur veya kârı al hesaplamaları dışında herhangi bir amaçla kullanılmasını neredeyse imkansız hale getirmektedir. Bu gösterge sizin standart ATR göstergenizdir, ancak uç noktaları görebilmeniz için yüzdelik dilimler ekledik. Yüzdelikler ile Bölünmüş Medyanlar dediğimiz bir şey arasında seçim yap
Filtrele:
İnceleme yok
İncelemeye yanıt
Sürüm 1.20 2022.08.09
Fixed bug in calculation of Quarterly start where sometimes it failed to find an accurate start bar.
Sürüm 1.10 2021.07.14
Fix for issues when changing the type of price to track.