• Обзор
  • Отзывы (6)
  • Обсуждение (4)
  • Что нового

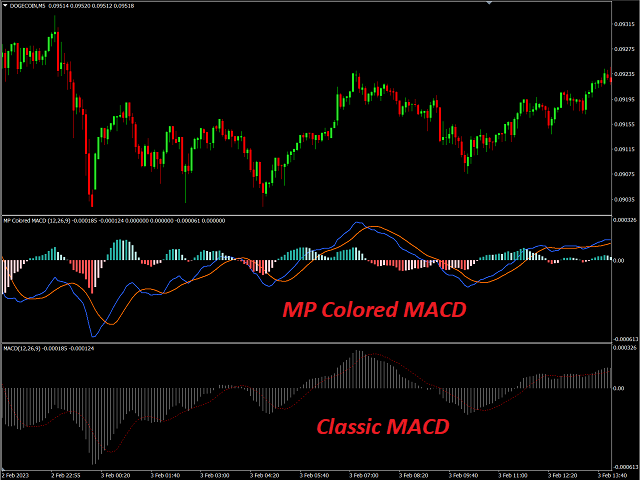
MP Colored MACD for MT5

5
MACD (short for Moving Average Convergence/Divergence) is a popular trading indicator used in technical analysis of securities prices. It is designed to identify changes in the strength, direction, momentum, and duration of a trend in a security's price.

History

  1. Gerald Appel created the MACD line in the late 1970s.
  2. Thomas Aspray added the histogram feature to Appel's  MACD in 1986.


The three major components and their formula

1. The MACD line:

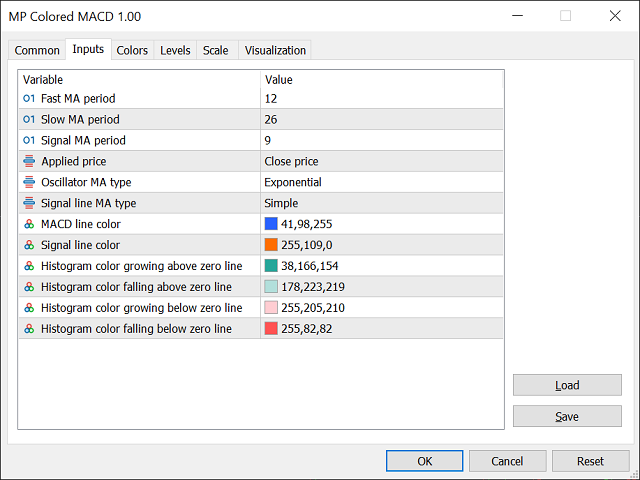
First, "PM Colored MACD" employs two Moving Averages with varying lengths of usually the close prices (which are lagging indicators) to identify trend direction and duration. The most commonly used values are 26 periods for the longer term MA and 12 periods for the shorter term MA, but it is the trader's choice. Then, PM Colored MACD takes the difference in values between those two Moving Averages. This line is used to identify trend direction and duration.

MACD = Fast MA - Slow MA

2. The Signal line:

The Signal Line is a Moving Average of the MACD Line. Although 9 is the most common period length for this MA but it can be chosen by trader.

Signal Line = MA of MACD Line
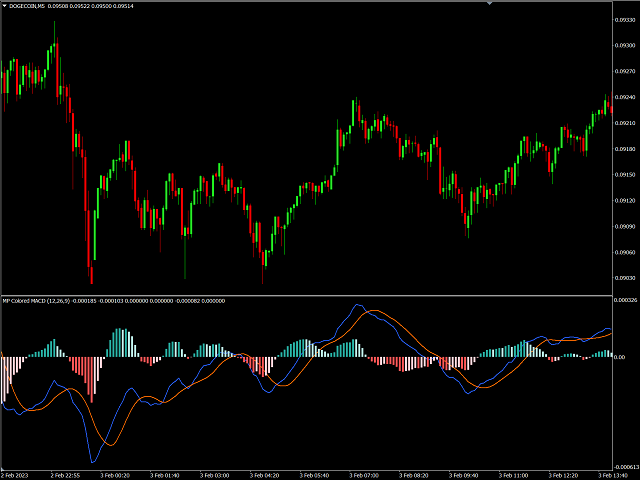
3. The histogram:

The difference between the MACD Line and Signal Line is plotted as a histogram which oscillates above and below a center Zero Line. The histogram is used as a good indication of a security's momentum.

Histogram = MACD line - Signal line

Download Impulse MACD, an enhanced version of Colored MACD here.

Trading interpretation:

In general, when MACD is positive and the histogram value is increasing, then upside momentum is increasing. When MACD is negative and the histogram value is decreasing, then downside momentum is increasing.

Signal line crossover:

A "Signal line crossover" occurs when the MACD and Signal lines cross. When the MACD line crosses up through the Signal line (a "bullish" crossover) it is a recommendation to buy , or to sell if it crosses down through the Signal line (a "bearish" crossover).

Zero crossover:

A "zero crossover" event occurs when the MACD series changes sign, that is, the MACD line crosses the horizontal zero axis. A change from positive to negative MACD is interpreted as "bearish", and from negative to positive as "bullish". Zero crossovers provide evidence of a change in the direction of a trend but less confirmation of its momentum than a signal line crossover.

Divergence:

A "positive divergence" or "bullish divergence" occurs when the price makes a new lower low but the MACD does not confirm it and records a higher low. A "negative divergence" or "bearish divergence" occurs when the price makes a new higher high but the MACD records a lower high.

#Tags: MACD, MACD, Moving Average Convergence Divergence, Colored MACD, Extended MACD, Multicolor MACD, MultiColored MACD, Multi-color MACD, Multi-Colored MACD, Two line MACD,  Extended MultiColored MACD, Advanced MACD, Enhanced MACD, Signal, Momentum Indicator, Momentum

___________________________________________________________________________________

Disclaimer:
Do NOT trade or invest based upon the analysis presented on this channel. Always do your own research and due diligence before investing or trading. I’ll never tell you what to do with your capital, trades or investments. I’ll also never recommend for you to buy, sell, long or short any asset, commodity, security, derivative or cryptocurrency related instrument as it's extremely HIGH RISK! You should always consult with a professional/licensed financial adviser before trading or investing in any type of assets.

Отзывы 6
tenomi
34
tenomi 2023.06.20 19:33 
 

i bought the indicator and can not get it attached to my chart? can you advise please? thanks

it shows up in the Navigator yes, downloaded Version 1.1

When i click attach nothing happens. no error just not coming up on my chart?

Рекомендуем также
Trend Trading - это индикатор, предназначенный для получения максимальной прибыли от трендов, происходящих на рынке, путем определения времени отката и прорыва. Он находит торговые возможности, анализируя, что делает цена во время установленных тенденций. [ Руководство по установке | Руководство по обновлению | Устранение неполадок | FAQ | Все продукты ] Торгуйте на финансовых рынках с уверенностью и эффективностью Прибыль от устоявшихся тенденций без проволочек Признать прибыльные откаты,
Усовершенствованная версия бесплатного индикатора HMA Trend (для MetaTrader 4), с возможностью статистического анализа HMA Trend - трендовый индикатор, базирующийся на скользящей средней Хала (Hull Moving Average - HMA) с двумя периодами. HMA с медленным периодом определяет тренд, HMA с быстрым периодом - краткосрочные движения и сигналы в сторону тренда Главные отличия от бесплатного варианта: Возможность предсказать вероятность разворота тренда с помощью анализа исторических данных Построени
Description : Rainbow EA MT5 is a simple Expert advisor based on   Rainbow MT5 indicator witch is based on Moving average with period 34. The indicator is incorporated in the EA, therefore, it is not required for the EA to operate, but if you wish, you can download it from   my product page . The Expert Advisor settings are as follows : Suitable for Timeframes up to H1 The parameters below can be set according to your trading rules. StopLoss ( Stop Loss in pips) TakeProfit ( Take Profit in pi
Данный индикатор аналогичен популярному Heiken Ashi Smoothed. Для MetaTrader 5 уже есть индикатор Heikin Ashi, но он обладает двумя недостатками: Он не точно рисует свечи. Невозможно изменить ширину свечей. Посмотрите также Heikin Ashi в MQL5 Code Base . В данной версии отсутствуют вышеописанный недостатки.
Профиль Рынка (Market Profile) определяет ряд типов дней, которые помогают трейдеру распознать поведение рынка. Ключевая особенность - это область значений (Value Area), представляющая диапазон ценового действия, в котором произошло 70% торговли. Понимание области значений может помочь трейдерам вникнуть в направление рынка и установить торговлю с более высокими шансами на успех. Это отличное дополнение к любой системе, которую вы возможно используете. Blahtech Limited представляет сообществу Me
FXC iMACD-DivergencE MT5 Indicator This is an advanced MACD indicator that finds trend-turn divergences on the current symbol. The indicator detects divergence between the MACD and the price movements as a strong trend-turn pattern. Main features: Advanced divergence settings Price based on Close, Open or High/Low prices Give Buy/Sell open signals PUSH notifications E-mail sending Pop-up alert Customizeable Information panel Input parameters: MACD Fast-EMA: The Fast-EMA variable of the MACD
US30NinjaMT5
Satyaseelan Shankarananda Moodley
US30 Ninja is a 5 minute scalping indicator that will let know you when there is a trade set up (buy or sell). Once the indicator gives the trade direction, you can open a trade and use a 30 pip stop loss and a 30 pip to 50 pip take profit. Please trade at own own risk. This indicator has been created solely for the US30 market and may not yield positive results on any other pair. 
Данный индикатор вычисляет формулу MACD для объемо-ориентированных индикаторов Accumulation/Distribution и OnBalance Volumes . Помимо тиковых объемов он поддерживает расчеты со специальными псевдо-реальными объемами, эмулируемыми для символов Форекс, где реальные объемы не известны. Подробности о данных "суррогатных" объемах можно узнать в описании других индикаторов - TrueVolumeSurrogate и OnBalanceVolumeSurrogate (алгоритм последнего используется внутри MACDAD для подготовки значений AD и OBV
Индикатор строит текущие котировки, которые можно сравнить с историческими и на этом основании сделать прогноз ценового движения. Индикатор имеет текстовое поле для быстрой навигации к нужной дате. Параметры : Symbol - выбор символа, который будет отображать индикатор; SymbolPeriod - выбор периода, с которого индикатор будет брать данные; IndicatorColor - цвет индикатора; Inverse - true переворачивает котировки, false - исходный вид; Далее идут настройки текстового поля, в которое можн
Gioteen Volatility Index (GVI) - your ultimate solution to overcoming market unpredictability and maximizing trading opportunities. This revolutionary indicator helps you in lowering your losing trades due to choppy market movements. The GVI is designed to measure market volatility, providing you with valuable insights to identify the most favorable trading prospects. Its intuitive interface consists of a dynamic red line representing the volatility index, accompanied by blue line that indicate
Версия MT4   |   FAQ Индикатор Owl Smart Levels – это полноценная торговая система внутри одного индикатора, которая включает в себя такие популярные инструменты анализа рынка как усовершенствованные фракталы Билла Вильямса , Valable ZigZag, который строит правильную волновую структуру рынка, а также  уровни Фибоначчи, которые   отмечают точные уровни входа в рынок и места взятия прибыли. Подробное описание стратегии Инструкция по работе с индикатором Советник-помошник в торговле Owl Helper При
Простая, но эффектиная система для определения форекс-тренда. Представляет собой два индикатора в одном: Heiken Ashi и Heiken Ashi Smoothed Moving Average (сглаженная скользящая средняя). Heiken Ashi (HA) и Heiken Ashi Smoothed (HAS) рассчитываются в рамках одного события с необходимыми буферами и циклом, повышая скорость их работы, улучшая оптимизацию и эффективность . По вашему выбору на графике могут отображаться одновременно оба индикатра или только один. Входные параметры Display Heiken A
Данный индикатор предназначен для сравнения силы валютных пар. Индикатор сравнивает валютные пары. Трендовая линия в Currency Strength рисуется на основе всех выбранных валютных пар, что позволяет отчетливее видеть движения рынка. Чем выше линия валютной пары, тем больше ее сила. Входные параметры: Вы можете выбрать 3 пары для сравнения; Вы можете указать базовую дату - дату начала расчетов силы валютных пар.
To get access to MT4 version please click here . - This is the exact conversion from TradingView: "Stochastic Momentum Index" By "UCSgears". - This is a popular version of stochastic oscillator on tradingview. - This is a light-load processing and non-repaint indicator. - Buffers are available for the lines on chart. - You can message in private chat for further changes you need. Thanks for downloading
Noize Absorption Index - is the manual trading system that measures the difference of pressure between bears forces and bulls forces. Green line - is a noize free index that showing curent situation. Zero value of index shows totally choppy/flat market.Values above zero level shows how powerfull bullish wave is and values below zero measures bearish forces.Up arrow appears on bearish market when it's ready to reverse, dn arrow appears on weak bullish market, as a result of reverse expectation.
Мультивалютный и мультитаймфреймовый индикатор Relative Strength Index (RSI). В параметрах вы можете указать любые желаемые валюты и таймфреймы. Также индикатор может отправлять уведомления при пересечении уровней перекупленности и перепроданности. По клику на ячейке с периодом будет открыт данный символ и период. Параметры RSI Period   — период усреднения; RSI Applied price   — тип цены; Clear the chart at startup   — очистить чарт при старте; Set of Pairs   — набор символов — Market Wat
Этот продукт позволит Вам выгодно приобреcти и использовать два самых популярных продукта для анализа объемов заявок и сделок на биржевых рынках: Actual Depth of Market Chart Actual Tick Footprint Volume Chart Данный продукт вобрал в себя всю мощь каждого отдельного индикатора и оформлен в виде одного файла. Функционал продукта Actual COMBO Depth of Market AND Tick Volume Chart полностью идентичен оригинальным индикаторам. Вы оцените удобство объединения этих двух продуктов в один супер-индикато
Volality Index scalper indicator  Meant for Volality pairs such as Volality 10, 25, 50, 75 and 100 The indicator works on all timeframes from the 1 minute to the monthly timeframe the indicator is non repaint the indicator has 3 entry settings 1 color change on zero cross 2 color change on slope change 3 color change on signal line cross Orange line is your sell signal Blue line is your buy signal.
Supertrend indicator uses a combination of a moving average and average true range to detect the trend of a trading instrument. Supertrend indicator for MetaTrader 5 easily shows the trend as a line following the price. Triple SuperTrend Histo indicator  calculate  three supertrends to show the trend as a histogram. Changing the color from red to green means you can BUY , from green to red means you can SELL . Description of the method of drawing a histogram. The price is above the EMA 20
Introducing the Consecutive Green/Red Candle Alert Indicator for MT5 - Your Trend Spotting Companion! Are you ready to take your trading to the next level? We present the Consecutive Green/Red Candle Alert Indicator, a powerful tool designed to help you spot trends and potential reversals with ease. Whether you're a new trader looking for clarity in the market or an experienced pro seeking additional confirmation, this indicator is your trusted companion. Key Features of the Consecutive Gre
Индикатор отображает матрицу индикаторов по нескольким таймфреймам с общей суммой и отключаемыми оповещениями. В матрицу можно добавить пользовательские индикаторы с возможностью гибкой настройки. Порог оповещений можно настроить таким образом, чтобы указывался процент согласованности индикаторов для срабатывания оповещения. Оповещения можно включить/отключить при помощи полей выбора на графике. Также можно настроить отправку уведомлений на мобильное устройство или электронную почту, в дополнени
Индикатор кумулятивной дельты Как считает большинство трейдеров, цена движется под давление рыночных покупок или продаж. Когда кто-то выкупает стоящий в стакане оффер, то сделка проходит как "покупка". Если же кто-то наливает в стоящий в стакане бид - сделка идет с направлением "продажа". Дельта - это разница между покупками и продажами. А кумулятивная дельта - разница между покупками и продажами накопленным итогом за определенный период времени. Она позволяет видеть, кто в настоящий момент конт
Система для визуализации популярных шаблонов ценовых формаций. После подключения индикатор автоматически отобразит на графике следующие формации: Пиноккио бар (“пинбар”)   - свеча с небольшим телом и длинным “носом”, очень известный разворотный шаблон; Внутренний бар   - свеча, диапазон которой лежит внутри диапазона предыдущей свечи. Такая формация представляет неопределённость рынка; Внешний бар   - свеча, диапазон которой превышает диапазон предыдущей свечи. Такая формация представляет неопре
Premium level - это уникальный индикатор с точностью правильных прогнозов  более 80%!  Данный индикатор тестировался более двух месяцев лучшими Специалистами в области Трейдинга!  Индикатор авторский такого вы больше не где не найдете!  По скриншотах можете сами увидеть точностью данного инструмента!  1 отлично подходит для торговли бинарными опционами со временем экспирации на 1 свечу. 2 работает на всех валютных парах, акциях, сырье, криптовалютах Инструкция: Как только появляется красная стре
This indicator provides an original mix of WPR, VSA, and volume delta. It shows ratio of buy/sell volumes scaled on 100% range based on total volume change for a selected period. The convetional VSA (Volume Spread Analysis) studies interconnections of price action and volume change in absolute values, whereas WPR (Williams Percent Range) offers a convenient approach of price moves normalization into the fixed percentage metric: 0 - 100%. Hence overbough and oversold states are easily spotted. N
Indicator and Expert Adviser  EA Available in the comments section of this product. Download with Indicator must have indicator installed for EA to work. Mt5 indicator alerts for bollinger band and envelope extremes occurring at the same time. Buy signal alerts occur when A bullish candle has formed below both the lower bollinger band and the lower envelope  Bar must open and close below both these indicators. Sell signal occur when A bear bar is formed above the upper bollinger band and upp
Получайте уведомления о каждом изменении цвета свечей Heiken Ashi (HA). Индикатор будет показывать прошедшие и новые сигналы каждый раз при изменении цвета свечей HA. ( Примечание : этот инструмент основан на коде индикатора Heiken Ashi, разработанного MetaQuotes Software Corp.) Особенности Сигналы срабатывают при закрытии последнего бара/открытии нового бара; Можно включить любые виды предупреждений: диалоговое окно, сообщение по электронной почте, SMS-уведомления для смартфонов и планшетов,
To get access to MT4 version please click here . This is the exact conversion from TradingView: "[SHK] Schaff Trend Cycle (STC)" by "shayankm". This is a light-load processing indicator. This is a non-repaint indicator. Buffers are available for processing in EAs. All input fields are available. You can message in private chat for further changes you need. Thanks for downloading
Коробка Ганна (или Квадрат Ганна) — метод анализа рынка по статье Уильяма Ганна «Математическая формула для предсказания рынка» (W.D. Gann "Mathematical formula for market predictions"). Этот индикатор может строить три модели Квадратов: 90, 52(104), 144. Шесть вариантов сеток и два варианта дуг. Вы можете построить, одновременно, несколько квадратов на одном графике. Параметры Square — выбор модели квадрата: 90 — квадрат 90 (или квадрат девяти); 52 (104) — квадрат 52 (или 104); 144 — универс
С этим продуктом покупают
Прежде всего стоит подчеркнуть, что этот торговый индикатор не перерисовывается, не перерисовывает и не отставает, что делает его идеальным как для ручной, так и для роботизированной торговли. Руководство пользователя: настройки, вводы и стратегия. Атомный аналитик - это индикатор ценового действия PA, который использует силу и импульс цены, чтобы найти лучший край на рынке. Оборудованный расширенными фильтрами, которые помогают убирать шумы и ложные сигналы, и повышают торговый потенциал. Испо
Прежде всего стоит подчеркнуть, что эта торговая система является индикатором без перерисовки, без повторной отрисовки и без задержки, что делает ее идеальной как для ручной, так и для роботизированной торговли. Онлайн курс, руководство и загрузка пресетов. «Smart Trend Trading System MT5» - это комплексное торговое решение, созданное для новичков и опытных трейдеров. Он объединяет более 10 премиальных индикаторов и предлагает более 7 надежных торговых стратегий, что делает его универсальным
Представляем       Quantum Breakout PRO   , новаторский индикатор MQL5, который меняет ваш способ торговли в зонах прорыва! Разработан командой опытных трейдеров со стажем торговли более 13 лет,       Квантовый прорыв PRO       разработан, чтобы поднять ваше торговое путешествие к новым высотам с его инновационной и динамичной стратегией зоны прорыва. Quantum Breakout Indicator покажет вам сигнальные стрелки на зонах прорыва с 5 целевыми зонами прибыли и предложением стоп-лосса на основе по
FX Volume MT5
Daniel Stein
4.94 (17)
Получайте ежедневную информацию о рынке с подробностями и скриншотами в нашем утреннем брифинге здесь, на mql5 , и в Telegram ! FX Volume - это ПЕРВЫЙ и ЕДИНСТВЕННЫЙ индикатор объема, который дает РЕАЛЬНОЕ представление о настроении рынка с точки зрения брокера. Он дает потрясающее представление о том, как институциональные участники рынка, такие как брокеры, позиционируют себя на рынке Forex, гораздо быстрее, чем отчеты COT. Видеть эту информацию прямо на своем графике - это настоящий геймчей
Представляем       Индикатор Quantum Trend Sniper   , инновационный индикатор MQL5, который меняет способ определения разворотов тренда и торговли ими! Разработан командой опытных трейдеров со стажем торговли более 13 лет,       Снайперский индикатор Quantum Trend       разработан, чтобы вывести ваше торговое путешествие на новые высоты благодаря инновационному способу определения разворотов тренда с чрезвычайно высокой точностью. ***Купите индикатор Quantum Trend Sniper и получите индикатор
Раскройте силу торговли трендами с помощью индикатора Trend Screener: вашего идеального решения для торговли трендами, основанного на нечеткой логике и мультивалютной системе! Повысьте уровень своей торговли по тренду с помощью Trend Screener, революционного индикатора тренда, основанного на нечеткой логике. Это мощный индикатор отслеживания тренда, который сочетает в себе более 13 инструментов и функций премиум-класса и 3 торговые стратегии, что делает его универсальным выбором для превращения
Важным ключевым элементом в трейдинге являются зоны или уровни, от которых принимаются решения о покупке или продаже торгового инструмента. Несмотря на попытки крупных игроков скрыть свое присутствие на рынке, они неизбежно оставляют следы. Наша задача заключалась в том, чтобы научиться находить эти следы и правильно их интерпретировать. Первые Импульсные Уровни (ПИУ)     -      Reversal First Impulse levels (RFI)   -  Version MT4                INSTRUCTIONS                 RUS                
Сейчас 147 долл. США (увеличиваясь до 499 долл. США после нескольких обновлений) - неограниченные учетные записи (ПК или Mac) Руководство пользователя + Обучающие видео + Доступ к приватному Discord-каналу + VIP-статус и мобильная версия + Лицензия на 5 ПК с неограниченным количеством аккаунтов и терминалов MT4. Сколько раз вы покупали индикатор торговли с замечательными обратными тестами, доказательствами производительности на живых счетах и зашикарными цифрами и статистикой, но после испо
TPSpro TRENDPRO   —  трендовый индикатор, который автоматически анализирует рынок и предоставляет информацию о тренде и каждой его смене а также дающий сигналы для входа в сделки без перерисовки! Индикатор использует каждую свечу, анализируя их отдельно. относя к разным импульсам – импульс вверх или вниз. Точные точки входа в сделки  для  валют, крипты, металлов, акций, индексов! -  Version MT4                ПОЛНОЕ ОПИСАНИЕ          /        СЕТАПЫ ДЛЯ ТОРГОВЛИ                        Рекоменд
Прежде всего стоит подчеркнуть, что этот Торговый Инструмент является Неперерисовывающимся Нерепейнтинговым Индикатором, что делает его идеальным для профессиональной торговли. Онлайн-курс, руководство пользователя и демонстрация. Индикатор Концепций Умного Действия Цены - очень мощный инструмент как для новичков, так и для опытных трейдеров. Он объединяет более 20 полезных индикаторов в одном, комбинируя передовые торговые идеи, такие как анализ Inner Circle Trader и стратегии торговли конц
Получайте ежедневную информацию о рынке с подробностями и скриншотами через наш утренний брифинг здесь, на mql5 , и в Telegram ! FX Power MT5 NG - это новое поколение нашего популярного измерителя силы валют FX Power. Что же предлагает этот измеритель силы нового поколения? Все, что вы любили в оригинальном FX Power ПЛЮС Анализ силы GOLD/XAU Еще более точные результаты расчетов Индивидуально настраиваемые периоды анализа Настраиваемый предел расчета для еще более высокой производительности Спец
AW Trend Predictor MT5
AW Trading Software Limited
4.77 (56)
Сочетание тренда и пробоя уровней в одной системе. Продвинутый алгоритм индикатора фильтрует рыночный шум, определяет тренд, точки входа, а также возможные уровни выхода из позиции. Сигналы индикатора записываются в статистический модуль, который позволяет выбирать наиболее подходящие инструменты, показывая эффективность истории сигналов. Индикатор рассчитывает отметки ТейкПрофитов и стоплосса. Руководство пользователя ->  ЗДЕСЬ  / MT4 версия ->  ЗДЕСЬ Как торговать с индикатором: Торговля с Tr
Топовый индикатор МТ5, дающий сигналы для входа в сделки без перерисовки! Идеальные точки входа в сделки для  валют, крипты, металлов, акций, индексов !  Смотрите  видео  (6:22) с примером отработки всего одного сигнала, окупившего индикатор. Версия индикатора для MT4 Преимущества индикатора Сигналы на вход без перерисовки Если сигнал появился, он никуда НЕ исчезает! В отличие от индикаторов с перерисовкой, которые ведут к потере депозита, потому что могут показать сигнал, а потом убрать его.
Gartley Hunter Multi - Индикатор для поиска гармонических моделей одовременно на десятках торговых инструментов и на всех классических ценовых диапазонах: (m1, m5, m15, m30, H1, H4, D1, Wk, Mn). Инструкция/Мануал ( Обязательно читайте перед приобретением ) | Версия для МТ4 Преимущества 1. Паттерны: Гартли, Бабочка, Акула, Краб. Летучая мышь, Альтернативная летучая мышь, Глубокий краб, Cypher 2. Одновременный поиск паттернов на десятках торговых инструментов и на всех классических таймфреймах
ICT, SMC, SMART MONEY CONCEPTS, SMART MONEY, Smart Money Concept, Support and Resistance, Trend Analysis, Price Action, Market Structure, Order Blocks, BOS/CHoCH,   Breaker Blocks ,  Momentum Shift,   Supply&Demand Zone/Order Blocks , Strong Imbalance,   HH/LL/HL/LH,    Fair Value Gap, FVG,  Premium  &   Discount   Zones, Fibonacci Retracement, OTE, Buy Side Liquidity, Sell Side Liquidity, BSL/SSL Taken, Equal Highs & Lows, MTF Dashboard, Multiple Time Frame, BigBar, HTF OB, HTF Market Structure
Это, пожалуй, самый полный индикатор автоматического распознавания гармонического ценообразования, который вы можете найти для платформы MetaTrader. Он обнаруживает 19 различных паттернов, воспринимает проекции Фибоначчи так же серьезно, как и вы, отображает зону потенциального разворота (PRZ) и находит подходящие уровни стоп-лосс и тейк-профит. [ Руководство по установке | Руководство по обновлению | Устранение неполадок | FAQ | Все продукты ] Он обнаруживает 19 различных гармонических цен
Этот индикатор является уникальным, качественным и доступным инструментом для торговли, включающим в себя наши собственные разработки и новую формулу. В обновленной версии появилась возможность отображать зоны двух таймфреймов. Это означает, что вам будут доступны зоны не только на старшем ТФ, а сразу с двух таймфреймов - таймфрейма графика и старшего: отображение вложенных зон. Обновление обязательно понравится всем трейдерам, торгующим по зонам спроса и предложения. Важная информация Для мак
Индикатор Supply Demand использует предыдущее ценовое действие для выявления потенциального дисбаланса между покупателями и продавцами. Ключевым является определение зон с лучшими возможностями, а не просто вероятностей. Индикатор Blahtech Supply Demand обеспечивает функционал, не доступный ни в одной платформе. Этот индикатор 4 в 1 не только выделяет зоны с более высокой вероятностью на основе механизма оценки силы по множественным критериям, но также комбинирует его с мульти-таймфреймовым ана
IX Power , наконец, предлагает непревзойденную точность FX Power для нефорексных символов. Он точно определяет интенсивность краткосрочных, среднесрочных и долгосрочных трендов в ваших любимых индексах, акциях, товарах, ETF и даже криптовалютах. Вы можете   анализировать все, что   может предложить ваш терминал. Попробуйте и почувствуйте, как   значительно улучшается ваш тайминг   при торговле. Ключевые особенности IX Power 100% точные результаты расчетов без перерисовки - для всех торгов
Step into the realm of Forex trading with confidence and precision using XQ, a cutting-edge Forex indicator designed to elevate your trading game to unprecedented heights. Whether you're a seasoned trader or just stepping into the world of currency exchange, XQ Forex Indicator empowers you with the insights and signals needed to make informed trading decisions. The signal conditions are a combination of three indicators, and XQ Forex Indicator only display  medium and long-term trends . The ind
Представляем   Quantum Heiken Ashi PRO Свечи Heiken Ashi, разработанные для обеспечения четкого понимания рыночных тенденций, известны своей способностью отфильтровывать шум и устранять ложные сигналы. Попрощайтесь со сбивающими с толку колебаниями цен и познакомьтесь с более плавным и надежным представлением графиков. Что делает Quantum Heiken Ashi PRO действительно уникальным, так это его инновационная формула, которая преобразует данные традиционных свечей в легко читаемые цветные столбцы. Кр
77% discount for the next 10 buyers (original price $605): 1 left 3 Indicators in 1 indicator Strategy based on price action Made specifically for the best forex currency pairs Can be used in the best time frame of the market at a very reasonable price This indicator is basically 3 different indicatos . But we have combined these 3 indicators in 1 indicator so that you can use 3 indicators at the lowest price. All three strategies are based on price action. But based on different trends.
Matrix Arrow Indicator MT5
Juvenille Emperor Limited
5 (14)
Индикатор Matrix Arrow MT5   — это уникальный индикатор тренда 10 в 1, следующий за   100% неперерисовывающимся   индикатором с несколькими таймфреймами, который можно использовать на всех символах/инструментах:   форекс ,  товары ,   криптовалюты ,   индексы ,  акции . Индикатор Matrix Arrow MT5  будет определять текущую тенденцию на ранних этапах, собирая информацию и данные от до 10 стандартных индикаторов, а именно: Индекс среднего направленного движения (ADX) Индекс товарного канала (CCI)
Introducing the South African Sniper indicator created by a small group of traders with a few years trading trading the financial market profitably . This is a plug and play indicator that provides you with  BUY and SELL (SNIPER ENTRY) signals with TARGET and trail stops. The indicator Works with all MT5 trading instruments. The indicator uses previous  chart data as receipt to speculate on future market moves.
Индикатор Trend Line Map является дополнением к индикатору Trend Screener Indicator. Он работает как сканер всех сигналов, генерируемых скринером тренда (сигналы линии тренда). Это сканер линий тренда на основе индикатора Trend Screener. Если у вас нет индикатора Trend Screener Pro, программа Trend Line Map Pro работать не будет. It's a Trend Line Scanner based on Trend Screener Indicator. If you don't have Trend Screener Pro Indicator,     the Trend Line Map Pro will not work . Зайдя в н
40% СКИДКА НА РОЖДЕСТВО! ПОВЫШЕНИЕ ЦЕНЫ ДО $250 С 1 ЯНВАРЯ! Представляем GoldenGate Entries: Революционное Торговое Решение! Откройте для себя революционный подход к торговле с GoldenGate Entries (GGE), передовым индикатором, разработанным для повышения вашего опыта торговли. GGE предоставляет обширный набор функций, чтобы предоставить пользователям точность и уверенность в их торговых решениях. Пары: Любые (валюты - товары - акции - акции - криптовалюты) Таймфреймы: 15 минут до H1 Ос
WHY IS OUR FXACCCURATE LS MT5 THE PROFITABLE ? PROTECT YOUR CAPITAL WITH RISK MANAGEMENT Gives entry, stop and target levels from time to time. It finds Trading opportunities by analyzing what the price is doing during established trends. POWERFUL INDICATOR FOR A RELIABLE STRATEGIES We have made these indicators with a lot of years of hard work. It is made at a very advanced level. Established trends provide dozens of trading opportunities, but most trend indicators completely ignore them!
Индикатор разворота ADR сразу показывает, где в настоящее время торгуется цена относительно своего нормального среднего дневного диапазона. Вы будете получать мгновенные оповещения через всплывающие окна, электронную почту или push-уведомления, когда цена превышает свой средний диапазон и уровни выше него по вашему выбору, чтобы вы могли быстро переходить к откатам и разворотам. Индикатор рисует на графике горизонтальные линии на экстремумах среднего дневного диапазона, а также расширения выше
Станьте Breaker Trader и получайте прибыль от изменений структуры рынка по мере изменения цены. Индикатор выключателя блока ордеров определяет, когда тренд или движение цены приближаются к истощению и готовы развернуться. Он предупреждает вас об изменениях в структуре рынка, которые обычно происходят, когда произойдет разворот или серьезный откат. Индикатор использует собственный расчет, который определяет прорывы и ценовой импульс. Каждый раз, когда новый максимум формируется около возможн
The Volume by Price Indicator for MetaTrader 5 features Volume Profile and Market Profile TPO (Time Price Opportunity). Get valuable insights out of currencies, equities and commodities data. Gain an edge trading financial markets. Volume and TPO histogram bar and line charts. Volume Footprint charts. TPO letter and block marker charts including split structures. Versatile segmentation and compositing methods. Static, dynamic and flexible ranges with relative and/or absolute visualizations. Lay
Другие продукты этого автора
MACD (short for Moving Average Convergence/Divergence) is one of the most famous and oldest indicators ever created and is widely used among   beginners . However, there is a newer version of the MACD that is named   Impulse MACD   which have less false signals than the standard MACD. Classic MACD helps us to identify potential   trends   by displaying   crossovers   between two lines. If MACD line crosses above the Signal line it shows us that the market is potentially   up   trending and that
MACD (short for Moving Average Convergence/Divergence) is one of the most famous and oldest indicators ever created and is widely used among beginners . However, there is a newer version of the MACD that is named Impulse MACD  which have less false signals than the standard MACD. Classic MACD helps us to identify potential trends by displaying crossovers between two lines. If MACD line crosses above the Signal line it shows us that the market is potentially up trending and that it would be a go
MP Candle Countdown indicator with a progress bar is a tool used in technical analysis that displays the time remaining until the current candlestick on a chart closes, along with a progress bar that shows visually the amount of time that has elapsed since the candlestick opened. This indicator can be helpful for traders who use candlestick charting to make trading decisions, as it provides both a visual representation of the time left until a candlestick closes and an indication of how much ti
FREE
This indicator is stand alone version from  MP Pivot Levels  (All in one) containing Woodie Pivots. Woodie’s pivot points are made up of multiple key levels, calculated from past price points, in order to frame trades in a simplistic manner. The key levels include the ‘pivot’ itself, and multiple support and resistance levels (usually up to three each). Traders use these levels as a guide for future price movements when setting up trades. The pivot : (Previous high + previous low + 2 x previou
FREE
MP Squeeze Momentum is a volatility and momentum indicator derivated of "TTM Squeeze" volatility indicator introduced by John Carter. It capitalizes on the tendency for price to break out strongly after consolidating in a tight range. Introduction: The volatility component of MP Squeeze Momentum measures price compression using Bollinger Bands and Keltner Channels. If the Bollinger Bands are completely enclosed within the Keltner Channels, that indicates a period of very low volatility. This st
FREE
An “inside bar” pattern is a two-bar price action trading strategy in which the inside bar is smaller and within the high to low range of the prior bar, i.e. the high is lower than the previous bar’s high, and the low is higher than the previous bar’s low. Its relative position can be at the top, the middle or the bottom of the prior bar. The prior bar, the bar before the inside bar, is often referred to as the “mother bar”. You will sometimes see an inside bar referred to as an “ib” and its
FREE
A heatmap is a graphical representation of data in two dimensions, using colors to display different factors. Heatmaps are a helpful visual aid for viewers, enabling the quick dissemination of statistical or data-driven information. The MP Heatmap indicator provides a graphical representation of the relative strengths of major currencies compared to others, organizing data from pairs into color-coded results and producing a clear overview of the entire Forex market. The MP Heatmap indicator dis
FREE
This trend scanner indicator is using two main indicators to identify trends. Frist the EMAs to provide a view on Bullish / Bearish momentum. When the shorter EMA (calculated off more recent price action) crosses, or is above, the slower moving EMA (calculated off a longer period of price action), it suggests that the market is in an uptrend. Second the Stochastic RSI, When RSI is < 20 it is considered oversold, and when > 80 it is overbought. These conditions suggests that momentum is very str
FREE
The purpose of using Smart money index (SMI) or smart money flow index is to find out investors sentiment. The index was constructed by Don Hays and measures the market action. The indicator is based on intra-day price patterns. The beginning of the trading day is supposed to represent the trading by retail traders. The majority of retail traders overreact at the beginning of the trading day because of the overnight news and economic data. There is also a lot of buying on market orders and shor
FREE
A pin bar pattern consists of one price bar, typically a candlestick price bar, which represents a sharp reversal and rejection of price. The pin bar reversal as it is sometimes called, is defined by a long tail, the tail is also referred to as a “shadow” or “wick”. The area between the open and close of the pin bar is called its “real body”, and pin bars generally have small real bodies in comparison to their long tails. The tail of the pin bar shows the area of price that was rejected, and
FREE
This indicator is stand alone version from  MP Pivot Levels  (All in one) containing Demark's Pivots. Calculations:     PP = X / 4     R1 = X / 2 - LOWprev     S1 = X / 2 - HIGHprev Uses: When the pair currency price may change the direction of movement. Possible constraints of support and resistance that creates plateaus for the currency pair prices. Tendency identification by comparing the present prices according to current day's pivot point and also the prior day's pivot points. ___________
FREE
The MP Andean Oscillator is used to estimate the direction and also the degree of variations of trends. It contains 3 components: Bull component, Bear component and Signal component. A rising Bull component indicates that the market is up-trending while a rising Bear component indicates the presence of down-trending market. Settings: Oscillator period: Specifies the importance of the trends degree of variations measured by the indicator. Signal line per: Moving average period of the Signal line
FREE
This indicator is stand alone version from  MP Pivot Levels  (All in one) containing Demark's Pivots. Calculations:     PP = X / 4     R1 = X / 2 - LOWprev     S1 = X / 2 - HIGHprev Uses: When the pair currency price may change the direction of movement. Possible constraints of support and resistance that creates plateaus for the currency pair prices. Tendency identification by comparing the present prices according to current day's pivot point and also the prior day's pivot points. ___________
FREE
MP Inside Bar
Pierre Ksachikian
5 (2)
An “inside bar” pattern is a two-bar price action trading strategy in which the inside bar is smaller and within the high to low range of the prior bar, i.e. the high is lower than the previous bar’s high, and the low is higher than the previous bar’s low. Its relative position can be at the top, the middle or the bottom of the prior bar. The prior bar, the bar before the inside bar, is often referred to as the “mother bar”. You will sometimes see an inside bar referred to as an “ib” and its
FREE
This indicator contains Pivot Levels of: Traditional Fibonacci Woodie Classic Demark Camarilla  Calculation periods can be set to auto / Daily / Weekly / Monthly / Yearly.  Number of Levels are editable.  Options to hide level labels and price labels.  Pivots Points are price levels chartists can use to determine intraday support and resistance levels. Pivot Points use the previous days Open, High, and Low to calculate a Pivot Point for the current day. Using this Pivot Point as the base, three
MP Price Change Indicator is a tool to calculate the price movement by percentage. The Value of this indicator can be adjusted to look back of the percent of price change within certain timeframes. This is a powerful tool when used by other indicators as well, such as ATR and ADR, for understanding price fluctuations and tolerance in different strategies. ___________________________________________________________________________________ Disclaimer: Do NOT trade or invest based upon the analys
FREE
This indicator is stand alone version from  MP Pivot Levels  (All in one) containing Woodie Pivots. Woodie’s pivot points are made up of multiple key levels, calculated from past price points, in order to frame trades in a simplistic manner. The key levels include the ‘pivot’ itself, and multiple support and resistance levels (usually up to three each). Traders use these levels as a guide for future price movements when setting up trades. The pivot : (Previous high + previous low + 2 x previou
FREE
Candle size oscillator is an easy to use tool to figure out candle size from highest to lowest price of each candle. It's a powerful tool for price action analysts specifically for those who works intraday charts and also a perfect tool for short term swing traders. Kindly note that you can also edit the Bullish and Bearish candles with different colors. #Tags: Candle size, oscillator, price action, price range, high to low, candle ticks _________________________________________________________
FREE
A pin bar pattern consists of one price bar, typically a candlestick price bar, which represents a sharp reversal and rejection of price. The pin bar reversal as it is sometimes called, is defined by a long tail, the tail is also referred to as a “shadow” or “wick”. The area between the open and close of the pin bar is called its “real body”, and pin bars generally have small real bodies in comparison to their long tails. The tail of the pin bar shows the area of price that was rejected, and
FREE
Candle size oscillator is an easy to use tool to figure out candle size from highest to lowest price of each candle. It's a powerful tool for price action analysts specifically for those who works intraday charts and also a perfect tool for short term swing traders. Kindly note that you can also edit the Bullish and Bearish candles with different colors. #Tags: Candle size, oscillator, price action, price range, high to low, candle ticks _________________________________________________________
FREE
This creative simple indicator will provide a precise framework for market sentiment within technical analysis of different timeframes. For instance, for traders like me that uses   "Mark Fisher"   strategy regularly, this is a perfect indicator for having an insight to markets from short term to long term point of view, using Break points of candles' lows and highs and perfect to combine with   "Price Action" . For more options and modifications you can also edit the low timeframe candles withi
FREE
This utility identifies certain candle open times on chart, this can help you to see your favorite candle open and use it as it fits in your strategy. This tool is very useful for intraday charting and indicating your sessions. ___________________________________________________________________________________ Disclaimer: Do NOT trade or invest based upon the analysis presented on this channel. Always do your own research and due diligence before investing or trading. I’ll never tell you what
FREE
The MP Andean Oscillator is used to estimate the direction and also the degree of variations of trends. It contains 3 components: Bull component, Bear component and Signal component. A rising Bull component indicates that the market is up-trending while a rising Bear component indicates the presence of down-trending market. Settings: Oscillator period: Specifies the importance of the trends degree of variations measured by the indicator. Signal line per: Moving average period of the Signal line
FREE
MP Relative Bandwidth Filter (RBF) is created to be used to identify your trading zones based on volatility. This easy to use technical indicator attempts to compare between Bandwidth of higher length and ATR of lower length to identify the areas of low and high volatility: Relative Bandwidth = Bandwidth / ATR The Bandwidth is based on Bollinger Band which its length ideally needs to be higher and ATR length needs to be ideally lower. After calculating Relative Bandwidth, the Bollinger Band is
FREE
MP Gradient Adaptive RSI oscillator uses AMA with the basic RSI to cover the retracements with minimum lag. Trigger line crossing the oscillator will provide an entry point for trader. Settings: RSI period: period of the oscillator Sensitivity of the oscillator: controls the sensitivity of the oscillator to retracements, with higher values minimizing the sensitivity to retracements. RSI applied price: source input of the indicator Number of bars to draw: is used when the Fill Type option is n
FREE
MP Price Change Indicator is a tool to calculate the price movement by percentage. The Value of this indicator can be adjusted to look back of the percent of price change within certain timeframes. This is a powerful tool when used by other indicators as well, such as ATR and ADR, for understanding price fluctuations and tolerance in different strategies. ___________________________________________________________________________________ Disclaimer: Do NOT trade or invest based upon the analys
FREE
This indicator helps to identify market sessions, It's High/Low, Open Range (OR), range of the sessions in pips and percentage of previous day (change%) under OHLC. It is also editable for any brokerage market watch time. For traders who use session trading strategies such as Mark B. Fisher ACD it can be super effective, where they can edit OR from the settings to either line or box.  We tried to make the settings easier to edit, for traders' use on different markets, charts and brokerage time.
This indicator contains Pivot Levels of: Traditional Fibonacci Woodie Classic Demark Camarilla Calculation periods can be set to auto / Daily / Weekly / Monthly / Yearly. Number of Levels are editable. Options to hide level labels and price labels. Pivots Points are price levels chartists can use to determine intraday support and resistance levels. Pivot Points use the previous days Open, High, and Low to calculate a Pivot Point for the current day. Using this Pivot Point as the base, three resi
Фильтр:
Detleff Böhmer
2572
Detleff Böhmer 2023.07.13 08:22 
 

Пользователь не оставил комментарий к оценке

Pierre Ksachikian
16448
Ответ разработчика Pierre Ksachikian 2023.07.13 13:41
Great to know. Thank you for your review.
tenomi
34
tenomi 2023.06.20 19:33 
 

i bought the indicator and can not get it attached to my chart? can you advise please? thanks

it shows up in the Navigator yes, downloaded Version 1.1

When i click attach nothing happens. no error just not coming up on my chart?

Pierre Ksachikian
16448
Ответ разработчика Pierre Ksachikian 2023.06.20 19:59
Hello there, Please check if your MT5 has the latest update and also check if the indicator file is correctly placed in the indicator folders and is showing on the navigator panel. Let me know if it persists. Thanks
Denis Sokolovsky
421
Denis Sokolovsky 2023.06.06 14:23 
 

Пользователь не оставил комментарий к оценке

Pierre Ksachikian
16448
Ответ разработчика Pierre Ksachikian 2023.06.06 14:26
Thank you very much for your comment!
Abdelsalam Gebrel Abdelsalam Ahmed
221
 

Пользователь не оставил комментарий к оценке

Pierre Ksachikian
16448
Ответ разработчика Pierre Ksachikian 2023.04.30 07:55
Thank you for your review.
Seleucus
93
Seleucus 2023.03.14 10:22 
 

Пользователь не оставил комментарий к оценке

Pierre Ksachikian
16448
Ответ разработчика Pierre Ksachikian 2023.03.14 15:28
That's great to know, Thank you for your feedback.
LuisSouto
54
LuisSouto 2023.03.13 12:22 
 

Пользователь не оставил комментарий к оценке

Pierre Ksachikian
16448
Ответ разработчика Pierre Ksachikian 2023.03.13 18:47
Thank you very much for your comment!
The issue has been resolved, kindly update the indicator and check.
Ответ на отзыв
Версия 1.10 2023.03.13
Changing line width is available now