• Обзор
  • Отзывы (1)
  • Обсуждение

QQE Advanced MT5

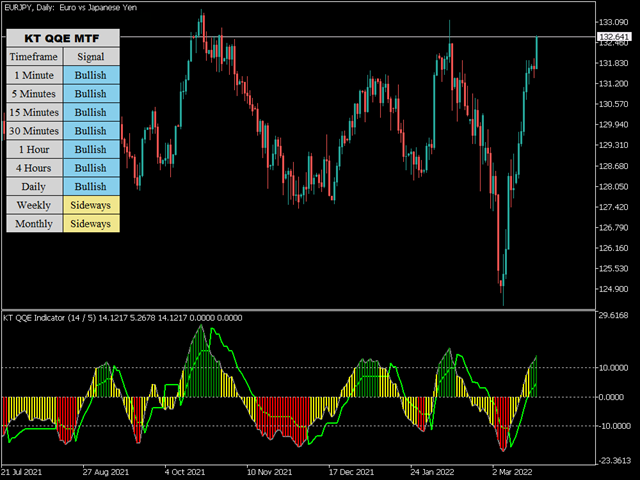
The KT QQE Advanced is a modified version of the classic QQE oscillator to depict it more accurately using the colored histogram with fast and slow Trailing Line(TL).

Unlike the classic QQE, the KT QQE Advanced consists of a histogram with overbought/oversold levels.

Applications

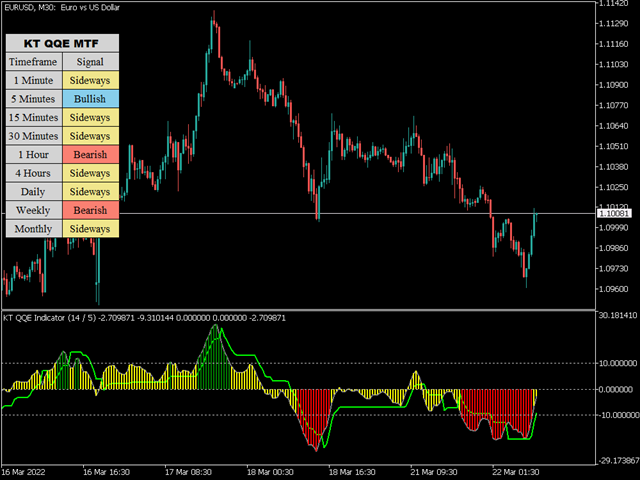
  • Find quick buy/sell signals across all the timeframes using the MTF scanner.
  • Find the trend direction more accurately.
  • Detects overbought/oversold market.
  • Shows the price momentum.
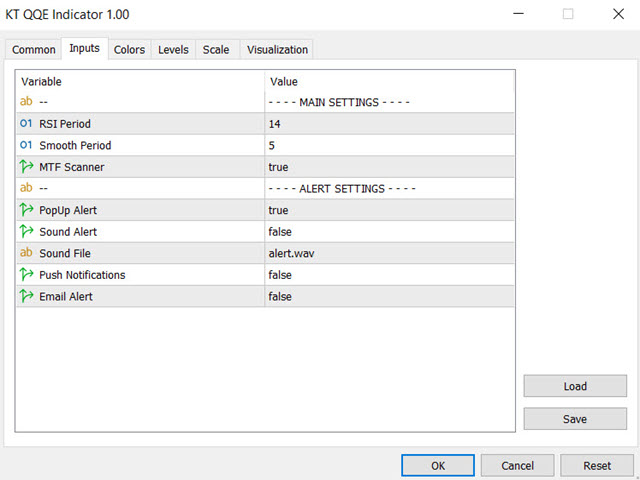
Inputs

  • RSI Period
  • Smooth Period
  • MTF Scanner
  • Alert Settings

What Exactly is QQE?

QQE stands for Quantitative Qualitative Estimation. The QQE oscillator was derived using the super-smoothed RSI combined with the ATR.

Instead of using the classic RSI, the QQE oscillator uses Wilder's RSI, derived from a different form of the exponential moving average for the smoothing.

Wilder's smoothing = Previous MA value + (1/n periods * (Close - Previous MA))

Рекомендуем также
The patterns of 3 (three) Candles: Three White Soldiers; Three Black Crows; These are reversal patterns widely used by traders, as they have a high probability of showing the inversion of the current market movement. For example, if in a bullish trend there are three black crows, there is a high probability of reversing the current bullish movement. The Three White Soldiers have the following characteristics: There are 3 consecutive candles with a good body, that is, the difference between
Révolutionnez votre trading avec PowerPro Volatility : une précision automatisée à votre service Êtes-vous prêt à transformer votre approche du trading d’indices synthétiques ? Présentation de PowerPro Volatility, la solution ultime pour ceux qui cherchent à maximiser leurs gains tout en minimisant les efforts. Grâce à   Automatisation avancée et technologie de pointe, ce robot de trading est conçu pour offrir des performances exceptionnelles sans aucune intervention humaine. Découvrez les avan
HIGH and LOW OTT
Mohammad Taher Halimi Tabrizi
This product is converted form Trading View of Kivanc Ozbilgic to be used on MT5 and below are descriptions of developer on Trading View: Anıl Özekşi's latest development on his precious OTT - Optimized Trend Tracker: In this version, there are two lines of OTT which are derived from HIGHEST price values (HOTT) and LOVEST price values (LOTT) which were originally sourced to CLOSE values on default OTT. Another significant difference is there is no Support Line (Moving Average) in this ver
This indicator works on atr with some edited . The AI ​​MACD FILTER indicator is used for confirmation. Certainly, the indicator contains an alert when the signal appears, and you use the exit of the deal on the saturation that occurs at the AI ​​MACD. The accuracy of the work is high on gold, the time frame is five minutes, while staying away from trading at the time of news that occurs on the US dollar. And using high liquidity trading times, which are two hours before the opening of the Lo
It's a multi-symbol and multi-timeframe scanner for our indicator - ACB Breakout Arrows . With default settings, it scans for the buy/sell signals on 28 currency pairs and 9 time-frames concurrently.   Features It can scan 252* combinations of symbols and time-frames from a single chart. Open the signal's chart loaded with a predefined template with a single click.  Easy drag n drop anywhere on the chart. Real-time alerts with popup, sound, push-notifications and email alerts.  Input Para
Welcome to advanced trading with the ADX Multicurrency Scanner for MT5! Elevate your trading experience with our powerful MT5 indicator, meticulously designed to offer seamless currency scanning and real-time insights. Key Features: Effortless Multicurrency Scanning: Unlock the full potential of the ADX Multicurrency Scanner for MT5 by effortlessly scanning multiple currencies. Receive instant alerts when specific conditions are met, ensuring you stay ahead of the market and capitalize on every
Daily VWAP, continues for a period of hours (eg, 10 hours of history), with color to indicate change of direction and bands to map good entry and exit points. The indicator was created to map the center of the market, and find good buying moments, trend analysis or market correction points are easily detected, allowing you to understand moments of exhaustion and buying and selling points Copyright (c) <year> <copyright holders> Permission is hereby granted, free of charge, to any person obtain
Liquidity Pro The Liquidity Pro pin points liquidity zones in any financial instrument, including currency pairs, cryptocurrencies, commodities, equities and indices. The Liquidity Pro shows previous and current liquidity zones, down to the present minute, providing essential information about your chosen trading pair, when conducting chart analysis or initiating trades. The Liquidity Pro allows you to observe where price consolidates, retraces, resists, or settles within support areas. It pinp
KT Fractal Channel Breakout draws a continuous channel by connecting the successive Up and Down fractals. It provides alerts and also plots the Up and Down arrows representing the bullish and bearish breakout of the fractal channel. Features If you use Bill Williams fractals in your technical analysis, you must also include it in your trading arsenal. It can be very effective and useful for stop-loss trailing. A new market trend often emerges after a fractal channel breakout in a new directi
Santo Oscilator
Gustavo Goncalves
5 (1)
Oscilador bem próximo que o indicador SANTO mostrado pelo Bo Williams em sua metodologia PhiCube, para mim este indicador ainda é melhor que o próprio SANTO original. Ótimo para entender a força e tendência de movimentos e possíveis divergências. Preço fazendo topo e o SANTO não renovando máxima, tudo indica que teremos uma reversão ou no mínimo um drawback.
The Returns Momentum Oscillator (RMO) shows the difference of exponentially weighted volatility. It is used to find market tops and bottoms. Volatility comes in waves, and as the Returns often front run price action it gives directional prediction of market movement.   The Oscillator signal is RMSed (root mean squared) to make the distribution closer to Gaussian distribution. While the traditional RSI indicators are often stuck in overbought or oversold areas for a long time, RMSing of the sign
- This is an implementation of OCC ==> open close cross - This indicator applies twelve different averaging methods to open and close prices separately to signal the trend switching. - All MA methods are set as input as well as period and different offsets applied to linear regression and ALMA averaging. - Buffers 16 and 17 can be used in EAs to detect trend direction. - You can message in private chat for further changes you need.
My PVSR
Ashok Kumar Singha
My PVSR   is based on All Type of Pivot Points. Use this Indicator to get proper Support / Resistance Zone and Trade accordingly.. Recommendation: Use this Indicator along with my another Indicator --->>> Dr. Trend   <<<--- Click Here ; To get the best output result feel free to contact me ; Best of Luck It can be used for: All Pairs: Forex, Cryptocurrencies, Metals, Stocks, Indices etc. All Timeframe All Brokers All type of Trading Style like Scalping, Swing, Intraday, Short-Term, Lon
KT Asian Breakout indicator scans and analyzes a critical part of the Asian session to generate bi-directional buy and sell signals with the direction of a price breakout. A buy signal occurs when the price breaks above the session high, and a sell signal occurs when the price breaks below the session low. MT4 Version is available here  https://www.mql5.com/en/market/product/41656 Things to remember If the session box is vertically too wide, a new trade should be avoided as most of the price
Индикатор Markets Heat может помочь вам определить правильный курс действий в текущей рыночной ситуации, рассчитав «уровень тепла» на рынке. Что такое «уровень тепла» на рынке? Ну, это мой собственный способ упрощения сложных рыночных условий для облегчения процесса принятия решений. Как это работает? Большую часть времени рынок движется в узком диапазоне и не может «решить» куда идти -> плоский рынок -> холодный рынок. В других случаях цена идет вверх или вниз -> делает трендовые движения -> на
Mean Reversal Heikin Ashi Indicator calculates special trade reversal points based on Heikin Ashi candlesticks patterns. This indicator can be used on all symbols, even in Forex or B3 Brazillian Markets. You can configure just the position of each arrow. Then, after include the indicator on the graphic, pay attention on each arrow that indicates a long or short trade.
Grid + Square BBAnd is the new Grid Trading with new formula of traditional Bollinger Band. It is Square Bollinger Band. It is complex and unique formular that more accurate than the (round)Bollinger Band. It is build-in with multi-function of Risk&Reward Control such as: First Trade: Off/On first trade Series Trade: Off/On sequences trade Signal Count: This is the core value of calculate Square BBand based on overlap interval Timeframe: Period of Square BBand Trade Strategy: 1. Series_Both_Tr
The indicator determines a special pattern of Joe Dinapoli. It gives very high probability buy and sell signals. Indicator does not repaint. Indicator Usage Buy Signal ''B'' Entry : Market buy order at signal bar close Stop : Low of signal bar Take Profit : First swing high Sell Signal ''S'' Entry : Market sell order at signal bar close Stop : High of signal bar Take Profit : First swing low Indicator Parameters Fast EMA : External Parameter (should be kept as default) Slow EMA: External Param
Simple EA with 1 SMA and Fibonacci. The Expertadvisor opens positions in the direction of the trend when price levels have exceeded or fallen below the Fibonacci levels. It depends on the market in question and which parameters to use. The EA is programmed in such a way that optimization runs consume little time. A news filter and filter by day of the week are built in.
KT Triple Top-Bottom identifies the triple top/bottom pattern with a breakout signal in the opposite direction. It is used to identify potential trend reversals. A Triple Top pattern is formed when the price reaches a high point three times, while a Triple Bottom pattern occurs when the price comes to a low point three times. Features The indicator detects the triple top/bottom pattern with high precision and accuracy. The indicator suggests a shift in momentum, with sellers or buyers takin
Tree Of Life is a fully automated trading robot designed to generate stable long-term gains while providing excellent risk management. After years of trading and testing, we have discovered spesific combinations of indicators and internal calculations that secure a solid foundation for a robust strategy. The main indicators Tree Of Life uses are the Moving Average and Stochastic. Together with internal calculations, our combinations have proven to be a solid recipe.   The Money Management m
Trade Extractor MT5
Philip Pankaj Suthagar
2 (1)
TRADE EXTRACTOR   is the fastest self-learning AI Algorithm, which will learn any market situation with ease.As a Manual trader, I came across the difficulty of finding the right parameter and the right condition to trade. There are infinite combinations of indicators and objects(trendlines, gann grid, fibo levels etc) which as an human, I can’t decide their winning rate or performance. Many claim to have a winning strategy but won’t have enough statistical support to prove their claims. Due to
Информационная панель ADR Alert показывает вам, где в настоящее время торгуется цена по отношению к ее нормальному среднему дневному диапазону. Вы будете получать мгновенные оповещения через всплывающие окна, электронную почту или push-уведомления, когда цена превышает свой средний диапазон и уровни выше него по вашему выбору, чтобы вы могли быстро переходить к откатам и разворотам. Черта предназначена для размещения на пустом графике и просто находится в фоновом режиме и предупреждает вас о до
Novato
Juan Manuel Rojas Perez
5 (1)
Descubre el poderoso aliado que te guiará en el laberinto de los mercados financieros. Este indicador revolucionario te llevará de la incertidumbre a la claridad, permitiéndote identificar con precisión los puntos de inflexión del mercado. Mejora tus decisiones de entrada y salida, optimiza tus operaciones y ¡multiplica tus ganancias con confianza. ¡Para más información, te invitamos a unirte a nuestro canal de Telegram en https://t.me/Profit_Evolution  ¡Allí encontrarás contenido exclusivo, a
FREE
Novato alertas
Juan Manuel Rojas Perez
5 (2)
Descubre el poderoso aliado que te guiará en el laberinto de los mercados financieros. Este indicador revolucionario te llevará de la incertidumbre a la claridad, permitiéndote identificar con precisión los puntos de inflexión del mercado. Mejora tus decisiones de entrada y salida, optimiza tus operaciones y ¡multiplica tus ganancias con confianza. Ahora con alertas en tu pc o móvil ¡Para más información, te invitamos a unirte a nuestro canal de Telegram en   https://t.me/Profit_Evolution  ¡
FREE
Использовать индикатор Fibrillar очень просто, поскольку самый простой - это посмотреть на график и действовать согласно показаниям цветных стрелок. Алгоритм учитывает измерение цен, также данном методе  делается упор на измерение каждого из перепадов цены (H/C, H/O,LC,LO) - что дает более детализированную информацию но так же и более усредненную. При рассчете данного индикатора сперва рассчитываются логорифмические приросты по цене закрытия, что позволяет отфильтровать тренд, сезонность и пр
Relative Strength Ratio RSR
Eduardo Fernando Teixeira
5 (1)
Relative Strength Ratio (RSR) The Relative Strength Ratio (RSR) indicator compares the performance of one security against another, dividing the base security by the comparative security, and showing the ratio of this division in a line c hart. This indicator is also known as the Relative Strength indicator, Price Relative , or Relative Strength Comparative .  It is one of the main tools for Intermarket Analysis professionals, to help them identify Sector Rotations and other global relations
--- StudentK RVI --- 1. Advanced strategy based on RVI 2. EA adapted (especially for StudentK's EA) --- Context --- StudentK is not indicated as a master or K Sir for knowledgeable person who claims for winning all the time. (But lots of traders should know the fact that it is rarely truth, especially in fluctuated period of time) StudentK is a group of years-experienced traders who want to share amazing tools in Free and Paid versions. Aiming helping people getting out of "The Rat Race" by
BB Squeeze MT5
KEENBASE SOFTWARE SOLUTIONS
KT BB Squeeze measures the contraction and expansion of market volatility with a momentum oscillator, which can be used to decide a trading direction. It measures the squeeze in volatility by deducing the relationship between the Bollinger Bands and Keltner channels. Buy Trade: A white dot after the series of gray dots + Rising momentum above the zero line. Sell Trade: A white dot after the series of gray dots + Rising momentum below the zero line.  Markets tend to move from a period of low vol
BS Time Band是一个很好的波段交易指示器,这个指标可以单独使用,但是最好是配合 StartPoint 一起使用效果更好,适用于任何时间框架,非常适合喜欢做波段交易的朋友。它能很好的体现出一个波段的完整信息,你可以很快的从这个指示器上寻找到最佳的预警区域,然后配合 StartPoint 找到最佳的buy位置和最佳的sell位置,也能很好根据指示器去坚守自己的持仓定订单。指标不含有未来函数,不会重新绘制,不仅能够应用到自己的手动交易过程中,还能完全可以写入到自己的EA中。(如果你感觉到这个指标能够帮助你进行更准确的交易,请帮忙给个好评,希望我的作品能够帮助更多有需要的人) =================参考使用方法=================== 此指标可以适用于任何交易品种。 做波段建议参数 timeFame:M5 如果配合 StartPoint 建议 StartPoint 的参数为(240,60)
С этим продуктом покупают
Прежде всего стоит подчеркнуть, что этот торговый индикатор не перерисовывается, не перерисовывает и не отставает, что делает его идеальным как для ручной, так и для роботизированной торговли. Руководство пользователя: настройки, вводы и стратегия. Атомный аналитик - это индикатор ценового действия PA, который использует силу и импульс цены, чтобы найти лучший край на рынке. Оборудованный расширенными фильтрами, которые помогают убирать шумы и ложные сигналы, и повышают торговый потенциал. Испо
Прежде всего стоит подчеркнуть, что эта торговая система является индикатором без перерисовки, без повторной отрисовки и без задержки, что делает ее идеальной как для ручной, так и для роботизированной торговли. Онлайн курс, руководство и загрузка пресетов. «Smart Trend Trading System MT5» - это комплексное торговое решение, созданное для новичков и опытных трейдеров. Он объединяет более 10 премиальных индикаторов и предлагает более 7 надежных торговых стратегий, что делает его универсальным
Gold Stuff mt5
Vasiliy Strukov
4.89 (175)
Gold Stuff mt5 - трендовый индикатор, разработанный специально для золота, также может использоваться на любых финансовых инструментах. Индикатор не перерисовывается и не запаздывает. Рекомендуемый тайм-фрейм H1.  Свяжитесь со мной сразу после покупки для получения   персонального бонуса! Настройки и мануал  здесь ПАРАМЕТРЫ Draw Arrow -   вкл.выкл. отрисовку стрелок на графике. Alerts -   вкл.выкл.звуковые оповещения. E-mail notification -   вкл.выкл. уведомления на почту. Puch-notification -
FX Volume MT5
Daniel Stein
4.94 (17)
Получайте ежедневную информацию о рынке с подробностями и скриншотами в нашем утреннем брифинге здесь, на mql5 , и в Telegram ! FX Volume - это ПЕРВЫЙ и ЕДИНСТВЕННЫЙ индикатор объема, который дает РЕАЛЬНОЕ представление о настроении рынка с точки зрения брокера. Он дает потрясающее представление о том, как институциональные участники рынка, такие как брокеры, позиционируют себя на рынке Forex, гораздо быстрее, чем отчеты COT. Видеть эту информацию прямо на своем графике - это настоящий геймчей
Reversal First Impulse levels (RFI)          INSTRUCTIONS     RUS      -      ENG           Рекомендуем использовать с  индикатором -  TREND PRO -  Version MT4             Важным ключевым элементом в трейдинге являются зоны или уровни, от которых принимаются решения о покупке или продаже торгового инструмента. Несмотря на попытки крупных игроков скрыть свое присутствие на рынке, они неизбежно оставляют следы. Наша задача заключалась в том, чтобы научиться находить эти следы и правильно их интер
Раскройте силу торговли трендами с помощью индикатора Trend Screener: вашего идеального решения для торговли трендами, основанного на нечеткой логике и мультивалютной системе! Повысьте уровень своей торговли по тренду с помощью Trend Screener, революционного индикатора тренда, основанного на нечеткой логике. Это мощный индикатор отслеживания тренда, который сочетает в себе более 13 инструментов и функций премиум-класса и 3 торговые стратегии, что делает его универсальным выбором для превращения
TPSpro TRENDPRO   —  трендовый индикатор, который автоматически анализирует рынок и предоставляет информацию о тренде и каждой его смене а также дающий сигналы для входа в сделки без перерисовки! Индикатор использует каждую свечу, анализируя их отдельно. относя к разным импульсам – импульс вверх или вниз. Точные точки входа в сделки  для  валют, крипты, металлов, акций, индексов! -  Version MT4                ПОЛНОЕ ОПИСАНИЕ ИНДИКАТОРА          Рекомендуем использовать с  индикатором -  RFI LE
Представляем       Индикатор Quantum Trend Sniper   , инновационный индикатор MQL5, который меняет способ определения разворотов тренда и торговли ими! Разработан командой опытных трейдеров со стажем торговли более 13 лет,       Снайперский индикатор Quantum Trend       разработан, чтобы вывести ваше торговое путешествие на новые высоты благодаря инновационному способу определения разворотов тренда с чрезвычайно высокой точностью. ***Купите индикатор Quantum Trend Sniper и получите индикатор
Прежде всего стоит подчеркнуть, что этот Торговый Инструмент является Неперерисовывающимся Нерепейнтинговым Индикатором, что делает его идеальным для профессиональной торговли. Онлайн-курс, руководство пользователя и демонстрация. Индикатор Концепций Умного Действия Цены - очень мощный инструмент как для новичков, так и для опытных трейдеров. Он объединяет более 20 полезных индикаторов в одном, комбинируя передовые торговые идеи, такие как анализ Inner Circle Trader и стратегии торговли конц
Сейчас 147 долл. США (увеличиваясь до 499 долл. США после нескольких обновлений) - неограниченные учетные записи (ПК или Mac) Руководство пользователя + Обучающие видео + Доступ к приватному Discord-каналу + VIP-статус и мобильная версия + Лицензия на 5 ПК с неограниченным количеством аккаунтов и терминалов MT4. Сколько раз вы покупали индикатор торговли с замечательными обратными тестами, доказательствами производительности на живых счетах и зашикарными цифрами и статистикой, но после испо
ICT, SMC, SMART MONEY CONCEPTS, SMART MONEY, Smart Money Concept, Support and Resistance, Trend Analysis, Price Action, Market Structure, Order Blocks, BOS/CHoCH,   Breaker Blocks ,  Momentum Shift,   Supply&Demand Zone/Order Blocks , Strong Imbalance,   HH/LL/HL/LH,    Fair Value Gap, FVG,  Premium  &   Discount   Zones, Fibonacci Retracement, OTE, Buy Side Liquidity, Sell Side Liquidity, BSL/SSL Taken, Equal Highs & Lows, MTF Dashboard, Multiple Time Frame, BigBar, HTF OB, HTF Market Structure
AW Trend Predictor MT5
AW Trading Software Limited
4.78 (58)
Сочетание тренда и пробоя уровней в одной системе. Продвинутый алгоритм индикатора фильтрует рыночный шум, определяет тренд, точки входа, а также возможные уровни выхода из позиции. Сигналы индикатора записываются в статистический модуль, который позволяет выбирать наиболее подходящие инструменты, показывая эффективность истории сигналов. Индикатор рассчитывает отметки ТейкПрофитов и стоплосса. Руководство пользователя ->  ЗДЕСЬ  / MT4 версия ->  ЗДЕСЬ Как торговать с индикатором: Торговля с Tr
Step into the realm of Forex trading with confidence and precision using XQ, a cutting-edge Forex indicator designed to elevate your trading game to unprecedented heights. Whether you're a seasoned trader or just stepping into the world of currency exchange, XQ Forex Indicator empowers you with the insights and signals needed to make informed trading decisions. The signal conditions are a combination of three indicators, and XQ Forex Indicator only display  medium and long-term trends . The ind
Представляем   Quantum Heiken Ashi PRO Свечи Heiken Ashi, разработанные для обеспечения четкого понимания рыночных тенденций, известны своей способностью отфильтровывать шум и устранять ложные сигналы. Попрощайтесь со сбивающими с толку колебаниями цен и познакомьтесь с более плавным и надежным представлением графиков. Что делает Quantum Heiken Ashi PRO действительно уникальным, так это его инновационная формула, которая преобразует данные традиционных свечей в легко читаемые цветные столбцы. Кр
Bill Williams Advanced предназначен для автоматического анализа графика по системе " Profitunity " Билла Уильямса. Индикатор анализирует сразу четыре таймфрейма. Инструкция/Мануал ( Обязательно читайте перед приобретением ) Преимущества 1. Автоматически анализирует график по системе "Profitunity" Билла Уильямса. Найденные сигналы помещает в таблицу в углу экрана. 2. Оснащён трендовым фильтром по индикатору Аллигатор. Большинство сигналов системы рекомендуется использовать только по тренду.
Получайте ежедневную информацию о рынке с подробностями и скриншотами через наш утренний брифинг здесь, на mql5 , и в Telegram ! FX Power MT5 NG - это новое поколение нашего популярного измерителя силы валют FX Power. Что же предлагает этот измеритель силы нового поколения? Все, что вы любили в оригинальном FX Power ПЛЮС Анализ силы GOLD/XAU Еще более точные результаты расчетов Индивидуально настраиваемые периоды анализа Настраиваемый предел расчета для еще более высокой производительности Спец
3 Indicators in 1 indicator Strategy based on price action Made specifically for the best forex currency pairs Can be used in the best time frame of the market at a very reasonable price This indicator is basically 3 different indicatos . But we have combined these 3 indicators in 1 indicator so that you can use 3 indicators at the lowest price. All three strategies are based on price action. But based on different trends. Long term, medium term and short term Attributes : No repaintin
Matrix Arrow Indicator MT5
Juvenille Emperor Limited
5 (14)
Индикатор Matrix Arrow MT5   — это уникальный индикатор тренда 10 в 1, следующий за   100% неперерисовывающимся   индикатором с несколькими таймфреймами, который можно использовать на всех символах/инструментах:   форекс ,  товары ,   криптовалюты ,   индексы ,  акции . Индикатор Matrix Arrow MT5  будет определять текущую тенденцию на ранних этапах, собирая информацию и данные от до 10 стандартных индикаторов, а именно: Индекс среднего направленного движения (ADX) Индекс товарного канала (CCI)
Станьте Breaker Trader и получайте прибыль от изменений структуры рынка по мере изменения цены. Индикатор выключателя блока ордеров определяет, когда тренд или движение цены приближаются к истощению и готовы развернуться. Он предупреждает вас об изменениях в структуре рынка, которые обычно происходят, когда произойдет разворот или серьезный откат. Индикатор использует собственный расчет, который определяет прорывы и ценовой импульс. Каждый раз, когда новый максимум формируется около возможн
Представляем       Quantum Breakout PRO   , новаторский индикатор MQL5, который меняет ваш способ торговли в зонах прорыва! Разработан командой опытных трейдеров со стажем торговли более 13 лет,       Квантовый прорыв PRO       разработан, чтобы поднять ваше торговое путешествие к новым высотам с его инновационной и динамичной стратегией зоны прорыва. Quantum Breakout Indicator покажет вам сигнальные стрелки на зонах прорыва с 5 целевыми зонами прибыли и предложением стоп-лосса на основе по
«Пиранья» - автономная торговая система, определяющая уровни перекупленности и перепроданности на графике. Красная и синяя зоны отображают уровни перекупленности и перепроданности соответственно. Вход в сделку обозначен стрелками: стрелка вниз в красной зоне для "sell" и стрелка вверх в синей зоне для "buy". Уровень Тейк профита обозначен зеленой средней скользящей. Важные особенности: Регулировка уровня Тейк профита при изменении положения зеленой средней скользящей. Возможность усреднения пр
Auto Order Block with break of structure based on ICT and Smart Money Concepts (SMC) Futures Break of Structure ( BoS )             Order block ( OB )            Higher time frame Order block / Point of Interest ( POI )    shown on current chart           Fair value Gap ( FVG ) / Imbalance   -  MTF      ( Multi Time Frame )    HH/LL/HL/LH  -  MTF      ( Multi Time Frame )  Choch  MTF      ( Multi Time Frame )  Volume Imbalance     ,  MTF          vIMB Gap’s Equal High / Low’s     ,
Этот индикатор является уникальным, качественным и доступным инструментом для торговли, включающим в себя наши собственные разработки и новую формулу. В обновленной версии появилась возможность отображать зоны двух таймфреймов. Это означает, что вам будут доступны зоны не только на старшем ТФ, а сразу с двух таймфреймов - таймфрейма графика и старшего: отображение вложенных зон. Обновление обязательно понравится всем трейдерам, торгующим по зонам спроса и предложения. Важная информация Для мак
Индикатор разворота ADR сразу показывает, где в настоящее время торгуется цена относительно своего нормального среднего дневного диапазона. Вы будете получать мгновенные оповещения через всплывающие окна, электронную почту или push-уведомления, когда цена превышает свой средний диапазон и уровни выше него по вашему выбору, чтобы вы могли быстро переходить к откатам и разворотам. Индикатор рисует на графике горизонтальные линии на экстремумах среднего дневного диапазона, а также расширения выше
Introducing the South African Sniper indicator created by a small group of traders with a few years trading trading the financial market profitably . This is a plug and play indicator that provides you with  BUY and SELL (SNIPER ENTRY) signals with TARGET and trail stops. The indicator Works with all MT5 trading instruments. The indicator uses previous  chart data as receipt to speculate on future market moves.  "The South African Sniper indicator community are very happy with the indicator an
FX Trend MT5
Daniel Stein
4.67 (36)
FX Trend отображает направление тренда, его длительность, интенсивность и итоговый рейтинг для всех таймфреймов в реальном времени. Если вы хотите узнать, как определить правильные торговые возможности для постоянной прибыльности и успеха, мы настоятельно рекомендуем изучить правила нашей ПРОСТОЙ ТОРГОВОЙ СИСТЕМЫ ->  нажмите здесь, чтобы извлечь выгоду Основные возможности FX Trend Аналитические функции Анализ трендов в реальном времени для всех таймфреймов Идентичные результаты расчетов на в
TrendLine PRO MT5
Evgenii Aksenov
4.78 (50)
Индикатор   Trend Line PRO   является самостоятельной торговой стратегией. Он показывает смену тренда, точку входа в сделку, а так же автоматически рассчитывает три уровня Take Profit и защиту от потери Stop Loss Trend Line PRO   идеально подходит для всех символов Meta Trader:  валют, металлов, криптовалют, акций и индексов   Преимущества Trend Line PRO: Никогда не перерисовывает свои сигналы Возможность использования  как самостоятельную стратегию Имеет три автоматических уровня Take Profi
Индикатор Price Action Finder Multi это индикатор точек входа, который ищет и отображает паттерны системы Price Action сразу на десятках торговых инструментов и на всех стандартных таймфреймах: (m1, m5, m15, m30, H1, H4, D1, Wk, Mn). Найденные паттерны индикатор помещает в таблицу в нижней части экрана. Кликая на названия паттерна в таблице вы можете перемещаться на график, где этот паттерн находится. Инструкция/Мануал ( Обязательно читайте перед приобретением ) | Версия для МТ4 Преимущества 1.
TPA True Price Action indicator reveals the true price action of the market makers through 100% non-repainting signals strictly at the close of a candle! TPA shows entries and re-entries, every time the bulls are definitely stronger than the bears and vice versa. Not to confuse with red/green candles. The shift of power gets confirmed at the earliest stage and is ONE exit strategy of several. There are available now two free parts of the TPA User Guide for our customers. The first "The Basics"
Fractal Advanced - отображает индикаторы Fractal и Alligator на графике цены. Обладает широкими возможностями настроек и кастомизации. Также оснащён алертами и системой горячих клавиш. Инструкция/Мануал ( Обязательно читайте перед приобретением ) | Версия для МТ4 Преимущества 1. Индикатор не забивает весь график фракталами, а позволяет отображать только актуальные сигналы. 2. Регулировка количества фракталов осуществляется при помощи скролла мыши с зажатой клавишей Shift. 3. Мгновенное ото
Другие продукты этого автора
KT Momentum Arrows MT5
KEENBASE SOFTWARE SOLUTIONS
5 (3)
KT Momentum Arrows Indicator is based on a momentary breakout which is calculated using the bands deviation and emerging volatility in a certain direction. A buy signal is generated when the price closes above the upper band and a sell signal is generated when the price closes below the lower band. A magnitude coefficient is used as the input which affects the band deviation and volatility at the same time. The coefficient value should be carefully selected and analyzed based on the instrument a
ACB Breakout Arrows
KEENBASE SOFTWARE SOLUTIONS
4.17 (35)
The ACB Breakout Arrows indicator provides a crucial entry signal in the market by detecting a special breakout pattern. The indicator constantly scans the chart for a settling momentum in one direction and provide the accurate entry signal right before the major move.  Get multi-symbol and multi-timeframe scanner from here - Scanner for ACB Breakout Arrows MT4 Key features Stoploss and Take Profit levels are provided by the indicator. Comes with a MTF Scanner dashboard which tracks the brea
KT Auto Fibo MT5
KEENBASE SOFTWARE SOLUTIONS
5 (1)
KT Auto Fibo draws Fibonacci retracement levels based on the ongoing trend direction. The Highs and Lows are automatically selected using the Maximum and Minimum points available on the chart. You can zoom in/out and scroll to adjust the Fibonacci levels accordingly. Modes Auto:  It draws the Fibonacci levels automatically based on the chart area. Manual:  It draws the Fibonacci levels only one time. After that, you can change the anchor points manually. Usage: Helps to predict the future p
ACB Breakout Arrows MT5
KEENBASE SOFTWARE SOLUTIONS
5 (1)
Индикатор ACB Breakout Arrows формирует важные сигналы на вход в рынок, определяя специальные паттерны пробоя. Индикатор постоянно сканирует график, ожидая появления импульса в одном направлении, и генерирует точный сигнал входа прямо перед большим движением. Основные возможности: Не перерисовывается! Показывает уровни стоп-лосс и тейк-профит. Подходит для внутридневых трейдеров, свинг-трейдеров и скальперов. Оптимизированный алгоритм для повышения точности сигналов. Предварительно рассчитыва
KT Asian Breakout MT5
KEENBASE SOFTWARE SOLUTIONS
KT Asian Breakout carefully analyzes the range-bound market during the Asian session and then fires a long or short trade after doing some preassessment based on its inbuilt technical analysis module. The executed orders are closed within a day before the completion of the next day session. The inbuilt technical analysis module checks for the session range and compares it with the last 20 days price movement. If it finds any erratic price movement within the session, the orders are not execute
If you trade Forex, having detailed information about the currency strength and currency pairs correlation can take your trading to new heights. The correlation will help to cut your risk in half, and strength analysis will help to maximize the profits. This indicator provides a hybrid approach for selecting the most appropriate currency pairs using the strength analysis and currency pairs correlation. How to use the Currency Strength Analysis Suppose your trading strategy provides a buying o
KT Heiken Ashi Smoothed is a smoothed version of the standard Heiken Ashi. Moreover, it also plots buy/sell arrows on a trend change. A buy arrow is plotted when it change to a bullish state from bearish state. A sell arrow is plotted when it change to a bearish state from bullish state. Mobile notifications, Email, Sound and Pop-up alerts included. What exactly is Heiken Ashi Smoothed? It filters out the false signals and noise in the standard Heiken Ashi. It applies the set of two moving a
KT Trend Magic MT5
KEENBASE SOFTWARE SOLUTIONS
KT Trend Magic shows the trend depiction on chart using the combination of market momentum and volatility. A smoothing coefficient is used to smooth out the noise from the signal.It can be used to find out the new entries or confirm the trades produced by other EA or indicator. Features Drag n drop MTF scanner which scans for the new signals across multiple time-frames. Find new entries in the trend direction. Improve the accuracy of other indicators when used in conjunction. Can be used as a
Divergence is one of the vital signals that depicts the upcoming price reversal in the market. KT Stoch Divergence shows the regular and hidden divergences build between the price and stochastic oscillator. Limitations of KT Stoch Divergence Using the Stochastic divergence as a standalone entry signal can be risky. Every divergence can't be interpreted as a strong reversal signal. For better results, try to combine it with price action and trend direction. Features Marks regular and hidde
ACB Trade Filter MT4
KEENBASE SOFTWARE SOLUTIONS
5 (2)
Индикатор ACB Trade Filter отфильтровывает маловероятные торговые сигналы в торговой стратегии. Продукт использует сложный алгоритм фильтрации на основе рыночных настроений и трендов. Заявки Хорошо сочетается с другим нашим индикатором ACB Breakout Arrows . Отфильтровывает маловероятные сигналы любого индикатора. Избегает слишком частых сделок и минимизирует убытки. Торгует в направлении рыночных настроений. Хорошо справляется с волатильностью. Инструкция по применению Покупайте, если гистог
KT Momentum Arrows
KEENBASE SOFTWARE SOLUTIONS
KT Momentum Arrows Indicator is based on a momentary breakout which is calculated using the bands deviation and emerging volatility in a certain direction. A buy signal is generated when the price close above the upper band and a sell signal is generated when the price close below the lower band. A magnitude coefficient is used as the input which affects the band deviation and volatility at the same time. The coefficient value should be carefully selected and analyzed based on the instrument and
KT COG Advanced MT4
KEENBASE SOFTWARE SOLUTIONS
1 (1)
KT COG is an advanced implementation of the center of gravity indicator presented by John F. Ehlers in the May 2002 edition of Technical Analysis of Stocks & Commodities magazine. It's a leading indicator which can be used to identify the potential reversal points with the minimum lag. The COG oscillator catches the price swings quite effectively. MT5 version of the same indicator is available here KT COG Advanced MT5 Calculation of COG The COG indicator is consist of the two lines. The mai
KT Pin Bar
KEENBASE SOFTWARE SOLUTIONS
KT Pin Bar identifies the pin bar formation which is a type of price action pattern which depicts a sign of reversal or rejection of the trend. When combined with support and resistance, BRN and other significant levels, Pin Bar pattern proved to be a very strong sign of reversal. Basically, a pin bar is characterized by a small body relative to the bar length which is closed either in upper or lower 50% part of its length. They have very large wicks and small candle body. A pin bar candlest
KT Trend Magic
KEENBASE SOFTWARE SOLUTIONS
KT Trend Magic shows the trend depiction on chart using the combination of market momentum and volatility. A smoothing coefficient is used to smooth out the noise from the signal.It can be used to find out the new entries or confirm the trades produced by other EA/Indicators. Usage Drag n drop MTF scanner which scans for the new signals across multiple time-frames. Find new entries in the trend direction. Improve the accuracy of other indicators when used in conjunction. Can be used as a dyna
KT Auto Fibo
KEENBASE SOFTWARE SOLUTIONS
KT Auto Fibo draws Fibonacci retracement levels based on the ongoing trend direction. The Highs and Lows are automatically selected using the Maximum and Minimum points available on the chart. You can zoom in/out and scroll to adjust the Fibonacci levels accordingly. Modes Auto:  It draws the Fibonacci levels automatically based on the chart area. Manual: It draws the Fibonacci levels only one time. After that, you can change the anchor points manually. Usage: Helps to predict the future pr
KT Psar Arrows
KEENBASE SOFTWARE SOLUTIONS
KT Psar Arrows plots the arrows on chart using the standard Parabolic SAR indicator. A bullish arrow is plotted when the candle's high touch the SAR. A bearish arrow is plotted when the candle's low touch the SAR. The signals are generated in the real-time without waiting for the bar close.  Features A beneficial tool for traders who want to experiment with the trading strategies that include the use of Parabolic Sar indicator.  Can be used to find turning points in the market. Use custom PSA
KT Ichimoku Trader
KEENBASE SOFTWARE SOLUTIONS
1 (1)
KT Ichimoku Trader is a fully automated expert advisor that offers five popular trading strategies based on the Ichimoku indicator. Each strategy has it's own entry and exit method without any interference to other strategies. The Ichimoku system can be applied to all major currency pairs and metals. However, we found that it performs reasonably well mainly on two pairs.   MT5 Version is available here  https://www.mql5.com/en/market/product/35043 Features Trade up to 5 famous trading strate
KT Volatility oscillator analyze the past and current market data with a mathematical formula to display the result in a form of an oscillator. The growing and deteriorating waves are equivalent to high and low volatility in the asset.  In a nutshell, volatility is simply a measurement of the price fluctuation of an asset over a certain period of time. Without volatility, there would not much movement in the market and traders would not be able to profit from the price movements. Use of Volati
KT COG Robot
KEENBASE SOFTWARE SOLUTIONS
KT COG Robot is a fully automated Expert Advisor based on the KT COG Indicator . The COG indicator was originally presented by John F. Ehlers in the May 2002 edition of Technical Analysis of Stocks & Commodities magazine. The EA fires a long trade when COG line cross above the signal line and a short trade is fired when the COG line cross below the signal line.  Adaptive Filtration Our adaptive filtration algorithm combines the original COG formula with the major trend direction and market ac
ACB Breakout Arrows EA
KEENBASE SOFTWARE SOLUTIONS
This is a 100% automated expert advisor based on our custom indicator named "ACB Breakout Arrows" . The entries are based on a breakout pattern that constantly occurs in a bi-directional manner. The intensity of entry signals can be manipulated using the external input called "Signal Sensitivity". MT5 Version is available here  https://www.mql5.com/en/market/product/35785 Trades Confirmation ACB Breakout Arrows EA provides an ability to filter the entries using our another custom indicator n
KT Asian Breakout
KEENBASE SOFTWARE SOLUTIONS
4 (1)
KT Asian Breakout carefully analyzes the range-bound market during the Asian session and then fires a long or short trade after doing some preassessment based on its inbuilt technical analysis module. The executed orders are closed within a day before the completion of the next day session. The inbuilt technical analysis module checks for the session range and compares it with the last 20 days price movement. If it finds any erratic price movement within the session, the orders are not execute
KT London Breakout
KEENBASE SOFTWARE SOLUTIONS
First thirty minutes are essential for a trading session. The early reaction of traders and market players sets a path for the rest of the day. KT London Breakout EA takes advantage of this phenomenon, and after analyzing the first thirty minutes of London session, it places two bidirectional pending orders. One of pending order is eventually canceled after realizing the market direction with certainty. It has been strictly tested and developed for EUR/JPY using 30-Min Time Frame. You can ex
Use of support and resistance in systematic trading is very subjective. Every trader has their own idea and way to plotting the support and resistance levels on the chart. KT Support and Resistance indicator take out this ambiguity out of the situation and automatically draws support and resistance levels following an algorithmic approach using a unique multi-timeframe analysis. When launched on the chart, It immediately scan the most significant extreme points across all the available timefr
MACD Divergence Seeker
KEENBASE SOFTWARE SOLUTIONS
KT MACD Divergence Seeker trades the regular and hidden divergence signals generated by our free indicator named KT MACD Divergence indicator. Trading the standalone divergences can be a risky affair that's why the KT MACD Divergence Seeker combines the standard divergence signals with an advanced analysis module to exploit the price inefficiencies on some FX pairs. What is the Divergence exactly? As a general conception if the price is making higher highs, then macd should also be making
KT Asian Breakout indicator scans and analyzes a critical part of the Asian session to generate bi-directional buy and sell signals with the direction of a price breakout. A buy signal occurs when the price breaks above the session high, and a sell signal occurs when the price breaks below the session low. MT5 Version is available here https://www.mql5.com/en/market/product/41704 Things to remember If the session box is vertically too wide, a new trade should be avoided as most of the price
MACD Divergence MT4
KEENBASE SOFTWARE SOLUTIONS
KT MACD Divergence shows the regular and hidden divergences build between the price and oscillator. If your trading strategy anticipates the trend reversal, you can include the MACD regular divergence to speculate the potential turning points. And if your trading strategy based on the trend continuation, MACD hidden divergence would be a good fit. Limitations of KT MACD Divergence Using the macd divergence as a standalone entry signal can be a risky affair. Every divergence can't be interpr
KT Bollinger Bands Trader is a 100% automated expert advisor that's incorporated a mean reversion trading strategy using the Bollinger bands during the period of low volatility. Price often reacts at the upper or lower line of Bollinger bands, but a reversal not always occurs. However, there is more chance of price reversal during the time of low volatility. Entries A buy trade is activated when price correctly aligns below the bottom line of Bollinger bands. A sell trade is activated when pri
KT CCI Divergence MT4
KEENBASE SOFTWARE SOLUTIONS
KT CCI Divergence shows the regular and hidden divergence created between the price and CCI oscillator. Divergence is one of the vital signals that depicts the upcoming price reversal in the market. Manually spotting the divergence between price and CCI can be a hectic and ambiguous task. Limitations of KT CCI Divergence   Using the CCI divergence as a standalone entry signal can be risky. Every divergence can't be interpreted as a strong reversal signal. For better results, try to combine it
KT Heiken Ashi Smoothed is a smoothed version of the standard Heiken Ashi. Moreover, it also plots buy/sell arrows on a trend change. A buy arrow is plotted when it change to a bullish state from bearish state. A sell arrow is plotted when it change to a bearish state from bullish state. Mobile notifications, Email, Sound and Pop-up alerts included. What exactly is Heiken Ashi Smoothed? It filters out the false signals and noise in the standard Heiken Ashi. It applies the set of two moving a
Фильтр:
Marco da Costa
121
Marco da Costa 2022.12.01 15:01 
 

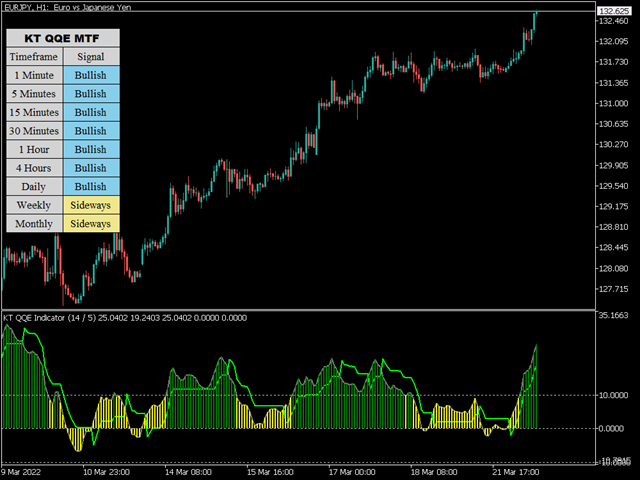
Excellent indicator...one that works very well on the hourly chart! Well done and thank you!

KEENBASE SOFTWARE SOLUTIONS
46572
Ответ разработчика Nitin Raj 2022.12.01 15:21
Thanks for your feedback.
Ответ на отзыв