• Обзор
  • Отзывы
  • Обсуждение

Go Way TREND

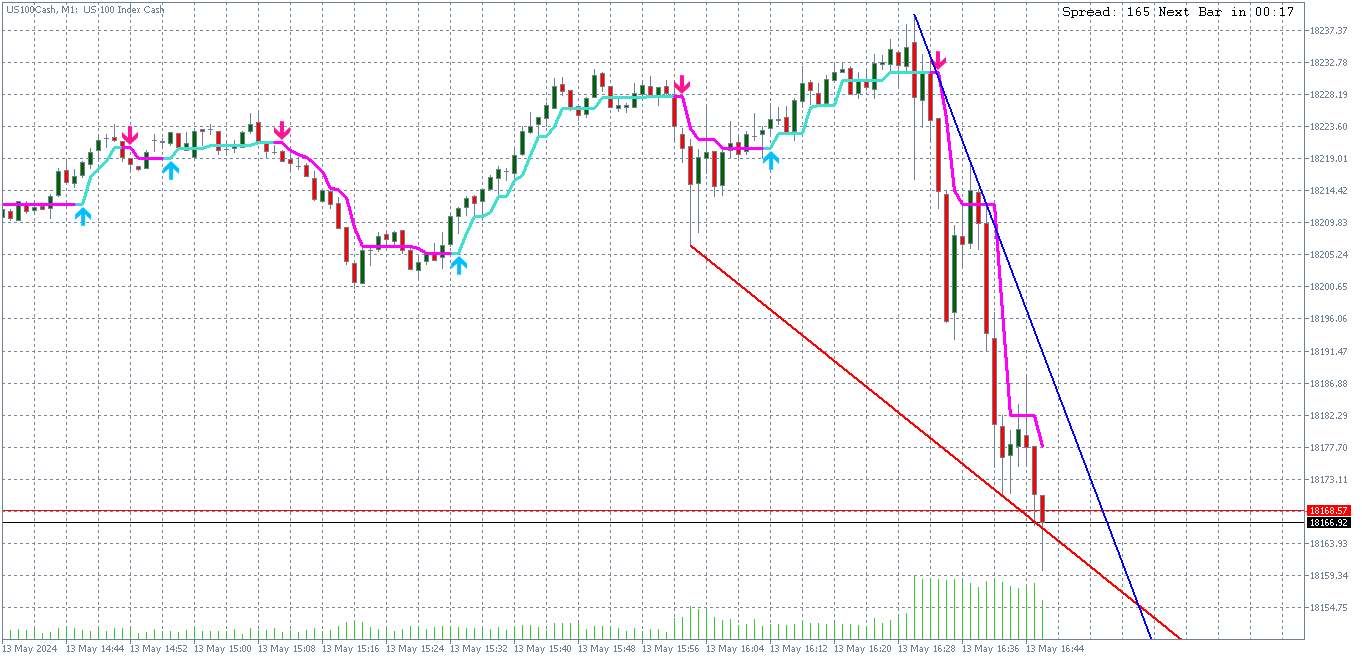
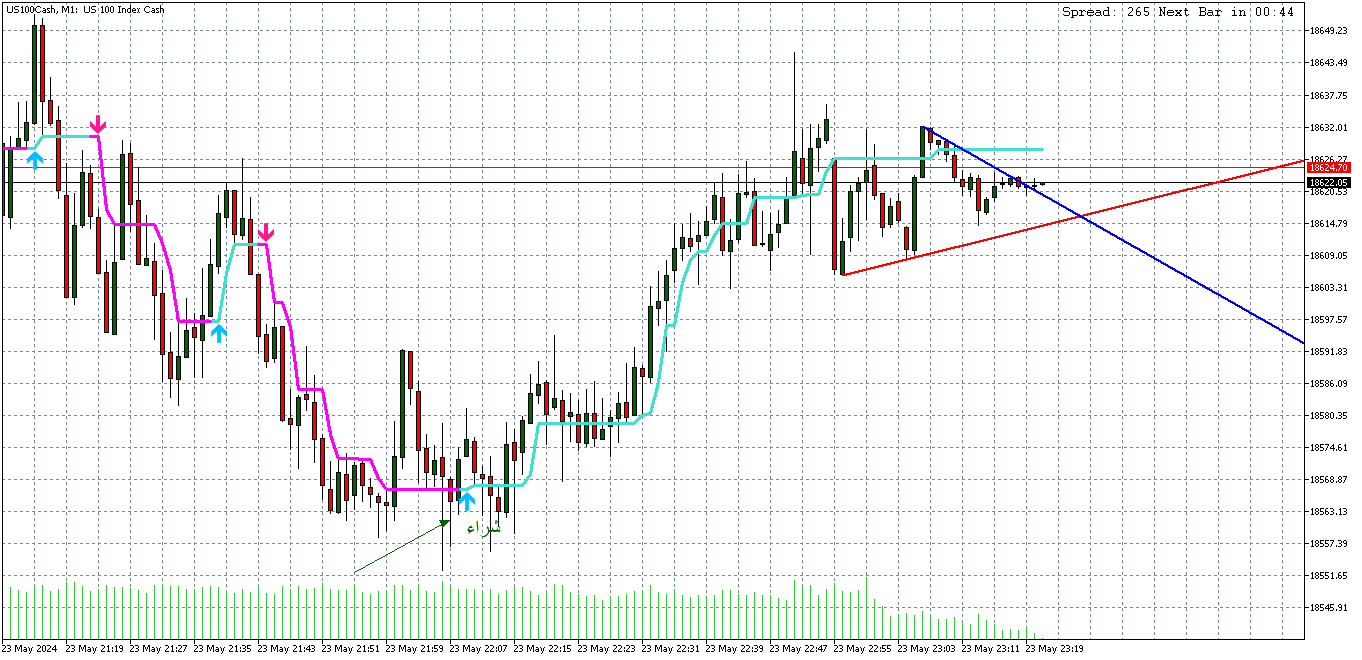
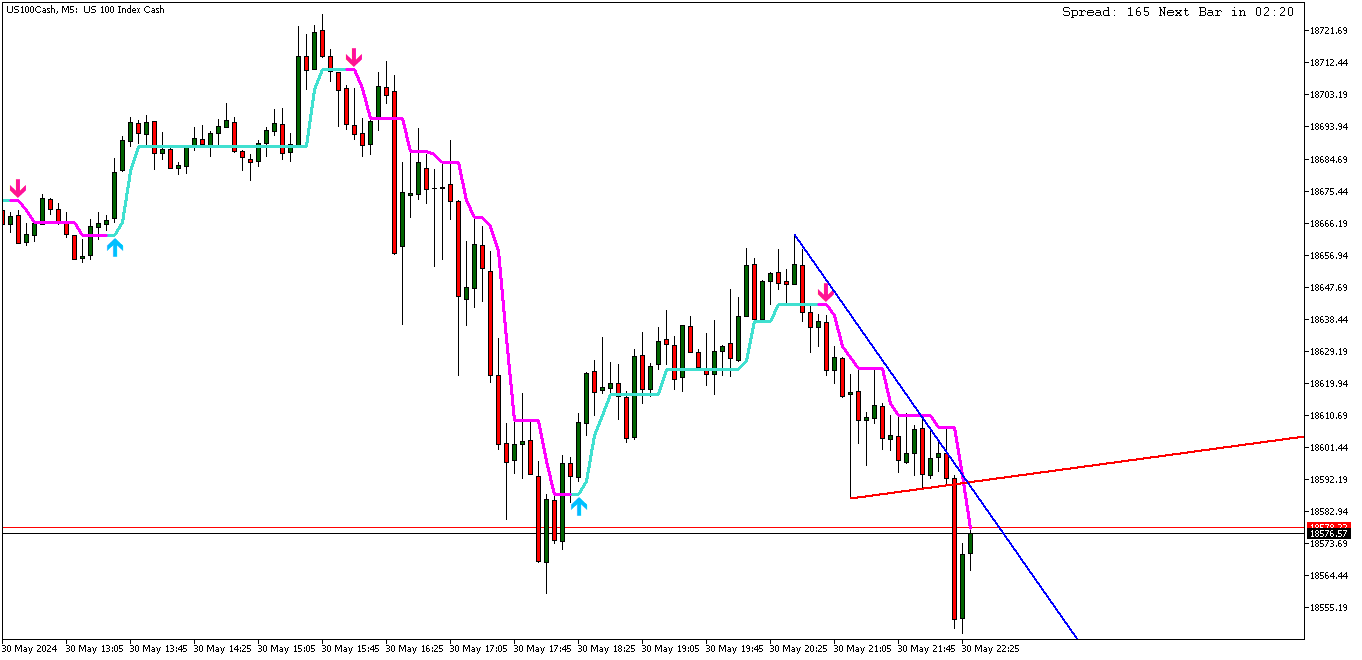
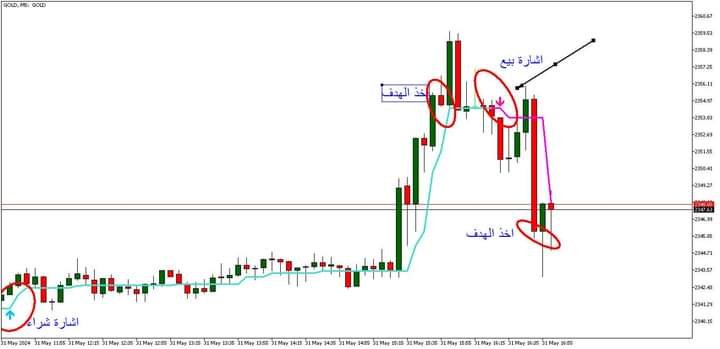
Следуйте тренду.  Да, дождитесь сигнала на вход, будь то покупка или продажа, и входите по цене, а прибыль берется при изменении линии рисования, фиксации прибыли или при появлении противоположного сигнала. Это очень просто и работает на всех. валюты, металлы, индексы и на всех кадрах. 
 Как войти?  Дождитесь сигнала на покупку или продажу и входите по нему. Зафиксировать или зарезервировать прибыль можно после изменения линии рисунка или появления противоположного сигнала.
Рекомендуем также
This is Gekko's Bollinger Bands indicator. It extends the use of the famous Bollinger Bands and calculates strong entry and exit signals using price action on the edge and on the middle bands. You can set it up in many different ways, eg: pullback, pullback against trend, middle band crossing and middle band crossing against trend. Inputs Number of Bars to Plot Indicator:  number of historical bars to plot the indicator, keep it low for better performance; Produces Signal Only When a Bar Closes:
VTC Volatility
Ricardo Almeida Branco
The VTC Volatility indicator was written to support a Brazilian stock market strategy in the WDO (USDBRL), but it can be adapted to other strategies and markets. In the new indicator update, it is now allowed to choose up to 4 levels to determine the range, and thus be more versatile. The Brazilian stock exchange (B3) has the VTC which is a "Structured Exchange Rate Volatility Transaction" (more information on the B3 website). At around 10:00 am, the VTC "Call" comes out and Brazilian
Daily VWAP, continues for a period of hours (eg, 10 hours of history), with color to indicate change of direction and bands to map good entry and exit points. The indicator was created to map the center of the market, and find good buying moments, trend analysis or market correction points are easily detected, allowing you to understand moments of exhaustion and buying and selling points Copyright (c) <year> <copyright holders> Permission is hereby granted, free of charge, to any person obtain
移動平均線の傾斜角度をラベルに表示するだけのシンプルなインジケーターです。ラベルのフォントサイズ、色の調整、移動平均線の設定など全て行えます。また、移動平均線の傾斜角度というものは、MT5のウインドウサイズを変更すると、移動平均線自体の傾斜角度も変更されてしまうことをご了承ください。これは、インジケーターの仕様ではなく、移動平均線の傾斜角度というもの自体の仕様です。 また、MT5には、OnCalculateから値を取得してしまうと、インジケーターを削除する際にオブジェクトが残ってしまうという公式のバグが存在します。その為、当インジケーターでは、OnCalculateから移動平均線の傾斜角度の値を取得し、それを、OnTimer関数で1秒毎に評価し、オブジェクトに傾斜角度を出力しております。なので、傾斜角度の出力レベルはほぼティック毎と変わりませんことをご理解下さい。 また、今後のアップデートで、時間足毎に移動平均線の傾斜角度を評価できるようアップデートして参ります。
DYNAMIC SR TREND CHANNEL Dynamic SR Trend Channel is a simple indicator for trend detection as well as resistance/support levels on the current timeframe. It shows you areas where to expect possible change in trend direction and trend continuation. It works with any trading system (both price action and other trading system that use indicators) and is also very good for renko charting system as well. In an uptrend, the red line (main line) serves as the support and the blue line serves as the
This Indicator adding power to traditional zigzag indicator. With High-Low numbers in vision it will be easier to estimate change of trend by knowing the depth of each wave. Information including points, pips, percentage%, and #bars can be displayed based on configuration. All information is real-time update. This indicator is especially useful in sideway market to buy low sell high.
The patterns of 3 (three) Candles: Three White Soldiers; Three Black Crows; These are reversal patterns widely used by traders, as they have a high probability of showing the inversion of the current market movement. For example, if in a bullish trend there are three black crows, there is a high probability of reversing the current bullish movement. The Three White Soldiers have the following characteristics: There are 3 consecutive candles with a good body, that is, the difference between
Индикатор Hrum - был создан для нейтрализации временных пауз и откатов. Он анализирует поведение цены и, если наблюдается временная слабость тренда, вы можите заметить это из показаний индикатора, как и в случае выраженной смены направления тренда. Войти в рынок не трудно, а вот удержаться в нем куда сложнее. С индикатором Giordano Bruno и его уникальной трендовой линией удержаться в тренде станет намного проще! Каждый рост и каждое падение отражается и на вашем эмоциональном состоянии: надеж
MT5. Распознаёт боковой тренд (флет) на ранней стадии и рисует его границы, на любом таймфрейме, на любом инструменте, до смены тенденции. Индикатор основан на анализе характеристик волн, заранее предупреждает о возможном боковом тренде (Flat). Вершины волн помечены   буквой с цифрой по моей разработанной волновой системе.  Индикатор   предскажет флет раньше чем мы его увидим на графике. Не требует сложной настройки параметров. Адаптирован под 2,4 и 3,5 знаковые котировки. При первой загрузке и
This product generates signals at closing bars thanks to channel scaling. It visualizes these signals with an arrow. The color of the arrow indicates the direction of the trade. The default settings are valid for the H1 period. You can backtest for each period and product. The code content of the indicator has been applied in accordance with price movements as much as possible. For this reason, it detects trend beginnings and ends well. Parameter descriptions: PER: Indicates the number of b
This is a great Metatrader5 Tool , which you can use Daily for your profitable Trading. The Accuracy is the best system you need to succeed in trading without stress. The signals doesn't repaint at all, alerts on bar close, and stays glued. The system works on MT5 and another version for MT4 also available. What you get upon purchase: -Lifetime support for the use of the system -   Easy to use, clean user friendly interface with no single settings required -   Arrow Signals showing where t
Our indicator will help you to make a decision whether to Buy or Sell , including where to set the Take Profit and Stop Loss . The Buy/Sell signal will not redraw nor repaint until new signal occurs. The Take Profit and Stop Loss will change following the market conditions. Our indicator will give alert to your mobile/handphone when new buy/sell signal arrive. For best result, combine this indicator with your knowledge on price action and support & resistance, also don't forget to watch for the
To download MT4 version please click here . - This is the exact conversion from TradingView: "Linear Regression Candles" By "ugurvu". - The overall look of the indicator is like Heiken Ashi. - It can be used as a trend confirmation indicator to detect the right trend direction. - This indicator lets you read the buffers for Candles' OHLC. - This is a non-repaint and light processing load indicator - You can message in private chat for further changes you need. Thanks
This product contains following indicators: (Lines + LineSAR + Channels + BTL + Ladder) Phi Lines  - special EMAs, similar to MIMAs from Phicube; Phi LineSAR  - erase and highlight Phi Lines in support or resistance. Similart to MIMASAR from Phicube; Phi Channels  - show support and resistance, similar to Phibo from Phicube (Green and Read Lines); Phi BTL  - candles color following Phi Lines alignment; Phi LADDER  - Indicator that allow you to visualize possible targets.  FUTURO Tool Future to
BS Time Band是一个很好的波段交易指示器,这个指标可以单独使用,但是最好是配合 StartPoint 一起使用效果更好,适用于任何时间框架,非常适合喜欢做波段交易的朋友。它能很好的体现出一个波段的完整信息,你可以很快的从这个指示器上寻找到最佳的预警区域,然后配合 StartPoint 找到最佳的buy位置和最佳的sell位置,也能很好根据指示器去坚守自己的持仓定订单。指标不含有未来函数,不会重新绘制,不仅能够应用到自己的手动交易过程中,还能完全可以写入到自己的EA中。(如果你感觉到这个指标能够帮助你进行更准确的交易,请帮忙给个好评,希望我的作品能够帮助更多有需要的人) =================参考使用方法=================== 此指标可以适用于任何交易品种。 做波段建议参数 timeFame:M5 如果配合 StartPoint 建议 StartPoint 的参数为(240,60)
- This is an implementation of OCC ==> open close cross - This indicator applies twelve different averaging methods to open and close prices separately to signal the trend switching. - All MA methods are set as input as well as period and different offsets applied to linear regression and ALMA averaging. - Buffers 16 and 17 can be used in EAs to detect trend direction. - You can message in private chat for further changes you need.
My PVSR
Ashok Kumar Singha
My PVSR   is based on All Type of Pivot Points. Use this Indicator to get proper Support / Resistance Zone and Trade accordingly.. Recommendation: Use this Indicator along with my another Indicator --->>> Dr. Trend   <<<--- Click Here ; To get the best output result feel free to contact me ; Best of Luck It can be used for: All Pairs: Forex, Cryptocurrencies, Metals, Stocks, Indices etc. All Timeframe All Brokers All type of Trading Style like Scalping, Swing, Intraday, Short-Term, Lon
It's a multi-symbol and multi-timeframe scanner for our indicator - ACB Breakout Arrows . With default settings, it scans for the buy/sell signals on 28 currency pairs and 9 time-frames concurrently.   Features It can scan 252* combinations of symbols and time-frames from a single chart. Open the signal's chart loaded with a predefined template with a single click.  Easy drag n drop anywhere on the chart. Real-time alerts with popup, sound, push-notifications and email alerts.  Input Para
Fibonacci retracement levels—stemming from the Fibonacci sequence—are horizontal lines that indicate where   support   and   resistance   are likely to occur. Each level is associated with a percentage. The percentage is how much of a prior move the price has retraced. The Fibonacci   retracement   levels are 23.6%, 38.2%, 61.8%, and 78.6%. While not officially a Fibonacci ratio, 50% is also used. The indicator is useful because it can be drawn between any two significant price points, such as
Индикатор Scaner. Валютные пары никогда не растут и не падают по прямой. Их подъемы и падения перемежаются откатами и разворотами. Каждый рост и каждое падение отражается и на вашем эмоциональном состоянии: надежда сменяется страхом, а когда он проходит, снова появляется надежда. Рынок использует ваш страх для того, чтобы не дать вам воспользоваться сильной позицией. В такие моменты вы наиболее уязвимы. Все изменится, если вы будете использовать индикатор Scaner. Индикатор Scaner был созд
Индикатор предназначен для замены стандартной вертикальной ценовой шкалы, расположенной с правой стороны в окне графика клиентского терминала, на более удобную ценовую шкалу с возможностью детальной настройки параметров отображения этой шкалы. Кроме этого, индикатор позволяет делать фоновую заливку окна графика любым изображением по желанию пользователя и двухцветную сетку с элементами её тонкой настройки. В первую очередь, индикатор  будет полезен трейдерам, обладающим не самым лучшим зрением,
A useful scanner/dashboard that shows the RSI values for multiple symbols and Time-frames. It can be easily hidden/displayed with a simple click on the scanner man top left of the dashboard. You can input upper and lower RSI values and the colours can be set to show when above/below these values. The default values are 70 and 30. There are also input colours for when the RSI is above or below 50 (but not exceeding the upper/lower levels Symbols and time-frames are input separated by commas.
移動平均線クロス、ボリンジャーと移動平均線のクロス、移動平均線の角度でサイン表示 MT5インジケータ こちらに サイト があります。 このインジケータは3つのパターンでサインを表示(切り替え可能)します。 ① 移動平均線のクロス ② ボリンジャーバンドと短期移動平均線とのクロス ③ ボリンジャーバンドと短期移動平均線とのクロスと、中期移動平均線と長期移動平均線の角度 ⓸ ボリンジャーバンドと短期移動平均線とのクロス(サインを交互に表示) 移動平均線のクロス 指定した短期移動平均線と長期移動平均線のゴールデンクロスでは買いサイン、デットクロスでは売りサインを表示します。 ディフォルトでは短期は5,長期は20となっています。 もちろん変更可能になります。 移動平均線の種類をEMA(指数平滑移動平均線)やSMMA(平滑化移動平均)などに変更可能で適する価格も変更可能になります。 ボリンジャーバンドと短期移動平均線のクロス ボリンジャーバンド(以降BB)と短期移動平均線のクロスでサインを表示します。 ディフォルトではBB+1σと5MAのゴールデンクロスで買いサイン、BB-1σと5MAのデ
This indicator marks the relevant volume levels among the day. The two relevant levels are the candle with more volume and the period with more volume of lots transacted.  The filled red background is the range of price with the most relevant volume of the day (probably the big player that is command the game). The purple lines shows the range of price with most volume (probably a area where some big player is accumulating before force a market direction). There is also the dot lines that mark
IBB Candles is a tool that is based on the concept of Inverse Bollinger Bands. It compares price relative to state of the bands and plots candles with different colors defining the current state of the market i.e range | trend | strong trend. As the name suggests IBB(Inverse Bollinger Bands) is a technique which is completely different from the traditional Bollinger Bands and proves to be much more effective in analyzing market. This personal implementation makes this tool a more reliable optio
Информационная панель ADR Alert показывает вам, где в настоящее время торгуется цена по отношению к ее нормальному среднему дневному диапазону. Вы будете получать мгновенные оповещения через всплывающие окна, электронную почту или push-уведомления, когда цена превышает свой средний диапазон и уровни выше него по вашему выбору, чтобы вы могли быстро переходить к откатам и разворотам. Черта предназначена для размещения на пустом графике и просто находится в фоновом режиме и предупреждает вас о до
This is Gekko's Channels Plus indicator. It extends the use of the famous Channels and calculates strong entry and exit signals using price action on the top, bottom and middle lines. You can set it up in many different ways, eg: pullback, pullback against trend, middle line crossing and middle line crossing against trend. Inputs Number of Bars to Plot Indicator:  number of historical bars to plot the indicator, keep it low for better performance; Produces Signal Only When a Bar Closes:  wait fo
Индикатор Crossover System основан на трех скользящих средних, который изменяет цвет баров в зависимости от определенных условий скользящих средних. Этот индикатор позволит реализовывать системы из одной скользящей средней, из двух скользящих средних и из трех скользящих средних. Параметры индикатора: fastperiod  - период быстрой скользящей средней fastMethod  - метод построения быстрой скользящей средней fastPrice  - метод вычисления быстрой скользящей средней fastshift  - сдвиг быстрой скользя
KT Triple Top-Bottom identifies the triple top/bottom pattern with a breakout signal in the opposite direction. It is used to identify potential trend reversals. A Triple Top pattern is formed when the price reaches a high point three times, while a Triple Bottom pattern occurs when the price comes to a low point three times. Features The indicator detects the triple top/bottom pattern with high precision and accuracy. The indicator suggests a shift in momentum, with sellers or buyers takin
The KT RSI Power Zones divides and shows the movement of RSI into four different power zones to identify the potential support and resistance zones using the RSI. Bull Support The bull support ranges from 40 to 50. The price is expected to reverse to the upside from this zone. Bull Resistance The bull resistance ranges from 80 to 90. The price is expected to reverse to the downsize from this zone. Bear Support The bear support ranges from 20 to 30. The price is expected to reverse to the
С этим продуктом покупают
IVISTscalp5
Vadym Zhukovskyi
5 (3)
Представляем вам индикатор iVISTscalp 5 , который не только уникален, но и эффективен в использовании при анализе торговых операциях. Этот индикатор основывается на временных данных и является результатом многолетнего опыта и глубокого анализа финансовых рынков. Индикатор iVISTscalp 5 отличный помощник для ручной торговли. Удобство, простота и визуализация. Все самое сложное спрятано внутри. Мы максимум упростили настройки и использование индикатора iVISTscalp 5 . Индикатор подходит для всех
Профессиональный Инструмент для Скальпинга на Deriv Внимание! Индикатор будет продан в ограниченном количестве!!! Предыщуие 5 копий были проданы по 250$ Оставшиеся 4 копии будут проданы по 350$ Следующая цена 500$ Описание: Этот торговый индикатор предназначен для профессиональных трейдеров, ориентированных на скальпинг. Разработанный с учетом особенностей рынка, он предоставляет высокоточные сигналы для торговли в сторону спайков. Работает на таймфрейме М1 и поддерживает следующие символы:
note: this indicator is for METATRADER4, if you want the version for METATRADER5 this is the link:  https://www.mql5.com/it/market/product/108106 TRENDMAESTRO ver 2.4 TRENDMAESTRO recognizes a new TREND in the bud, he never makes mistakes. The certainty of identifying a new TREND is priceless. DESCRIPTION TRENDMAESTRO identifies a new TREND in the bud, this indicator examines the volatility, volumes and momentum to identify the moment in which there is an explosion of one or more of these data a
Indicador en MQL5, que obtiene el promedio de 10 EMAS, que son alineadas según Fibonacci, obteniendo un promedio, que sera suavizado.  Se puede ingresar un numero desde 2 a N, que multiplica a los EMA-Fibonacci. Funciona en cualquier criptomoneda, etc. etc... pudiendo calcular el futuro segun la tendencia de las EMAS. Funciona excelentemente en tramos largos, determinando exactamente el mejor inicio/salida. El precio inicial por apertura sera por un periodo de tiempo, luego aumentará.
WanaScalper
Isaac Wanasolo
1 (1)
A scalping indicator based on mathematical patterns, which on average gives signals with relatively small SL, and also occasionally helps to catch big moves in the markets (more information in the video) This indicator has three main types of notifications: The first type warns of a possible/upcoming signal on the next bar The second type indicates the presence of a ready signal to enter the market/open a position The third type is for SL and TP levels - you will be notified every time price r
TREND HARMONY MT5 – Multi Timeframe Trend and Phase and Pullback Level Visualizer indicator for Metatrader5 The TREND HARMONY indicator automates deep trend analysis and generates visualizations for you. Take control of your trades by eliminating uncertainty! Revolutionize your trading experience with precision and insight through the TREND HARMONY Multi Timeframe indicator – your ultimate MT5 trend visualization indicator. [  Features and Manual   | MT4 version |   All Products   ] Are you t
VTrende Pro
Andrii Diachenko
5 (1)
VTrende Pro - МТФ индикатор для трендовой торговли с панелью индикации для МТ5 !!! - Подробное описание на русском языке под видео (на Youtube) - !!! Хотя сигналы индикатора VTrende Pro можно использовать, как сигналы полноценной торговой системы, рекомендуется применять их в связке с ТС Билла Вильямса. VTrende Pro - это расширенная версия индикатора VTrende . Отличие Pro версии от VTrende: - Временные зоны - Сигнал V - сигнал 1-2 волн Основная задача индикатора - определить точки изм
RAD CRITICAL LEVES RAD indicator tracks “Relevant Volume” in real time, identifying accumulation and distribution processes, projecting them in the chart as SUPPORT or RESISTANCE zones. Natural   support   and resistance levels are generated by Volume Accumulation and Distribution processes. As these processes evolve, levels at which the relevant volume in the market place is positioned, become difficult areas to cross upwards or downwards. By using this information, traders can identify very s
Weis Wave with Alert MT5
Trade The Volume Waves Single Member P.C.
4.93 (15)
Rental/Lifetime Package Options and Privileges  * For optimum results the yearly or lifetime package is suggested due to live training ! Rent Monthly Six Months   Yearly/Lifetime Weis Wave with Speed with Alert+Speed Index x x x Manual  x x x Quick Set up Video x x x Blog x x x Lifetime Updates x x x Setup and Training Material x x Free Rectangle Break Alert Tool      x Discord Access Channel "The SI traders" x 2-hour live methodology training x How to trade with it:    http://
ИНДИКАТОР, основанный на ИСКУССТВЕННОМ ИНТЕЛЛЕКТЕ, который генерирует возможные записи колл- и пут-опционов для бинарных опционов. Индикатор работает по 3 разным стратегиям: 1) считывая объемы, он посылает сигнал, когда цена должна развернуться 2) через расхождение между ценой и объемом он посылает сигнал, когда тренд должен продолжиться или развернуться. 3) благодаря сближению цены и объема он посылает сигнал о том, что тренд должен продолжиться. Индикатор работает на всех таймфр
Индикатор предназначен для того, чтобы вовремя закрывать позиции по рынку. Например: досрочно фиксировать прибыль, если цена не достигла TakeProfit, а рынок разворачивается. Индикатор анализирует импульс, а не тренд. О тренде никакой информации он не дает. Индикатор хорошо подходит для поиска дивергенции. Индикатор Ershov 38 Parrots динамически подстраивается под рынок и выявляет импульсы движения цены средней и высокой амплитуды. На мелкие скачки цены почти не реагирует.  Принципиальное о
Технический индикатор Smooth Price (Гладкая цена) используется для построения гладкой линии максимально приближенной к цене торгового инструмента и служит для устранения ее шумовых составляющих. Индикатор является частью торговой системы Monarch, но здесь он представлен как самостоятельный инструмент технического анализа. Основой индикатора служит кластерный цифровой фильтр , который, в отличии от проекта ClusterSMA , применяется непосредственно к ценовой таймсерии. Smooth Price не перерисовывае
Классификатор силы тренда. Показания на истории не меняет. Изменяется классификация только незакрытого бара. По идее подобен полной системе ASCTrend, сигнальный модуль которой, точнее его аппроксимация в несколько "урезанном" виде, есть в свободном доступе, а также в терминале как сигнальный индикатор SilverTrend . Точной копией системы ASCTrend не является. Работает на всех инструментах и всех временных диапазонах. Индикатор использует несколько некоррелируемых между собой алгоритмов для класси
Currency Index Watcher - это простой инструмент для тех, кто хочет торговать на рынке Форекс, используя индексы валют . После завершения расчетов показываются конкретные торговые возможности , и подаются сигналы по ним. Currency Index Watcher можно настроить непосредственно с панели управления : Индексы 8 валют: EUR, USD, GBP, JPY, CHF, AUD, CAD, NZD с возможностью выбирать для анализа индексы и синтетические пары. Выбор возможностей осуществляется в соответствии со следующими критериями: Minima
SmartTrendMt5 - индикатор тренда и торговых сигналов, основанный на принципе совмещенного анализа расчетных опорных точек внутри канала Келтнера. Индикатор формирует в отдельном окне канал Келтнера (по умолчанию линии красного цвета и линия синего цвета - середина канала), а также гистограмму расчетных опорных точек для каждой свечи (по умолчанию столбцы гистограммы желтого цвета). Индикатор устанавливается обычным образом на любой торговый символ с любым временным интервалом. Преимущества инд
Forex Relative Performance indicator This indicator calculates the relative strength of major currencies against the US dollar. The basic idea behind this indicator is "to buy strong currency and to sell weak currency". This indicator allows you to quickly identify the best forex pair to trade according to your trading style (Intraday, Scalping, Swing, or Long Term)
Premium level - это уникальный индикатор с точностью правильных прогнозов  более 80%!  Данный индикатор тестировался более двух месяцев лучшими Специалистами в области Трейдинга!  Индикатор авторский такого вы больше не где не найдете!  По скриншотах можете сами увидеть точностью данного инструмента!  1 отлично подходит для торговли бинарными опционами со временем экспирации на 1 свечу. 2 работает на всех валютных парах, акциях, сырье, криптовалютах Инструкция: Как только появляется красная стре
Indicador en base a la pendiente de la linea de precio, dibuja una línea de color cuando sube a base de los precios que previamente has sido procesados o linealizados, y cuando baja la pendiente la linea linealizada toma otro color. En este caso se a considerado 6 lineas de diferentes procesos desde pendientes largas hacia las cortas, observándose que cuando coincidan las pendientes se produce un máximo o mínimo, lo que a simple vista nos permitirá hacer una COMPRA O VENTA.
Индикатор Coefficient Of Determination (COD) представляет собой значение коэффициента детерминации или квадрат коэффициента корреляции между зависимой переменной — ценой и объясняющей переменной — тиковым объемом. Что это дает нам на практике? COD отлично распознает кульминацию трендовых движений, что позволяет подбирать оптимальные точки и ловить развороты рынка. Как использовать индикатор: Наиболее популярная торговая стратегия строится совместно с трендовым индикатором Moving Average (MA), пе
Fibonacci Múltiple 12, utiliza la serie fibonacci plasmado en el indicador fibonacci, aumentadolo 12 veces según su secuencia. El indicador fibonacci normalmente muestra una vez, el presente indicador se mostrara 12 veces empezando el numero que le indique siguiendo la secuencia. Se puede utilizar para ver la tendencia en periodos cortos y largos, de minutos a meses, solo aumentado el numero MULTIPLICA.
Recommended TimeFrame >= H1. 100% Non Repainted at any moment.  Use it carefully, only with Trend Direction. Trading Usage: 2 Variants: as Range System or as BreakOut System (Both Only With Trend Direction)::: (Always use StopLoss for minimise Risk); [1] as Range System: (Recommended) in UP TREND:  - BUY in Blue Line , then if price goes down by 50 points (on H1) open Second BUY.   Close in any Profit you wish: TrailingStop(45 points) or Close when Price touches upper Gold Line. in DOWN TR
En base a cálculos matemáticos de determino una linea Horizontal que cruza a todas las señales de trading, mostrando los máximos y mínimos. La linea horizontal parte en dos las subidas y bajadas de las señales de trading, de tan manera que es fácil identificar los máximos y mínimos, y es inteligente por que es sensible a las subidas y bajadas, afín de no quedarse en un solo lado por siempre, trabaja excelentemente con otros indicadores suavizadores ya que les garantiza que en un intervalo de tie
этот индикатор является индикатором детектора спайков, он специально разработан для обмена на Boom 1000, Boom 500, Crash 1000 и Crash 500 Мы рекомендуем использовать его только для индексов Deriv Boom и Crash. Его настройки интуитивно понятны, знакомы, просты в использовании имеет функции уведомления; звуковые уведомления и push-уведомления. этот инструмент прост в использовании, прост в обращении Это обновление основано на разных стратегиях для шипов.
Limitless MT5  - это универсальный индикатор который подойдет каждому как начинающему так и опытному трейдеру работает на всех валютных парах криптовалютах сыре акциях Limitless MT5 - уже настроен и не требует дополнительной настройки   А теперь главное Почему  Limitless MT5 ? 1 полное отсутствие перерисовки  2 два года тестирования лучшими специалистами в трейдинге 3 точность правильных сигналов превышает 80% 4 хорошо показал себя в торговле во время выхода новостей Правила торговли  1 сигнал н
Indicador en MQL5, recibe la información del precio SUAVIZADO, lo procesa anulando los picos inteligentemente, y el resultado lo envía al desarrollo de la escalera que iniciara y subirá o bajara según el peldaño o INTERVALO ingresado Ingreso PERIODO = 50 (variar segun uso) Ingreso MULTIPLICA AL PERIODO = 1 (variar segun uso) Segun la configuración la escalera puede pegarse o separarse de los precios,, Se aplica toda la linea de tiempo, y a todas las divisas, etc.  
Micro  ******************* Секундные графики MT5 ********************** Более точного инструмента для входа в сделку вы не найдёте. Входные параметры: Timeframe, sek - период построения графика, секунды Displayed bars - отображаемые бары Step of price levels, pp, 0-off - шаг отрисовки ценовых уровней, пункты Scale points per bar, 0-off - масштаб в пунктах на бар Show lines - отображение текущих уровней Show comment - отображение комментария Standard color scheme - стандартная цветовая сх
QuantXMarketScanner is a multi assets indicator for MT5 - Mathematical model based on 7 custom moving averages indicators  - Adaptable on Currencies, Stocks and Crypto - Automatic setup, self optimized About QuantXsystem Products: –         Simple installation & integration into MT5   –         Unlimited License after purchase (for one user) –         Automatic pattern recognition to identify the best timing and price levels. –         Trading indicators are displayed directly and automatica
QuantXSTocks Trading Range Indicator for MT5: INSTRUCTIONS TO USE OUR INDICATOR:- User needs to take trade on Arrow or after an Arrow CandleStick, You can achieve up-to 35-125 pips target by this Indicator. Best Timeframes for Stocks and Indices are M30 and H1: AMAZON M30 (50 pips) TESLA M30 (50 pips) APPLE M30 (50 pips) ADOBE M30 (50 pips) NASDAQ100 H1 (125 pips) The above are the approximate amount of pips you can achieve by this Indicator, Green arrow appears to be buy arrow while the Red a
Super Suavizador
Cesar Juan Flores Navarro
Indicador en MQL5 que obtiene el promedio de 10 EMAS que son alineadas y procesadas según Fibonacci luego el promedio es suavizado"  Se ingresa un número de 2 a N que multiplica los EMA-Fibonacci y por consiguiente aumenta los fibonacci, resultando un promedio.   Se ingresa un número que suaviza los EMA-Fibonacci. Considerando los números 1/1 seria la suavización minima. Considerando los números 3/5 seria la suavización media. Considerando los números 10/30 seria la suavización alta.....etc
Trend and Signals MT5  indicator scans  30 trading Instruments (Forex, Metals and Indices).     It uses special algorithm on the  current market   based on   Pure Price Action   and display the overall trend and signal on the dashboard. When signals are produced the indicator sends alert and notification. Strategy for Signals This indicator uses the daily timeframe to determine the direction of the trend. The hourly timeframe is used to identify possible entries. Main trend and is determined by
Другие продукты этого автора
Вам будет проще торговать, предоставляя графики трендов во всех кадрах снизу вверх. Если он касается восходящего тренда, это хорошая возможность для продажи, а целью является нисходящий тренд, и наоборот, если он касается нисходящего тренда, это хорошая возможность для покупки, а целью является восходящий тренд. Он может автоматически перерисовывать тренд. Вы можете отслеживать более высокие фреймы и торговать на более низких фреймах для спекуляций.   
Фильтр:
Нет отзывов
Ответ на отзыв