Смотри обучающее видео по маркету на YouTube
Как купить торгового робота или индикатор
Запусти робота на
виртуальном хостинге
виртуальном хостинге
Протестируй индикатор/робота перед покупкой
Хочешь зарабатывать в Маркете?
Как подать продукт, чтобы его покупали
Торговые роботы и индикаторы для MetaTrader 5 - 43

Full Automated Trading panel . it works on any trading instruments: Forex, Stocks, Futures, Indices, CFD, Bonds, Cryptocurrencies; interface minimization function; flexibility of use;
Join my channel and check video of it ===> https://t.me/Ash_TheTrader/4986
Features :
Auto SL and TP Auto Close partial Auto Trailing Session Time Alert Time of trading Alert Profit and Percentage and etc.
FREE

A Unique Neural Network Model This project is a significant endeavor that uses an Expert Advisor (EA) to pinpoint the best times to enter and exit trades. This EA is unique because it uses a dataset trained by a neural network, rather than relying on traditional indicators to generate signals. The training data is specifically tailored to three Forex pairs, and it’s not recommended to apply it to other pairs. This decision was made due to the substantial memory space needed after training. The
FREE

This indicator displays breakouts on Point-And-Figure-like or Kagi-like custom symbol charts, generated by special expert advisers, such as PointFigureKagiCharts . This indicator is applicable only for custom instruments generated in appropriate way (with time-invariant bars which are multiples of a predefined box size). It makes no sense to apply it to other charts. The breakouts in up or down direction are marked by arrows. The breakout price is found at crossing of one of imaginary lines of
FREE

The Moving Averages On-Off let you control the indicator using the keyboard or a button . You can choose if you want the indicator always shown or always hided while switching among different time frames or financial instruments . ---> This indicator is part of Combo Indicator OnOff
It's possible to setup three Moving Averages : Short , Medium , Long
Input You can customize the price type used for calculation : close, open, high, low, median price, typical price, weighted It
FREE

Media Móvel Grátis para uso em conjunto ao Diamond Indicator Atenção. Essa é a mm para conjugar ao indicador. Esse não é o indicador. Comprem o indicador que está tendo ótimos resultados. A seguir informações sobre o indicador: Indicador Para Opções Binarias. Usa dois gales. Instalar em mt5 Esse indicador é para ser usado no tempo de vela de 5 minutos e em M5. Este também funciona em M1, porém é mais eficiente em M5. Só descompactar e copiar os arquivos na pasta de dados do seu MT5. Arquivos
FREE
This indicator allows to hide ZigZag indicator (on all MT4 timeframes) from a date define by the user with the vertical line. This indicator can be use with other "Hidden Indicators". Indicator Inputs: Depth Deviation Backstep Information on "ZigZag" indicator is available here: https://www.mql5.com/en/articles/1537 ************************************************************* Hey traders!! Give me your feeds! We are a community here and we have the same objective.... make some money from th
FREE

Об эксперте Order Risk Management Эксперт ORM разработан специально для быстрого и точного исполнения ордеров. Он предназначен для использования с нашими перечисленными ниже стратегиями Ценового действия и Эконометрической торговли. Эксперт ORM полностью автоматизирован и прост в применении. Эксперт ORM абсолютно бесплатный. Такой способ исполнения ордеров экспертом ORM подходит для любой иной торговой стратегии. Harmonic Pattern Plus MT5 Harmonic Pattern Scenario Planner MT5 Price breakout Patt
FREE
Тот же индикатор, размещённый здесь https://www.mql5.com/ru/market/product/105089?source=Site+Market+My+Products+Page , но с возможностью выбора таймфрейма. Удобно для отображения картины с разных периодов на одном графике. При использовании нескольких таймфреймов рекомендуется (А.Элдер "Как играть и выигрывать на бирже в XXI веке") придерживаться коэффициента 5 или 6. То есть два старших тайфрейма для 5-минутного графика будут 30 минут и 3 часа.
FREE

This indicator will draw two lines to represent the adjustment value, which can be used in both the Dollar and the Index.
The main advantage of this indicator is that it has two lines, one representing the adjustment calculated from the previous day and the other representing the adjustment calculated on the current day. The calculation of the adjustment on the current day is a great differential, since it will be possible to make operations in order to sleep bought or sold according to the a
FREE

Новое предупреждение о свечах, предупреждение появляется в соответствии с временным периодом, на котором оно размещено. Индикатор работает на любом активе, предупреждение может быть отключено в любое время, без необходимости удаления индикатора с графика. Это отлично подходит для тех, кто не может постоянно следить за графиком. Крепкие объятия !! Novoye preduprezhdeniye o svechakh, preduprezhdeniye poyavlyayetsya v sootvetstvii s vremennym periodom, na kotorom ono razmeshcheno. Indikator rabot
FREE

Введение в алгоритм GARCH Improved Nelder Mead GARCH - это сокращение от Generalized Autoregressive Conditional Heteroskedasticity (Обобщенная авторегрессионная условная гетероскедастичность). Представляет собой модель прогнозирования волатильности, обычно применяемую в финансовой сфере. Модель GARCH впервые появилась в работе датского экономиста Тима Петера Боллерслева (Tim Peter Bollerslev) в 1986 году. Лауреат Нобелевской премии 2003 года Роберт Ф. Энгл внес огромный вклад в усовершенствовани
FREE
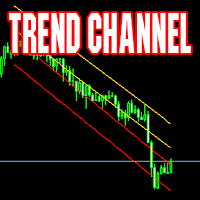
Индикатор каналов. Рассчитывается динамически. Подходит как для работы в направлении тренда, так и внутрь канала. Отличные результаты при работе на таймфреймах от 4Н по направлению в центр канала. Support: https://www.mql5.com/en/channels/TrendHunter Пример использования: при касании цены одной из крайних линий - открытие сделки в центр канала с тейк-профитом на ближайшей средней линии индикатора. Версия для МT4 Индикатор можно использовать в советниках (4 буфера), получая данные стандартным с
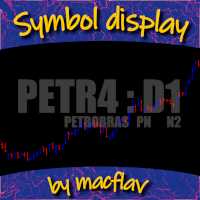
Add a watermark in the background of your charts, containing the Stock Symbol followed by the current Timeframe, and the Symbol Description below it.
Have you ever seen videos or screenshots of other platforms, boasting those great looking watermarks, and wondered why your MetaTrader5 doesn't have one? Well, I did... so I tried the very few options available in the Market at the time, but I still wanted to tweak everything exactly to my taste. So I developed my own solution, and now I am proud
FREE

Developed by Charles Le Beau and featured in Alexander Elder's books, the Chandelier Exit sets a trailing stop-loss based on the Average True Range (ATR). The indicator is designed to keep traders in a trend and prevent an early exit as long as the trend extends. Typically, the Chandelier Exit will be above prices during a downtrend and below prices during an uptrend.
Calculation
The original Chandelier Exit formula consists of three parts: a period high or period low, the Average True
FREE

Этот мощный инструмент предназначен для того, чтобы помочь трейдерам идентифицировать на своих графиках ключевые модели разворота, в том числе фигуры «молот» и «звезда».
С помощью этого индикатора вы можете быстро и легко обнаруживать эти модели по мере их формирования, что позволяет вам совершать хорошо информированные сделки и потенциально увеличивать свою прибыль.
Индикатор Hammer Start настраивается, что позволяет вам устанавливать собственные параметры для выявления паттернов и предупр
FREE
The Tick Flow Meter, also known as Tick Density Meter or Tick Counter, is an innovative indicator designed to provide deep insights into market dynamics down to the second.
It is a cutting-edge indicator crafted to measure the intensity and frequency of ticks within specific time intervals. By focusing on tick flow, this indicator offers traders a unique perspective on market liquidity, momentum, and volatility, empowering them to make informed trading decisions.
Key Features: Granular Tim
FREE

The SSD With Histogram is a custom forex indicator for Metatrader 5 that shows a slow stochastic line, a signal line, and a histogram that reflects the difference between the slow line and the signal line. The indicator and its elements are displayed in a separate window just below your main trading chart.
parameters: k period; 5 D period; 3 time frame: m1 m5 m15 m30 h1 d1
FREE

The Market Thermometer can be used to help traders identify sleepy or turbulent periods.
It helps beginners to check when is the ideal time to enter operations, that is, when the value of the thermometer is below its average for several periods, identifying a peaceful market. When the market is heated, that is, the thermometer is above three times its average, it is time to make profits. The Thermometer measures the extent to which the end of a period, maximum or minimum price, projects outsi
FREE

The value of the MMCCI indicator is calculated based on the "Minors" and "Majors" currency pairs and is based on the original CCI algorithm. This gives us a more accurate result than if we only observed the value of the current currency pair. You can request alerts when the CCI value crosses or returns from the specified level or crosses zero. All settings can be saved in a template. Setting options:
Basic signals that can be enabled separately for the current and the previous candle: Overbou
FREE

NOW FREE!! It's crucial to note that, like any trading tool, ForexClimber EA doesn't guarantee profits. Forex trading carries risks, and market volatility means success is never certain. The pricing of ForexClimber EA is dynamic, and as it gains popularity, the cost for renting or buying may increase. Invest now to secure your place in Forex trading advancement. Seize the opportunity, navigate the markets, and let ForexClimber EA support your Forex trading aspirations.
FREE

Трейдинг сложен, особенно дейтрейдинг. Основное назначение этой программы - не дать пользователю проиграть свой счёт. Главное - НЕ ОТКЛЮЧАЙТЕ её. Она не даст вам открыть ненормально большую позицию, не даст торговать слишком часто. Не отключать программу вам скорее всего будет трудно, особенно если вы новичок. Если вы проигрываете, вам будет хотеться открыть позицию побольше, вам будет хотеться развернуться в обратном направлении, боясь, что рынок уйдёт без вас и не даст возможности отыграться.
FREE

Индикатор Fractals Direction ST Patterns MT5 является модификацией индикатора Fractals Билла Вильямса и позволяет задавать любое количество баров для нахождения фрактала. Также в настройках имеется возможность устанавливать количество пунктов для определения направления тренда. Направление вверх определяется если последний верхний фрактал выше чем предпоследний верхний фрактал. Направление вниз определяется если последний нижний фрактал ниже чем предпоследний нижний фрактал. Этот простой индикат
FREE

Скользящая средняя Т3 Тиллсона была представлена миру технического анализа в статье «Лучшая скользящая средняя», опубликованной в американском журнале Technical Analysis of Stock Commodities. Разработанный Тимом Тиллсоном, аналитики и трейдеры фьючерсных рынков вскоре увлеклись этой техникой, которая сглаживает ценовой ряд, уменьшая при этом лаг (лаг), типичный для систем следования за трендом.
FREE

Overview
The Volume SuperTrend AI is an advanced technical indicator used to predict trends in price movements by utilizing a combination of traditional SuperTrend calculation and AI techniques, particularly the k-nearest neighbors (KNN) algorithm.
The Volume SuperTrend AI is designed to provide traders with insights into potential market trends, using both volume-weighted moving averages (VWMA) and the k-nearest neighbors (KNN) algorithm. By combining these approaches, the indicat

Советник разработан по стратегии «2TF» для EURUSD и GBPUSD. Используемые индикаторы: ЕМА(5), ЕМА(10), ADX(28), MACD(5; 10; 4). Правила на покупку
ЕМА(Быстрая) пересекла ЕМА(Медленная) снизу вверх. ADX +DI (синий) выше –DI (красный). MACD выше нуля. Правила на продажу
ЕМА(Быстрая) пересекла ЕМА(Медленная) сверху вниз. ADX +DI (синий) ниже –DI (красный). MACD ниже нуля. В параметрах советника можно менять различные настройки стратегии, периоды индикаторов, размер и способы установки стоплосса,
FREE
Данная панель из разряда: "Все в одном". Возможность контролировать одновременно: до 3-х символов; до 6-ти периодов; до 31-ти популярных сигналов. Возможность смотреть сумму по всем сигналам с учетом веса сигнала Версия для MetaTrader 4: https://www.mql5.com/ru/market/product/27880 Версия для MetaTrader 5: https://www.mql5.com/ru/market/product/27830
Параметры NUM_BAR - номер бара на котором происходит работа (для работы только по закрытым барам параметр > 0). timeframe_1....timeframe_6 - пара
FREE
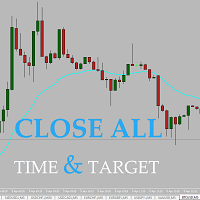
Easy and simple tool which close all trades in defined point of time. It can also close all open trades when opened positions reach defined target profit or stop loss.
For all pairs, indexes etc. Works with all instruments.
All types of orders. All charts.
Users inputs:
- close time (hour,min,sec)
- take profit (in users currency)
- stop loss (in users currency)
Save & Load settings option.
Fast, simple and reliable.
Check out other tools provided by our team!
FREE
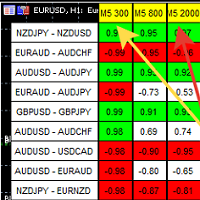
Скрипт показывающий корреляцию сразу по трем выбранным зонам (ТФ-бар) В параметрах выбираем 3 варианта На экран данные выводятся отсортированные по первой зоне Скрипт так же создает файл в который записывает все данные без сортировки.
Таким образом можно расширить число зон до любого числа и проводить анализ в exsel В параметрах скрипта задаются 3 зоны
TF_Trade1 =PERIOD_M5; BarsCor1 = 300; TF_Trade2 =PERIOD_M5; BarsCor2 = 800; TF_Trade3 =PERIOD_M5; BarsCor3 = 2000; K = 0.8;//
FREE

Média Móvel que possui todos tipos de Cálculo comum: Simples Exponencial Suavizada Ponderada Conta com suporte para aplicação sob outros indicadores!
Seu principal diferencial é o esquema de cores em GRADIENTE que, de acordo com a mudança no ângulo da média, altera suas cores conforme demonstrado nas imagens abaixo. Com isso, espera-se que o usuário tenha uma percepção mais suavizada das pequenas alterações.
Bons trades!!
FREE

Tick imbalance bars (TIB), described in the book Advances in Financial Machine Learning (2018) by Marcos López de Prado. Indicator that show candlestick bars with an different sampling method than time fixed. Real time data is sourced to the indicator and it may be used as substitute of the default graph. Each bar is formed when a predefined tick balance is exceeded, showing in the graph the OHLC of this cluster of ticks. The input variable is the amount of ticks of each bar. The indicator may
FREE

Timeframe-correlation signal generating with Higher than 95% of accuracy
This scanner shows the trend values of the TrendBand indicator for up to 20 instruments and H4,H1,M15,M5 and M1 time frames. The scanner collects the trend signals of every timeframes (H4,H1,M15,M5,M1) from TrendBand indicator and also, generates daily signal under the considerations of like correlations of each timeframes,ATM rule and Fibonacci levels. Installation Note Before opening this indicator, the TrendBan
FREE

Blended Candle Strength (BCS)
Any trading strategy, whether it is a continuation, trend reversal or breakout requires, in addition to analyzing the context of the price movement, confirmation signals for both trading entry and exit. And for that, it is necessary to analyze the formats of the candlesticks and fit them in known patterns to assist decision making. In addition to the context and format, two other important information to determine the strength of candlesticks are the size of the ba
FREE

Switch Tray is a shortcut tray tool for commonly used trading pairs provided to traders. It can be placed at the bottom of the chart, and commonly used trading pairs can be set by themselves. 1. You can set the shortcut switch button for your commonly used trading pairs. The default is [EURUSD/GBPUSD/XAUUSD/USDJPY/USDCHF/USDCNH]. / slash is the separator. 2. The button of each trading pair is also equipped with the number of open positions of a certain trading pair. 3. Multi-cycle quick switchi
FREE

Volume Calculator
This indicator shows the volume to be used in an operation based on the maximum acceptable stop value and the size of the stop. That way you will not use a calculator to calculate the volume you are going to use every time. This indicator makes your life much easier and faster. Suitable for any type of trader: Scalper, DayTrader, SwingTrader.
FREE

The VWAP Level indicator is a technical analysis tool that calculates the weighted average price for the traded volumes of a specific asset. The VWAP provides traders and investors with the average price of an asset over a specific time frame.
It is commonly used by investors to compare data on "passive" trading operations, such as pension funds and mutual funds, but also by traders who want to check if an asset has been bought or sold at a good market price.
To calculate the VWAP level we
FREE

An EA to export trading history for FXer - Journaling and Analytics. Register Create an API token Put EA on any chart (any TF is fine) Fill in the API token Follow analytics for better trading !!! Currently in beta-testing !!! At FXer, our mission is clear: to empower traders like you with the tools needed to excel in the ever-changing world of trading. We are committed to providing top-tier, data-driven market analysis and trading intelligence, ensuring you can make well-informed decisions, man
FREE

1. Development background Forex is a ratio, different from futures and the stocks. For example, if EURUSD has risen, it may be that EUR is falling and USDX has fallen even more. I believe everyone knows that the US dollar index is an essential reference index in forex analysis . In MT5 client, it is very valuable to see the US dollar index. Similarly, if you can see the index of other forex in the MT5 client, which is very valuable for trading. Because the US dollar index is very authoritat

Индикатор рисует нормальный график, раскрашивая его в цвета, основанные на ценах, вычисленных по алгоритму индикатора Heiken Ashi. То есть, форма свечей не меняется. По сути, это тот же Heiken Ashi, который не искажает ценовой график.
Дальше будет рисунок кота, потому что больше об индикаторе писать нечего.
.
FREE

Points of Inertia - мощный инструмент обнаружения критических точек ценового движения, основанный на идеи вычисления инерции ценовых колебаний. _________________________________ Как пользоваться сигналами индикатора: Индикатор формирует сигнал после появления нового ценового бара. Использовать сформированный сигнал рекомендуется после пробития ценой критической точки в указанном направлении. Индикатор не перерисовывает свои сигналы. _________________________________ Параметры индикатора предла
FREE

Советник основанный на сигналах индикатора Stochastic в зоне перекупленности - продаем, в зоне перепроданности - покупаем. Версия для МТ4 https://www.mql5.com/ru/market/product/62952 Если советник используется в режиме 5/24 на VPS, я рекомендую использовать данный эксперт в консервативном режиме, ограничивая количество ордеров в сетке с помощью параметра " Count_Orders_Max_Grid " . По бесплатным экспертам, справок и сетов не даю. Они потому и бесплатные)) Оптимизация и прочие прелести ложатс
FREE

TransitGhost Signal indicator, this is one of my best forex trading strategy. The strategy is based on the simple moving average cross, 5 SMA AND 200 SMA of which take a longer time to cross. Whenever the is a cross between the 5 SMA and 200 SMA a signal will be given, when the 5 SMA cross the 200 SMA to the upside ,a buying arrow will appear on chart, and push notification(alert) "Buy now, use proper risk management" will be sent on both the MT5 PC and mobile app, and when the 5 SMA cross the 2
FREE

Индикатор работает на основании показателей встроенных стандартных индикаторов, показатели индикатора учитывают текущие показатели 30 стандартных индикаторов и дают сигнал на покупку или продажу, из общей тенденции всех направлений других индикаторов. Во входных параметрах можно настроить особые параметры для каждого индикатора. индикатор исполнение в виде осциллятора и показывает общую тенденцию и перевес всех индикаторов одного и другого направления. https://youtu.be/UG2ZZEH9B_U
Параметры
FREE
Удобное средство для измерения расстояния между ценами в пунктах непосредственно на графике. Отображает измерения между точками в процентах, пунктах (финансовых) и времени (барах). Совместим со всеми графическими таймфреймами. При фиксировании на графике отображается во всех таймфреймах. Нажмите Ctrl, нажмите на первую точек, переместите указатель мыши, и утилита отобразит измерения. Нажмите еще раз и зафиксируйте. Очень быстрый инструмент, который не занимает много места. Разработанная для браз
FREE

Media Band é um indicador que projeta 8 bandas paralelas a uma media movel de referencia. Podendo auxiliar na visualização da volatilidade do mercado financeiro. Este indicador foi inspirado na necessidade de avaliar melhor uma boa oportunidade de compra e venda dos ativos de acordo com o "seu" operacional. Não pode ser utilizado como recomendação e sim a fins de estudos do Mercado Financeiro.
FREE

The Market Thermometer can be used to help traders identify sleepy or turbulent periods. It helps beginners to check when is the ideal time to enter operations, that is, when the value of the thermometer is below its average for several periods, identifying a peaceful market. When the market is heated, that is, the thermometer is above three times its average, it is time to make profits. The Thermometer measures the extent to which the end of a period, maximum or minimum price, projects out
FREE

Necessary for traders: tools and indicators Waves automatically calculate indicators, channel trend trading Perfect trend-wave automatic calculation channel calculation , MT4 Perfect trend-wave automatic calculation channel calculation , MT5 Local Trading copying Easy And Fast Copy , MT4 Easy And Fast Copy , MT5 Local Trading copying For DEMO Easy And Fast Copy , MT4 DEMO Easy And Fast Copy , MT5 DEMO
Can set the cycle for other varieties of K line graph covered this window, fluctuations obse
FREE

Traders Toolbox Premium - это универсальный инструмент создан на основе обширного обучения общим торговым стратегиям с целью автоматизации этих стратегий и расчетов. Функции: 19 отдельных сигналов - Каждый из этих сигналов , которые смещены в нейронной сети конфигурации стиля , чтобы составить окончательный / общий результат. Каждый сигнал имеет свои собственные настройки, которые при необходимости можно настроить или оптимизировать. Всестороннее On экран Дисплей

Highly configurable Awesome Oscillator (AO) indicator. Features: Highly customizable alert functions (at levels, crosses, direction changes via email, push, sound, popup) Multi timeframe ability Color customization (at levels, crosses, direction changes) Linear interpolation and histogram mode options Works on strategy tester in multi timeframe mode (at weekend without ticks also) Adjustable Levels Parameters:
AO Timeframe: You can set the current or a higher timeframes for AO. AO Bar Shift:
FREE

The volatility scanner indicator is a tool that helps traders identify and analyze volatility in all the market timeframes for the current chart. This way you can find potentially profitable trades on every timeframe for the current symbol.
What It Does? Scan all timeframes to find a volatility contraction. Color the button yellow if there is a volatility squeeze at that timeframe. Clicking on the button instantly changes timeframe.
How To Use It? Just put it on the chart and click on the y
FREE

Это простая и очень эффективная утилита для закрытия ордеров одним кликом. Необходима если на вашем балансе имеется достаточно большое кол-во открытых ордеров, закрытие которых в ручном режиме может занять достаточно времени и привести к дополнительной потере денег на счете. Утилита состоит из внешней панели с двумя кнопками Close by Filter и Close ALL, которую удобно перемещать по графику Вы можете настраивать утилиту Close ALL таким образом, чтобы ордера закрывались при достижении указанного п

This indicator allows us to identify unusual volatility conditions.
If the ATR line is below the middle bollinger line, volatility is assumed to be below average. If the ATR line is above the middle bollinger line, volatility is assumed to be above average.
If the ATR line breaks the upper bollinger band, volatility is assumed to be high. If the ATR line breaks the lower bollinger band, volatility is assumed to be low.
FREE
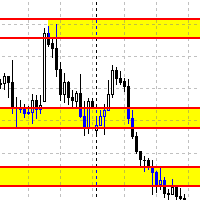
Данный советник автоматически переносит SL в зону безубытка, и по мере увеличения текущей прибыли переносит SL все выше. В отличие от стандартного трейлингстопа, этот автоматически работает со всеми открытыми позициями, которые открыты у текущего символа. Так же если выставлен флаг автоматически выставлять SL, то в случае пустого SL, автоматически выставит его.
FREE

The Bolliger Bands On-Off let you control the indicator using the keyboard or a button . You can choose if you want the indicator always shown or always hided while switching among different time frames or financial instruments . ---> This indicator is part of Combo Indicator OnOff
The Bollinger Bands identify the degree of real-time volatility for a financial instruments . A lower amplitude corresponds to a low volatility, conversely a greater bandwidth corresponds to high volatility
FREE

Cryo использует в своей основе процесс выявления скорости изменения роста цены и позволяет найти точки входа и выхода с рынка. Фундаментальный технический индикатор,который позволяет дать оценку текущей рыночной ситуации,чтобы в войти в рынок выбранной валютной пары в тренд и с минимальным риском.
Индикатор Cryo был создан на основе оригинальных индикаторов поиска экстремумов, индикатор хорошо подходит для определения разворота или большого резкого рывка в одну из сторон благодаря ему вы буде

Советник торгует на основе разработанного индикатора, который позволяет определять правильные точки входа, когда цена продолжает однонаправленное движение. Большой опыт в торговле позволил правильно составить робота по личной стратегии, которая обожает работу с волатильным рынком. Поэтому система не боится новостей и работает круглосуточно.
Как все скальперы роботу желательно работать с небольшими спреда. Данный робот прошел много проверок временем. А с приходом криптоинструментов стал еще п

Do you like trade Technical Analysis like I do? Then you will like this indicator, because it automatically calculates the support and resistance of the asset in simultaneous timeframes, or the famous MTF (Multi Time Frame). In addition to support and resistance, it is possible to have alert signals when the price breaks or touches (or both). Its configuration is very simple. The visual is fully configurable. Enjoy it!

This is the famous Sunflower indicator for Metatrader5. This indicator marks possible tops and bottoms on price charts. The indicator identifies tops and bottoms in the asset's price history, keep in mind that the current sunflower of the last candle repaints, as it is not possible to identify a top until the market reverses and it is also not possible to identify a bottom without the market stop falling and start rising. If you are looking for a professional programmer for Metatrader5, please

Indicator that show candlestick bars with an different sampling method than time fixed. Real time data is sourced to the indicator and it may be used as substitute of the default graph. Each bar is formed when a predefined volume of assets was dealt, showing in the graph the OHLC of this clustering. The amount of bars is proportional to the amount of negotiations instead of a sample in a fixed amount of time. If the broker doesn't show the real volume of the trades, this indicator won't work. Th
FREE

Golden Tea Time MT5
is based on a classic, popular breakout strategy and does not use martingale or grid mechanisms. Golden Tea Time MT5 only opens a pair of stop orders every day at leisurely English tea time, after possible market-moving news has already faded away. Once an order becomes a market order, the remaining stop order is deleted. However, the risk of a losing trade cannot be ruled out and is then limited to just $5/0.01 lot. In this case, the following day's trading can be assigned

This indicator will draw a label above or below each candle based on Rob Smith's The Strat as they develop over time on your chart.
As price evolves, a candle can switch between three states. When the candle first opens, if it sits completely within the previous candles high and low, then it will start as a Type 1. As time moves on, if it breaks either the high or low of the previous candle, it will be come a type 2, and should the price action be volatile and directionless, it may then

Dear Traders, Welcome to the FG Pro expert advisor. This EA offers a high level of customisation with 12 different strategies which can be used either alone or by stacking compatible strategies together. Strategies are based on a number of indicators some which are customised for FG Pro. The FG Pro expert allows to use a grid type method using the various strategies which can either mirror or use a different strategy to the initial open trade, Without bias or concentration to a particular strate
This is a simple utility which will put automatic Stop Loss and Take Profit on all your open trades based on ATR indicator values. Whenever you open a trade, it will put ATR times Stop Loss and Take Profit automatically. Stop loss and take profit are two important tools used by traders to manage risk and set profit targets in financial markets. The Average True Range (ATR) indicator can be a valuable tool in helping traders determine appropriate levels for these orders. Here's an explanation of

it depends on channels and moving average in sketching the chart in two colors the default colors are gold and light blue to highlight the area of downtrend and the area of uptrend TO ADJUST THE INDICATOR YOU CAN CHNGE THE FOLLOWING: 1- the look back period which affects the length of the moving average 2- the multiplier which affects the point of swing in the trend 3- the channel shift which affects how close the line is moving to the price the default settings are the best for the indicator B

Teniendo una entrada de precios suavizados, los cuales son procesador por un ZigZag en tiempo real, dando como resultado un suavizador ajustado a un ZigZag. Con valores de entrada (periodo) mayores se vuelve un poco lenta en M1,, Ideal para H1, H4, D1 Trabaja bien con otros suavizadores, ya que su intersección es ideal Al iniciar empiza con mayor precisión desde el momento de activación, siendo el historial (anterior) de referencia ----------------------------------------------------------------
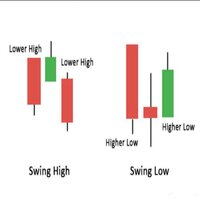
This indicator plots any and every swing high or swing low on your chart.
A swing high or low candle formation comprises of a minimum of 3 candles whereby the middle candles high/low is the highest or lowest point amongst the three candles. The direction (bullish/bearish) of the middle candle is irrelevant. Swings are very useful patterns that can be used to determine market structure as well as potential price reversal points on a chart.
This indicator is derived from the Bill Williams Frac

This EA is there to take your trade closing stress away. Quickly close as many trades as you have opened at the click of a button, INCLUDING PENDING ORDERS. This works on the MT5 platform whether it be currencies, Indices, stocks or Deriv synthetic indices. I have saved it under utilities as it is a utility, however, to install this, you have to save the file in you "EA" folder. That is; Go to "File", then "Open Data Folder", "MQL5" and then "Experts". Paste this file there. Restart MT5 and you'

Average Cost Price helps you keep track of your open positions on the chart. In doing so, it provides lines and explanations on the chart. This line is the average price value of Buy or Sell. If you wish, you can see the average cost price by adding SWAP and COMMISSIONS to the average price value. With MAGIC NO you can differentiate position costs on the same symbol. Average Cost The description below the price line gives you: * Average Buy or Sell price, * PIPS difference between average price

The market price usually falls between the borders of the channel .
If the price is out of range , it is a trading signal or trading opportunity .
Basically , Fit Channel can be used to help determine overbought and oversold conditions in the market. When the market price is close to the upper limit, the market is considered overbought (sell zone). Conversely, when the market price is close to the bottom range, the market is considered oversold (buy zone).
However, the research can b

The Multitimeframe-Candles (MCandles) - Indicator for MT5 shows the contour of an higher, free selectable, timeframe as an overlay on the current timeframe. You can freely choose the timeframe, number of candles and color of the overlays. The indicator only calculates the current candle frequently, so it saves computing capacities. If you like the indicator, please left a comment.

O Indicador CoioteChart foi construído pra facilitar desde a leitura de contexto de mercado até a micro estrutura do candle, facilitando ajustes operacionais e tomadas e decisão com alta eficácia.
Possui um controle para habilitar e desabilitar a visualização das pocs, vwap, zonas de máxima e mínima negociação, pode ser utilizado data sources de tempos gráficos para cálculos ou utilizado os ticks de agressão do time and trades, funciona com volume real e volume de ticks.
As colorações são at
MetaTrader Маркет - единственный магазин, где можно скачать демоверсию торгового робота и подвергнуть его проверке и даже оптимизации на исторических данных.
Прочитайте описание и отзывы других покупателей на заинтересовавший вас продукт, скачайте его прямо в терминал и узнайте, как протестировать торгового робота перед покупкой. Только у нас вы можете получить представление о программе, не заплатив за неё.
Вы упускаете торговые возможности:
- Бесплатные приложения для трейдинга
- 8 000+ сигналов для копирования
- Экономические новости для анализа финансовых рынков
Регистрация
Вход
Если у вас нет учетной записи, зарегистрируйтесь
Для авторизации и пользования сайтом MQL5.com необходимо разрешить использование файлов Сookie.
Пожалуйста, включите в вашем браузере данную настройку, иначе вы не сможете авторизоваться.