Смотри обучающее видео по маркету на YouTube
Как купить торгового робота или индикатор
Запусти робота на
виртуальном хостинге
виртуальном хостинге
Протестируй индикатор/робота перед покупкой
Хочешь зарабатывать в Маркете?
Как подать продукт, чтобы его покупали
Бесплатные торговые роботы и индикаторы для MetaTrader 5 - 17

Советник разработан по стратегии «2TF» для EURUSD и GBPUSD. Используемые индикаторы: ЕМА(5), ЕМА(10), ADX(28), MACD(5; 10; 4). Правила на покупку
ЕМА(Быстрая) пересекла ЕМА(Медленная) снизу вверх. ADX +DI (синий) выше –DI (красный). MACD выше нуля. Правила на продажу
ЕМА(Быстрая) пересекла ЕМА(Медленная) сверху вниз. ADX +DI (синий) ниже –DI (красный). MACD ниже нуля. В параметрах советника можно менять различные настройки стратегии, периоды индикаторов, размер и способы установки стоплосса,
FREE

С помощью советника FNG вы сможете разрабатывать стратегии, которые наилучшим образом соответствуют вам и вашему стилю торговли. Большинство наших стратегий не используют функцию мартингейла, но опция всегда есть, если это ваш предпочтительный метод.
Индикаторы фильтра: Конверты, МЕДВЕДЬ/Бык, Скользящая средняя, Процентный диапазон Уильямса и ATR
Фильтр новостей - закрывайте сделки до новостей и прекращайте торговлю до новостей
Трейлинг-стоп
Дополнительный Мартингейл
Скрытый TP/SL
FREE

Индикатор рисует уровни по значениям перекупленности и перепроданности индикатора RSI. В расчет берутся максимальные значения, которые равны или вышли за определенные границы.
То есть, например, когда цена ушла в зону прекупленности, из всех цен в этой зоне выбирается максимальная на этом отрезке времени, и как только значение индикатора вернулось к значению ниже значения перекупленности, уровень фиксируется и начинается расчет новых значений. Тоже самое и для значений перепроданности. Есть нас
FREE

Monte Carlo simulation is an Indicator that uses a Monte Carlo model to calculate the probability of the price going up or down. If the price has a probability of going up or down more than 90%, the system will enter a trade by doing a back test of gold assets. It was found that it was able to generate a return of more than 20% in a period of 5 months while having a MAX DD of less than 7%.
What is a Monte Carlo simulation?
A Monte Carlo simulation is a model used to predict the probability o
FREE

Этот инструмент добавляет исходную шкалу времени с заданной или автоматически рассчитанной разницей во времени в нижней части диаграммы.
С помощью этого удобного инструмента вы можете улучшить читаемость диаграммы и уменьшить умственное напряжение, отображая ее в формате времени, знакомом вам или вашей стране.
Даже если вам не нужно вычислять разницу во времени, простая замена шкалы времени по умолчанию на Local_Time может улучшить читаемость диаграммы.
Local_Time поддерживает различные
FREE

FRB Times and Trades Free
- Times and Trades, também chamado de Time and Sales ou histórico de negócios, é uma ferramenta essencial para quem opera através do Tape Reading (Fluxo). - O Metatrader 5 não informa os dados das corretoras, sendo assim, impossível diferenciar quem enviou a ordem. - Os dados só podem ser usados por corretoras que informam os dados dos volumes de negociação, como a B3. No mercado forex não é possível usar. VERSÃO PRO : https://www.mql5.com/pt/market/product/93726
FREE

Scientific Calculator is a script designed to compute expressions of science, engineering and mathematics. General Description The expression to calculate must obey syntax rules and precedence order, being constituted by the following elements: Integer and real numbers. Mathematical operators for addition (+), subtraction (-), multiplication (*), division (/) and exponentiation (^). Mathematical and trigonometric functions . Curved parentheses (()) to define the precedence and contain t
FREE

Индикатор Moving Average Slope (MAS) вычитает уровень скользящей средней n периодов назад из текущего уровня скользящей средней. Это позволяет отображать тренд скользящей средней на линии скользящей средней.
Особенности Позволяет одним взглядом определить растущий и падающий тренд. Индикатор не перерисовывается. Возвращает значения буферов с трендом скользящей средней для использования в составе советника. (См. ниже)
Входные параметры Moving Average Period : период скользящей средней. Slope
FREE

Adiciona marca d'água com nome do ativo em negociação. Pode ser ajustado definindo tamanho da fonte e coloração do texto. Testado com vários ativos do mercado B3 e Forex Adione ao gráfico e configure de acordo com a necessidade. Caso tenha problemas sinta-se a-vontade para nos avisar e providenciaremos a correção logo que possível. ______________________________
FREE

Добро пожаловать в индикатор Provlepsis
"Provlepsis" - это высокоуровневый индикатор, разработанный для рынка MQL. Анализируя предыдущие бары в тот же самый час дня, он точно рассчитывает потенциальный диапазон движения рынка, предоставляя ценную информацию о будущих колебаниях цен. В отличие от традиционного индикатора ATR, "Provlepsis" учитывает фактор времени, что делает его более мощным инструментом, адаптирующимся к различным рыночным условиям. В ночное время индикатор предсказывает более
FREE

Hey Trader!
Boring with the Meta chart? Do you want to move it as you do in Profit?
Your problems are over! Now available Chart Panoramic or ChartPan for closer friends, a utility that allows you to move the chart to better visualize the most relevant points for your trade.
Recommend you to add a keyboard shortcut for quick access (Ctrl + Q - for example), because you will need to run ChartPan after symbol changing to "release" the chart again.
To add a hotkey: after downloa
FREE

In the world of finance, correlation is a statistical measure of how two securities move in relation to each other. Correlations are used in advanced portfolio management. This indicator measures how different securities move in relation to a reference one, thus making portfolio management easier. [ Installation Guide | Update Guide | Troubleshooting | FAQ | All Products ] Avoid concurrent trades in highly correlated instruments Find trading opportunities among highly correlated instruments Cor
FREE

PA Touching Alert избавит вас от необходимости днями напролет следить за ценой в ожидании ее касания важных ценовых уровней. Индикатор позволяет установить два ценовых уровня: верхний и нижний, которые должны быть выше/ниже текущей цены соответственно. Как только цена коснется одного из них, сработает алерт и/или уведомление. Уровни можно использовать в качестве сильной поддержки/сопротивления. Отзывы и пожелания приветствуются.
Входные параметры upper_pa: верхний ценовой уровень lower_pa: ниж
FREE

Представляем индикатор “Информация о Стоимости Символа” – ваш незаменимый инструмент для поддержания лидерства на рынке форекс! Этот инновационный индикатор создан для того, чтобы обеспечить трейдеров информацией о реальной стоимости в режиме реального времени, непосредственно на их графиках. Вот почему каждому трейдеру необходим индикатор “Информация о Стоимости Символа” в его арсенале: Мониторинг Спреда в Реальном Времени: Внимательно следите за спредом любой валютной пары, чтобы входить на р
FREE

The MP Andean Oscillator is used to estimate the direction and also the degree of variations of trends. It contains 3 components: Bull component, Bear component and Signal component. A rising Bull component indicates that the market is up-trending while a rising Bear component indicates the presence of down-trending market. Settings: Oscillator period: Specifies the importance of the trends degree of variations measured by the indicator. Signal line per: Moving average period of the Signal line
FREE

Highly configurable Adx indicator.
Features: Highly customizable alert functions (at levels, crosses, direction changes via email, push, sound, popup) Multi timeframe ability Color customization (at levels, crosses, direction changes) Linear interpolation and histogram mode options Works on strategy tester in multi timeframe mode (at weekend without ticks also) Adjustable Levels Parameters:
ADX Timeframe: You can set the lower/higher timeframes for Adx. ADX Bar Shift: you can set the
FREE

Many friends asked me for a simple, non-obtrusive, resource-friendly clock to track the time during their trades. It seems pretty obvious, but it is a must-have for those trading the market manually, waiting for the Market News, or just to visually know what time it is... Trading is an absorbing endeavor! So, here it is... Totally configurable, including Font Type, Font Size and Chart Location: Upper Left/Center/Right OR Lower Left/Center/Right, with a little twist of adjusting the Offset, just
FREE

Introducing StochEAstic: an advanced Expert Advisor utilizing the stochastic indicator to provide precise market entry and exit signals. Engineered with sophisticated algorithms, this EA empowers traders to effectively control risk and maximize profit potential. With StochEAstic, traders can customize their trading strategies according to their individual preferences. From adjusting stochastic indicator parameters to setting specific risk levels, this EA offers flexibility and complete control o
FREE

To get started, subscribe to the RealTrend Telegram channel. t.me/RealTrendFree
RealTrend is an EA that facilitates trading for expert users.
The user's aim is to identify the right business trend
and let RealTrend suggest the placement of pending orders in strategic points
where the price will retrace and then continue its trend.
RealTrend is very simple to use and includes a single user-defined stoploss input and an intuitive chart panel.
The takeprofit is placed directly by the Bot.
FREE

This Indicator is based on Mr. Dan Valcu ideas.
Bodies of candles(open-close) are the main component used to indicate and assess trend direction, strength, and reversals.
The indicator measures difference between Heikin Ashi close and open.
Measuring the height of candle bodies leads to extreme values that point to trend slowdowns. Thus quantifies Heikin Ashi to get earlier signals.
I used this indicator on Heiken Ashi charts but, it's possible to choose to calculate Body size based on
FREE
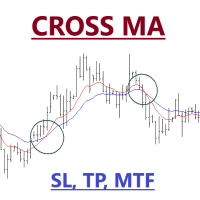
Expert Advisor of Cross two moving averages accompanied by stop loss, take profit and multi timeframes on each moving averages. You can change all the parameters contained in the moving averages
Please use as appropriate, hopefully can be useful and assist you in the transaction Don't forget to give a review if this product helps you
MA Method 0 = simple 1 = exponential 2 = smoothed 3 = LW
FREE

The "YK-LOT-SIZE" is a custom indicator for MetaTrader 5 (MT5) that displays the total lot sizes and profits for both buy and sell positions on the current chart. Key features of the indicator: It calculates the total lot sizes for all open buy and sell positions of the current symbol. It calculates the total profits (including commissions and swaps) for all open buy and sell positions. The indicator displays the information on the chart using two lines of text: "BUY Lots: [total buy lots] | BUY
FREE

ToolBot Advisor Indicator (RSI, ATR, ADX, OBV) FREE An effective indicator for your negotiations
The toolbot indicator and advisor brings leading (OBV) and lagging (RSI, ATR, ADX) indicators so that you have more security in your negotiations. In addition, it informs you of possible up and down trends as well as providing you with incredible advisors who will give you information about trading opportunities.
With this indicator you will have more security and speed in your decision making
FREE

This Ea works on the USD CAD currency pair with M15 chart. It is not a martingale or even a grid. It works with TP and SL. It uses RSI and Bollinger Band to open Long and Short positions.
It must be tested and the correct parameter settings found before using it.
Beware that past gains do not guarantee future gains. This is not inducement to invest, beware that with forex tradign you can also lose all your capital. Money management is very important.
FREE

Description :
Combination MT5 is a professional indicator based on the Stochastic Oscillator and Average True Range (ATR) technical indicators, thus, you can use it with any currency pair and any timeframe.Trade signals from Combination MT5 are drawn on the main chart in the form of arrows. When a blue arrow appears, then this is a signal to buy, when the red one appears then this is a signal to sell. You can set the alerts on/off. The Stochastic Oscillator and Average True Range (ATR) technic
FREE

The seven currencies mentioned are: GBP (British Pound): This is the currency of the United Kingdom. AUD (Australian Dollar): This is the currency of Australia. NZD (New Zealand Dollar): This is the currency of New Zealand. USD (United States Dollar): This is the currency of the United States. CAD (Canadian Dollar): This is the currency of Canada. CHF (Swiss Franc): This is the currency of Switzerland. JPY (Japanese Yen): This is the currency of Japan. Currency strength indexes provide a way to
FREE

Если вам нравится этот проект, оставьте 5-звездочный обзор. Следуйте на instagram: borelatech Торговля большими объемами требует, чтобы мы рассмотрели несколько
инструментов/чартов для
найти новые возможности, этот показатель поможет вам при составлении конкретных
уровни множественным числом или его суффиксом и обновлять их автоматически
как изменение цены, задача, которая в противном случае будет утомительной. Например, на GBPUSD вы могли бы иметь 4 экземпляра индикатора на
диаграмма к сю
FREE

A professional fully customizable pull back strategy expert advisor with optional Martingale features.
Opens and closes orders above and below moving average based on your settings. Successfully tested on all major Forex pairs, Commodities, Volatility Indexes, Synthetic Indexes. This Expert Advisor can work with pretty much any index available on MT5 platform. Works good on any time frame, but I'd suggest to run it on H1.
I've tried to keep Expert Advisor settings as simple as possible to mi
FREE

Назначение DG DayInfo - это бесплатный индикатор, который показывает следующую информацию: Максимальные цены за день; Минимальные цены за день; Процентные изменения за день; Направление дневной свечи (Up, Down или Flat); Таймер свечей; Таким образом, DG DayInfo помогает увидеть минимум и максимум за день, процентное изменение дня, а также время до закрытия свечи.
Основные особенности Разработан простым в использовании, имеет небольшое количество параметров Работает на ВСЕХ парах Работает на вс
FREE

Об эксперте Order Risk Management Эксперт ORM разработан специально для быстрого и точного исполнения ордеров. Он предназначен для использования с нашими перечисленными ниже стратегиями Ценового действия и Эконометрической торговли. Эксперт ORM полностью автоматизирован и прост в применении. Эксперт ORM абсолютно бесплатный. Такой способ исполнения ордеров экспертом ORM подходит для любой иной торговой стратегии. Harmonic Pattern Plus MT5 Harmonic Pattern Scenario Planner MT5 Price breakout Patt
FREE

BinaWin NoTouch - это индикатор, который посылает сигнал тревоги, когда сделка находится в правильной позиции, чтобы дождаться пробоя бокового рынка.
Он специально разработан для торговли по стратегии «без касания» платформы Binary.Com с синтетическими индексами N.10, N.25, N.50, N.75 и N.100.
Аналогичным образом, торговля может быть осуществлена с помощью обычной стратегии CALL и PUT любой платформы бинарных опционов.
Требования к использованию индикатора:
1. Иметь учетную запись на
FREE

This indicator is a very simple indicator that draws candlesticks on a chart. However, it is possible to draw not only on the main chart but also on several sub-charts. In addition,it is possible to draw different symbols and timeframes from the main chart. features. 1. any symbols 2. any timeframes 3. two candle type(normal and heikin ashi) 4. many candle colors(intersection with ma_1) 5. pivot line (ver1.2) In case of positive candle, FULL : change color if low is over ma_1 PARTIAL :
FREE

ForexBob Candle Timer Is an amazing countdown time indicator which shows the time remaining for next candle to open. It can be used on any timeframe. It helps to plan your next trading action.
Inputs are simple Color - To change the color of displaying time. Size - To set the size of font Next for settings are used to set the location of time Font - To change the font type.
Please check my other products here https://www.mql5.com/en/market/my
FREE

Totally linked to the result of a movement and the duration he had. Its height records how many ticks the asset walked during a given movement, its width shows us the duration that movement had. Its configuration must be in line with the Weis Wave Indicator configuration to observe the movement force and can indicate a possible accumulation or distribution of the movement;
FREE

Индикатор основан на стандартном индикаторе объемов Volumes. Он рассчитывает средний объем на основе выбранных последних N баров, и если значение объема превышает указанное среднее значение в %, цвет индикатора изменится. Индикатор отображается в отдельном окне.
Входные параметры Bars used to calculate the average volume - количество баров для расчета среднего объема. Threshold (in %) for changing the color of the Bar - порог в %, при котором цвет бара изменится.
FREE

Индикатор сканирует до 15 торговых инструментов и до 21 таймфрейма на наличие высоковероятностных моделей паттерна Двойная вершина/дно с ложными прорывами . Что определяет этот индикатор: Этот индикатор находит особую форму таких паттернов, так называемые двойных вершин и нижних частей, так называемый Двойная вершина/дно с ложными прорывами . Паттерн "Двойная вершина с ложными прорывами" формируется, когда максимальная цена правого плеча выше левого плеча. Паттерн "Двойное дно с ложными прорывам
FREE

Этот продукт получает информацию от индикаторов/сигнальных инструментов и отображает стрелки или уведомления при выполнении определенных условий.
Например, стрелки и уведомления отображаются, когда MA25 и MA50 пересекаются, когда SAR разворачивается, когда MACD меняет свой плюс/минус или когда цена закрытия пересекает полосы Боллинджера.
Пожалуйста, обратитесь к примеру изображения настроек для конкретных конфигураций.
Подробные руководства и файлы конфигурации:
https://www.mql5.co
FREE

Что такое Stochastic? Осциллятор стохастик (Stochastic) – это индикатор импульса, который сравнивает конкретную цену закрытия инструмента с его диапазоном максимумов и минимумов за определенное количество периодов. Основная идея индикатора заключается в том, что импульс предшествует цене, поэтому стохастический осциллятор может давать сигналы о фактическом движении цены непосредственно перед тем, как оно произойдет. Stochastic является осциллятором с привязкой к диапазону от 0 до 100 (по
FREE

Скользящая средняя Т3 Тиллсона была представлена миру технического анализа в статье «Лучшая скользящая средняя», опубликованной в американском журнале Technical Analysis of Stock Commodities. Разработанный Тимом Тиллсоном, аналитики и трейдеры фьючерсных рынков вскоре увлеклись этой техникой, которая сглаживает ценовой ряд, уменьшая при этом лаг (лаг), типичный для систем следования за трендом.
FREE

ЭТО БЕСПЛАТНАЯ ВЕРСИЯ РАСШИРЕННЫХ УРОВНЕЙ PRICE ACTION
бесплатно на месяц, но на демо-счете.
полный продукт: https://www.mql5.com/en/market/product/94338 Точные горизонтальные уровни поддержки и сопротивления Точно для анализа ценового действия. Все рынки: форекс, акции, индексы, металлы, товары и криптовалюта Доступно для метатрейдера 5 Регулируемые параметры я думаю это все
Поговорите со мной в телеграмме: @ https://t.me/Userrrrrrrrrname
Прямые продажи находятся на уровне 19 долларов.
FREE

Данный индикатор отображает график крестики-нолики (графики PnF) в окне индикатора. Такие графики показывают только те изменения цены, что больше указанной величины порога (размера клетки). Это позволяет скрыть шум и сконцентрироваться на основных трендах. Время здесь не берется в расчет. Учитывается только движение цены. Вот почему график крестики-нолики не синхронизируются с основным графиком, к которому он прикреплен. Более подробную информацию о графиках крестики-нолики можно узнать в Википе
FREE

In which direction should I trade today? For “TREND followers”, we need to determine the TREND . This indicator determines the Trend based on the price High, Low and Close of every bar, for a given period and timeframe. Calculating and plotting the Trend UP and Trend DOWN lines. If the: “Trend UP” line (Green) is above the “Trend DOWN” line (Red), then it is a BULLISH Trend (see "Screenshots" tab). “Trend DOWN” line (Red) is above the “Trend UP” line (Green), then it is a BEARISH Trend (see "
FREE

A simple price action indicator to highlight inside and outside bars (candles) with colors. It is possible to choose what type of bar can be highlighted among: inside, ouside or both. It is can be possible to choose a first specific color for the shadow and the border of bars (candles), a second specific color for high/bull bar (candle) and a third specific color for down/bear bar (candle)
FREE

Introducing TRAD-E- LITE : Your Ultimate Trading Assistant! Are you tired of manually analysing the markets and executing trades? TRAD-E- LITE is here to assist you! Developed by Gold Lion XI, this expert adviser utilizes advanced algorithms to identify profitable trading opportunities and execute trades automatically, saving you time and effort. Key Features: Trading Time Management: Take control of your trading schedule. With TRAD-E- LITE , you can define specific trading hours based on your p
FREE

With Break Even Trader placed onto your chart, it will automatically place the stop loss and take profit levels when you open a buy or sell order. And when you are in profit by the amount defined in user settings, it will automatically move your stop loss to that break even level, thereby protecting your trade from a loss. Features :
Simple to trade with you just enter your trade it will place the stop loss and take profit as input in user inputs. Sends you an alert when your trade is in profi
FREE

For those who feel that regular RSI is too fast and too noisy to be used on regular trades or in EAs and want to have an alternative to meter the Momentum of the Price, here is a solution presented on the great article of the Technical Analysis of Stocks & Commodities magazine (April, 2015), by Vitali Apirine, called: Slow Relative Strenght Index . Its reading is almost the same as the regular RSI, but its levels of Overbought and Oversold are 80 and 20 instead. SRSI is very powerful to show div
FREE

Индикатор Pz Market Sentiment оценивает рыночную тенденцию на основе примерных измерений ценового движения. Данный индикатор является подтверждающим и может быть особенно полезен для трейдеров, ориентирующихся на ценовые движения. Использовать его для принятия торговых решений нельзя, так как текущее поведение цены и господствующая на рынке тенденция могут не совпадать. Пользоваться индикатором довольно легко: Можно покупать, если осциллятор зеленый Можно продавать, если осциллятор красный
Ре
FREE
Forex Trade Manager Grid MT5 helps you to managing orders and achieve the goal. You only need to place first order with Take Profit, run EA and set in params profit (pips) you want to get. EA will be managing your positions, as will gather appointed amount of pips. It’s a strategy for management of manual trades opened on current pair. The strategy adds positions to currently opened trades in a grid management (with chosen distance in pips between trades) - up to 15 trades (or less). First up to
FREE
Counterattack EA is a fully automatic Grid Expert Advisor for Trend Scalping Trading on XAUUSD timeframe M1 but also in others.
Recommendations The Expert is programmed to work on XAUUSD M1, but you can use all others timeframes also. An ECN broker is always recommended A low latency VPS is always recommended. The recommended Leverage is 1:100 or more. The recommended capital is 10000 ($/cent) per 0.01 Lots or more. For higher Lots please test by yourself Please test Demo before you
FREE

Multi time frame, multy currency special swing volume indicator with engulfing waves too. Simpler to use compare to Weis Wave. User don't need to adjust wave size. Just use of the basic or the upper time frames. As a multi time frame indikator user can do very complex time frame analysyses. As well as a multy currency indicator one can make market sector-segment analysyses. Use with Wckoff principles.
FREE
A 'Seconds Period' chart, offering enhanced precision for charting and analysis. Especially beneficial during volatile market conditions and intraday trading. This indicator addresses the limitations of MT5's predefined timeframes, allowing for finer granularity down to second intervals.
Since only one EA can run per chart, being an Indicator allows for the additional advantage of running an EA alongside the Seconds Timeframe Candles Indicator on the same chart. Compatible with any intraday t
FREE

QuantumAlert RSI Navigator is a free indicator available for MT4/MT5 platforms, its work is to provide "alerts" when the market is inside "overbought and oversold" regions in the form of "buy or sell" signals. This indicator comes with many customization options mentioned in the parameter section below, user can customise these parameters as needful. Join our MQL5 group , where we share important news and updates. You are also welcome to join our private channel as well, contact me for the priva
FREE

This is a depowered version of the following product: AI Trading Advisor
This version is just to give you an idea but it does not allow you to run multiple tasks at once, and it is totally depowered. It is free as the cost of the service is offered entirely by StormWave Tech. This version cannot do in-depth analysis but it can give you an idea of how the AI works and interacts with the metatrader, unlike the paid version which instead has unlimited capacity even to perform tasks simultaneousl
FREE

O Indicador valida a força da tendência utilizando o volume negociado. Os candles são mostrados na cor verde indicando força compradora e cor vermelha na força vendedora. O movimento é encerrado pelo SAR parabólico. Vantagens: Filtra distorções de preço sem volume financeiro; Filtra consolidações e movimentos laterais; Filtra divergências de volume pelo indicador Money Flow. Desvantagens: Não filtra todos os falsos rompimentos, visto que rompimentos importantes geram altos volumes financeiros; N
FREE

Profitable Scalper EA - Rôla Scalper! Tested on EURUSDm Symbol on Micro Account created in XM Broker, but you can try it in any market or broker, any way I recommend that you use it on markets with volatility similar to EURUSD.
This EA can open a lot of positions, so I recommend that you use a broker that don't have comission fee and provide low spread.
You can use settings on 5 minutes timeframe, since I started to use it, and in tests, the maximum drawdown with this settings and M5 timefr
FREE

For those traders and students who follow the famous brazilian trader Igor Rodrigues (Mago Trader) here it is his famous 2 EMAs - based on Phi ratios - and packed with a twist: a Filling Area , to easily and visually spot the corresponding trend on the chart. You can turn On and Off this filling. If you don't know Igor Rodrigues and you are a brazilian trader and student, just google for him... Very simple and useful indicator.
If you are looking also for the MACD -based indicator of this trad
FREE

Highly configurable CCI indicator. Features: Highly customizable alert functions (at levels, crosses, direction changes via email, push, sound, popup) Multi timeframe ability Color customization (at levels, crosses, direction changes) Linear interpolation and histogram mode options Works on strategy tester in multi timeframe mode (at weekend without ticks also) Adjustable Levels Parameters:
CCI Timeframe: You can set the current or a higher timeframes for CCI . CCI Bar Shift: you can set
FREE

ATR Moving Average draws a moving average of the standard Average True Range( ATR ) in the same window.
Settings Name Description ATR period
Set Price per iod for ATR calculation
ATR level Set ATR value for thresholding( only whole number, ignore leading zeros e.g. 0.00089 = 89 ) MA Period Set moving Average Period MA Method Set moving average method( Simple, Exponential, Smoothed and Linear Weighted ) MA Shift
Set moving average shift
Enable Alerts ? Generate Alert when ATR crosses
FREE

This indicator demonstrates the probable dynamic support and resistance levels of EMA, Ichimoku lines, and Key OHLC levels for different timeframes on one chart. This can drastically reduce the time and effort needed for switching between different timeframes.
EMA and Ichimoku Levels are drawn for the M1, M5, M15, M30, H1, H4, and D1 timeframes, and the Key OHLC levels of the last periods are drawn for the H4, D1, W1, and MN1 timeframes.
FREE

Developed by Charles Le Beau and featured in Alexander Elder's books, the Chandelier Exit sets a trailing stop-loss based on the Average True Range (ATR). The indicator is designed to keep traders in a trend and prevent an early exit as long as the trend extends. Typically, the Chandelier Exit will be above prices during a downtrend and below prices during an uptrend.
Calculation
The original Chandelier Exit formula consists of three parts: a period high or period low, the Average True
FREE

Что такое CCI индикатор? Стандартный Индикатор CCI (Commodity Channel Index) – это осциллятор, который измеряет силу, стоящую за тем или иным движением цены. Он помогает определить, кто находятся у руля: быки или медведи. Как и многие осцилляторы импульса, CCI работает, сравнивая текущую цену с предыдущими показателями, и на основе этого сравнения он решает, насколько сильное движение цены вверх/вниз.
Как рассчитать CCI? Метод расчета стандартного индикатора представляет собой оригинальн
FREE

Советник NewsCatcher Free открывает сделки на развороте от уровней поддержки и сопротивления. Возможность входа в рынок подтверждается индикатором "индекса относительной силы" (RSI). Индикатор RSI представлен в виде тахометра. Рекомендуется торговать в периоды сильной волатильности на рынке, которая возникает после политических событий или публикации экономических данных.
Советник можно использовать как в полуавтоматическом режиме (индикатор RSI выполняет информационную цель), так и в автоматич
FREE

Necessary for traders: tools and indicators Waves automatically calculate indicators, channel trend trading Perfect trend-wave automatic calculation channel calculation , MT4 Perfect trend-wave automatic calculation channel calculation , MT5 Local Trading copying Easy And Fast Copy , MT4 Easy And Fast Copy , MT5 Local Trading copying For DEMO Easy And Fast Copy , MT4 DEMO Easy And Fast Copy , MT5 DEMO Fibo: from KTrade 1. Automatically calculate and analyze the band. -> Get the desired band 2.
FREE

Volume Weighted Average Price (VWAP) is a trading benchmark commonly used by Big Players that gives the average price a Symbol has traded throughout the day. It is based on both Volume and price. Additionally we put in this indicator the MVWAP (Moving Volume Weighted Average Price). For those who do not know the usage and the importance od this indicator I recommend a great article about this subject at Investopedia ( https://www.investopedia.com/articles/trading/11/trading-with-vwap-mvwap.asp )
FREE

Описание эксперта
Торговая система эксперта основана на входе и выходе при определенном отклонении цены актива от значения скользящей средней. Эксперт обладает рядом параметров, манипулируя которыми можно реализовывать разные торговые системы и так же получать разные результаты при торговле на разных активах, учтите это при настройке эксперта и не используйте стандартные настройки на всех инструментах и тайм фреймах.
Рекомендации по эксплуатации
Рабочими тайм фреймами эксперта является M
FREE
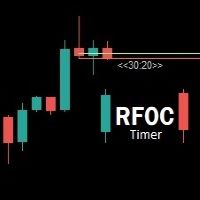
Uma informação de grande valor para o trader se localizar no tempo é a informação de quanto tempo temos para o encerramento do candle atual ou quanto falta para a formação de um novo candle. O RFOC Timer apresenta esta informação de forma clara e alocada à direita do candle atual. Adicionalmente o RFOC Timer acompanha a opção de inclusão das linhas de preços ASK e BID com e sem extensão a direita e/ou esquerda. Esta função auxilia, por exemplo, a não sobreposição das linhas de ASK e BID com as
FREE

We at Minions Labs love to study, challenge and discover new facts about Price Behavior in current markets. We would NOT call it Price Action because today this is a word totally overused and means, thanks to the False Prophets out there, absolutely NOTHING.
The study hypothesis we propose is this: Some Assets, in certain Timeframes, present a behavior of Price continuity when the candlesticks close without a Wick on them... So the purpose of this indicator is to "color" those candlesticks wh
FREE

This indicator is an automated version of the Fibonacci retracement (Fib) indicator. Deciding the best areas to use when drawing the fib can be tricky and this indicator was made with that in mind. When you drop it on the chart it will automatically choose the best points to draw the fib with, but in case you aren't satisfied with those regions, you can adjust it as you wish.
FREE
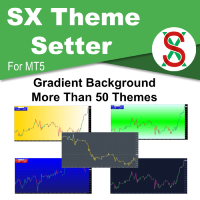
SX Theme Setter is intended for changing chart appearance in 2 modes: - Gradient background mode:
In this mode, the indicator creates a gradient background for your chart. Colors, steps and gradient type can be selected by user. - Color theme:
Color theme mode provides more than 50 built-in different color themes which can be selected from a list. Most of these themes are converted from official color themes of real trading platforms of the past and present. Try them out and see if they sui
FREE

Introducing our Gold Premia Robot—a cutting-edge, automated system leveraging Bollinger Bands, Ichimoku, and RSI to strategically buy gold on Fridays. Capitalizing on major funds adjusting positions, it minimizes weekend risk for enhanced trading precision and potential returns. Experience market advantage with our innovative algorithm.
– fixed lot to 0.01 – No martingale, no grid – No excessive consumption of CPU resources – timeframe is D1 – User-friendly settings – All settings optimized
FREE
MetaTrader Маркет - уникальная площадка по продаже роботов и технических индикаторов, не имеющая аналогов.
Памятка пользователя MQL5.community расскажет вам и о других возможностях, доступных трейдерам только у нас: копирование торговых сигналов, заказ программ для фрилансеров, автоматические расчеты через платежную систему, аренда вычислительных мощностей в MQL5 Cloud Network.
Вы упускаете торговые возможности:
- Бесплатные приложения для трейдинга
- 8 000+ сигналов для копирования
- Экономические новости для анализа финансовых рынков
Регистрация
Вход
Если у вас нет учетной записи, зарегистрируйтесь
Для авторизации и пользования сайтом MQL5.com необходимо разрешить использование файлов Сookie.
Пожалуйста, включите в вашем браузере данную настройку, иначе вы не сможете авторизоваться.