ChangePeriod MT5
- Indicadores
- Kazuya Yamaoka
- Versão: 1.0
- Ativações: 5
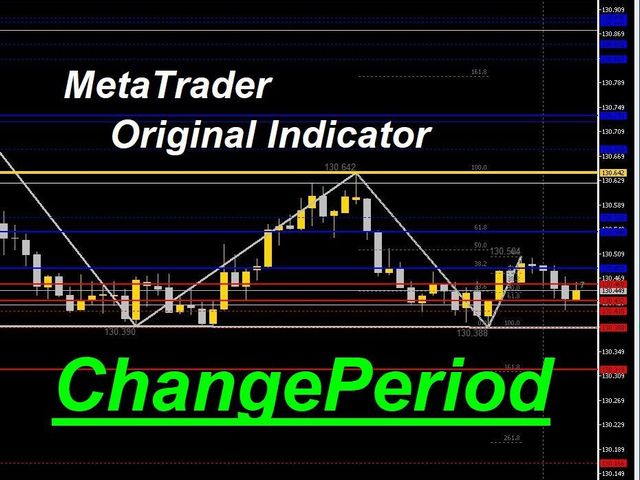
You can change the time period of the chart at the touch of a button. You can also change multiple charts at the touch of a button. You can also change multiple charts at the touch of a button,
saving you the trouble of changing time periods.
We are live-streaming the actual operation of the system. Please check for yourself if it is usable. Please check it out for yourself.
https://www.youtube.com/@ganesha_forex
We do not guarantee your investment results. Investments should be made at your own risk.
We sharll not be liable for any disadvantage or damage caused by the use of the information provided.