• Visão global
  • Comentários
  • Discussão
  • O que há de novo

Keklik MA

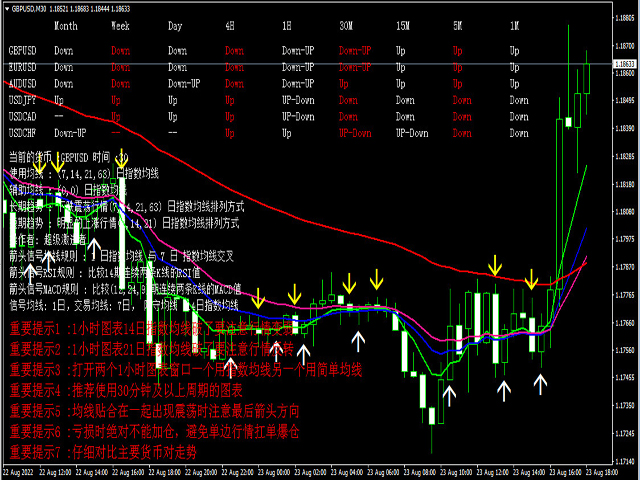
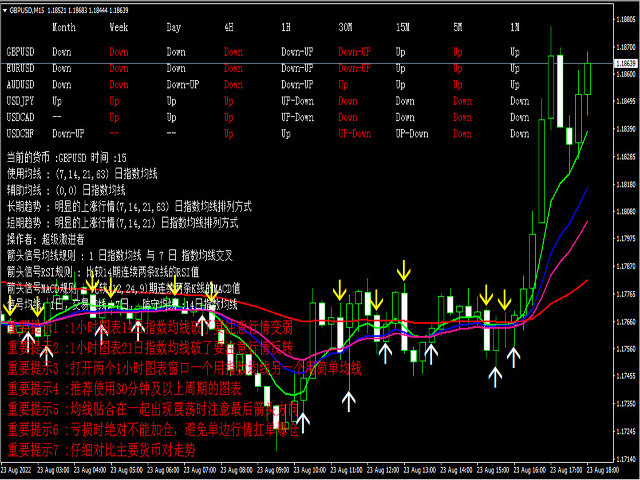
Nome de índice: keklik ma


Uso: Ma, MACD, RSI e outros indicadores técnicos.


Ciclo recomendado: tabela de 1 hora.


Tendência a longo prazo: EMA 1, EMA 2, EMA 3, EMA 4 arranjo de média móvel. Valor por defeito da EMA: 7,14,21,63.


Tendência de curto prazo: EMA 1, EMA 2, EMA 3 arranjo de média móvel.


Tipo de operador: Super radical, radical e moderado. O valor padrão é 2. (0 robusto: sinal EMA cruza ema3, 1 radical: sinal EMA cruza ema2, 3 super radical: sinal EMA cruza ema1.)


Sinal de seta: encontre a regra EMA, a regra RSI e a regra MACD ao mesmo tempo.


Regra da média móvel do sinal de seta: a média móvel do sinal cruza a média móvel da negociação.


Regra RSI do sinal de seta: compare os valores RSI de duas linhas K consecutivas.


Regra MACD de sinal de seta: compare os valores MACD de duas linhas K consecutivas.


Sinal EMA: siginalema, negociação EMA: ema1, defesa EMA: ema2. Valores por omissão: 1,7,14.


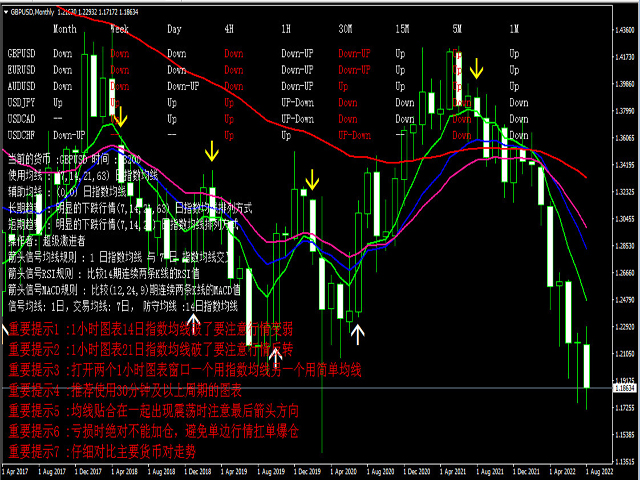
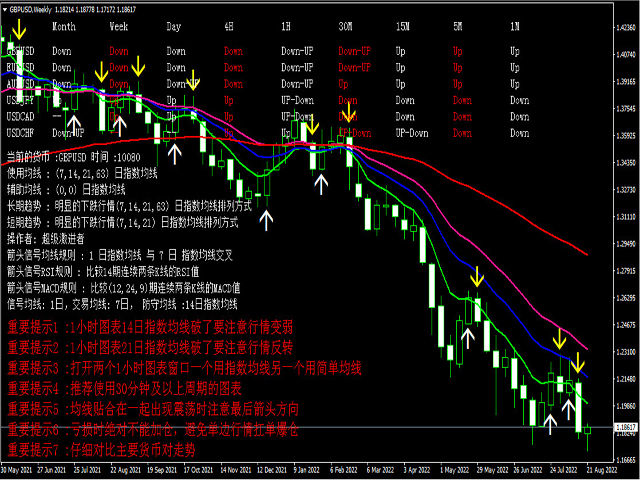
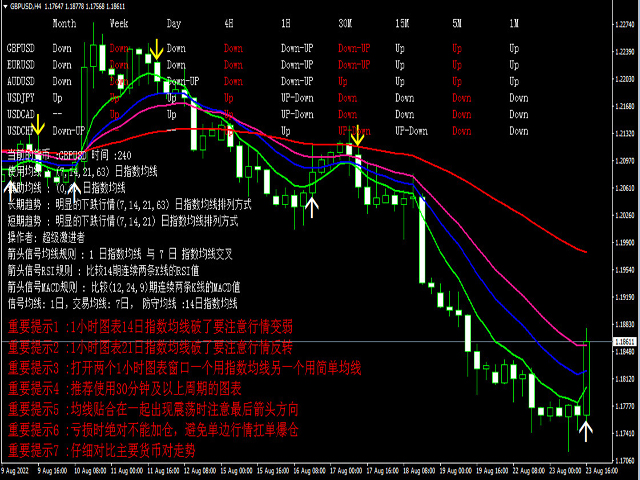
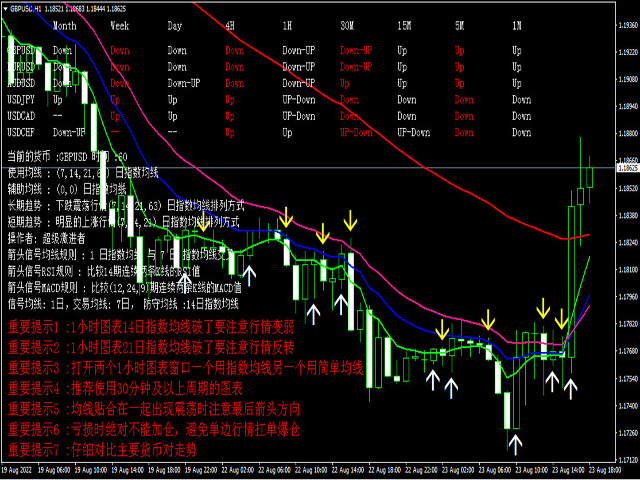
Lembrete da transacção:


Nota importante 1: se a linha K do gráfico de 1 hora quebrar ema2, preste atenção ao enfraquecimento do mercado.


Nota importante 2: quando a linha K do gráfico de 1 hora quebra ema3, você deve prestar atenção à reversão do mercado.


Nota importante 3: abra duas janelas de gráfico de 1 hora, uma com uma média móvel exponencial e a outra com uma média móvel simples.


Nota importante 4: recomenda-se usar gráficos com um período de 30 minutos ou mais.


Nota importante 5: quando ema1, ema2, ema3 e ema4 estão ligados e vibrados, preste atenção à direção da última seta.


Nota importante 6: você não deve aumentar sua posição em caso de perda, de modo a evitar que o mercado unilateral carregue uma única posição


Nota importante 7: compare cuidadosamente a tendência dos principais pares de moedas.


A tendência dos principais pares de moedas em cada ciclo deve ser referida, e a tendência do índice do dólar americano pode ser dominada a qualquer momento.
Produtos recomendados
Heiken Ashi Smoothed Strategy is a very simple but powerful system to get forex market trend direction. This indicator is actually 2 indicators in 1 pack, Heiken Ashi and Heiken Ashi Smoothed Moving Average both included. Because HA (Heiken Ashi) and HAS (Heiken Ashi Smoothed) are calculated in the same one system event with necessary buffers and loop only, so it is the FAST, OPTIMIZED and EFFICIENT HA having the combined indicator of MetaTrader 4. You can choose to display HA and HAS in the sam
Indicador Forex HTF ADX para MT4 Atualize seus métodos de negociação com o indicador profissional HTF ADX para MT4. HTF significa - Prazo Maior ADX (linha vermelha) é usado para medir a força da tendência - se o valor ADX estiver acima de 30 e tiver formato superior - a tendência é forte Se o +DMI (linha azul) estiver acima do -DMI (linha verde): o preço está subindo e o ADX mede a força da tendência de alta Se o -DMI (linha verde) estiver acima do +DMI (azul): o preço está caindo e o ADX med
Ichimoku Trade X is an EA based on Ichimoku Kinko Hyo. Ichimoku Kinko Hyo parameters such as Tenkansen1, Kijunsen1, SenkouSpanB1, BuyShift1, Tenkansen2, Kijunsen2, SenkouSpanB2, BuyShift2, Tenkansen3, Kijunsen3, SenkouSpanB3, SellShift1, Tenkansen4, Kijunsen4, SenkouSpanB4 and SellShift2 can be adjusted. Ichimoku Trade X applies BTN TECHNOLOGY's state-of-the-art intelligent technology to help you create optimal results for your trades. May your dreams come true through Ichimoku Trade X. Good lu
Trend Direction ADX indicator for MT4 Trend Direction ADX is part of a series of indicators used to characterize market conditions. Almost any strategy only work under certain market conditions. Therefore it is important to be able to characterize market conditions at any time: trend direction, trend strength, volatility, etc.. Trend Direction ADX is an indicator to be used to characterize trend direction: trending up trending down ranging Trend Direction ADX is based on ADX standard indi
This indicator is an upgrade of traditional MACD on MT4. Macd Base line cross above Macd signal line the color of histogram change is red color and entry order Sell. Macd Base line cross below Macd signal line the color of histogram change is green color and entry order Buy. For above histogram of Macd can change color to good looking by can change color above zero line and lower line.
Uma versão ampliada do conhecido indicador Moving Average Convergence / Divergence (MACD), distribuído em 4 cores: crescimento, queda acima e abaixo de 0. 26 opções para suavizar médias móveis, 11 tipos de preços. Alertas desativados na mudança de cor com       modo de alerta selecionável: somente ao cruzar um valor zero ou em qualquer mudança de cor (mudança crescente / decrescente e 0 cruzamento). Opções de suavização: Simples, Exponencial, Exponencial Wilder, Linear Ponderado, Seno Ponderado,
Madx Cobra
Santi Dankamjad
Madx Cobra Indicator. Create to traders both experienced and inexperienced to use it because it is a basic indicator How to use : Setting Indicator 1. MA Fast  : Moving Average fast (10) 2. MA Slow :  Moving Average Slow control trend markets.(200) 3. ADX : Control trend(5) 4. For alert you can set to alert Next bar or instant bars.  When arrow sky blue show or arrow up, you can entry order "Buy" or "Long" and arrow red show or arrow down, you can entry order "Sell" or "Short" Setting s
Power Renko is an indicator which plots Renko bricks underneath the chart using a histogram. You can select the brick size and the timeframe of the Renko bricks as well as whether or not to use the close price or the high/low price of the candles. Renko bricks are based on price alone, not time, therefor the Renko bricks will not be aligned with the chart's time. They are extremely useful for trend trading and many different strategies can be formed from them. Buffers are provided allowing you t
A trend indicator based on the Ichimoku Kinko Hyo and MACD. The ICloud Scalper Trend Indy is an improved variant of the Ichimoku Kinko Hyo and MACD, which shows the moment of trend following quite accurately. It is often used as a signal filter. Combination of two indicators makes a better use of these advantages: Ichimoku Kinko Hyo identifies the trend, while MACD determines the short-term movements and signals in the trend direction. Messages/Sounds (Notifications and sound settings) ON/OFF
This indicator takes input from the RSI from multiple time frames (M/W/D/H4/H1/M30), and presents the output as lines above or below the price, on the main chart. Great for scalping. Features alerts for the current time frame's RSI (the Arrows). Settings: RSI period settings for M/W/D/H4/H1/M30/Current. (Set to your preference) PSar settings for trend determination; for current chart's time frame. How to use: Simply attach to M5 (Scalping - zoom chart out completely on M5) or use on higher time
The HTF Stochastic displays Stochastic oscillator from a higher time frame. For example: You can see D1 Stochastic on a M30 chart. It has all parameters available like a normal Stochastic. The HTF Stochastic is visible for all time frames below the one you setup. So if you choose H4 period you can see Stochastic oscillator from that time frame on H1, M30, M15, M5 and M1 chart. For M30 setup, you can have M30 Stochastic on M15, M5 and M1 chart.
Download the free USDJPY version   here. MACD Indicator The Moving Average Convergence and Divergence (MACD) is a trend following momentum indicator which shows the relationship between two moving averages that we chose and configure them on the indicator. The MACD is calculated by subtracting the 26-period exponential moving average and the 12 period D.A.M. These are the default parameters when you put the MACD indicator on the charts, and the period is usually 9 which means the last 9 candle
This indicator takes input from the RSI, combined with a trend filter. Great for scalping. Does not feature any alerts and is best used manually. Settings: TrendFilterPeriod RSIPeriod Set these parameters to your preference. How to use: Attach to any chart with default settings. Can be used on any time frame. If used on lower time frames, check higher time frames too. Buy : - Wait for blue histo color to cross above level 50, then open buys. **Best results when checking the higher time frames to
Serpent
Vladimir Gribachev
The strategy is based on the MACD and Moving Average indicators. It buys when the fast MA is above the slow MA and the MACD histogram is above the signal line. It sells when the fast MA is below the slow MA and the MACD histogram is below the signal line. Designed for 4 and 5-digit quotes, use it on a VPS hosting. Launching the EA It is recommended to launch the EA on several adjacent currency pairs with the same magical numbers. For example: GBP USD , EUR USD , AUD USD , NZD USD ; or USD CAD, U
StarTrend
Gabriele Tedeschi
StarTrend è un indicatore a freccia che identifica, con alta probabilità, l'inizio di un nuovo trend.  La sua versatilità, però, permette di utilizzarlo anche in strategia in cui cerchiamo operazioni a favore di trend. StarTrend può essere la base del proprio sistema di trading oppure può integrare, per dare conferme o suggerimenti di astensione, il tuo sistema già collaudato. StarTrend invia segnali di preallarme quando c'è un probabile rallentamento della forza del trend e poi disegna una stel
Gobbo MT4
Alessandro Grossi
Gobbo è un indicatore professionale che evidenzia il trend del mercato con un aspetto grafico chiaro e comprensibile, è basato sulla Moving Average e può essere impostato su qualsiasi periodo di intervallo, di default impostato sul periodo 14, scegliendo un periodo più alto evidenzierà meno cambi di tendenza per un approccio sul medio o lungo periodo, con un periodo più basso più cambi di tendenza per un approccio sul breve termine L'aggiornamento e l'adattamento al time frame scelto avviene in
Trend Oscillator - é um indicador personalizado avançado, ferramenta de negociação eficiente! É usado um novo método de cálculo avançado - 20 opções para o parâmetro "Preço para cálculo" O oscilador mais suave já desenvolvido Cor verde para tendências ascendentes, cor vermelha para tendências descendentes Valores sobrevendidos: abaixo de 5; Valores de sobrecompra: acima de 95 Existem muitas oportunidades para atualizar até mesmo estratégias padrão com este indicador // Mais excelentes Exper
The Four Moving Averages Message indicator ( please see the description and video ), a version of Four Moving Averages , concurrently displays four Moving Averages with default settings in the main chart window: Green and Red ones represent a short-term trend, Red and Blue ones - mid-term trend, while Blue and Yellow ones - long-term trend. You can change the moving average settings and colors. However, these parameters have been configured so that to allow trading on all time frames. The built-
ADX Pointer
Dominik Mandok
ADX Pointer is an indicator which is based on "Average Directional Index" and draws three numbers in chart window depending on the value of ADX. In ADX Pointer you can set "ADX_Period" which is of course period of Average Directional Index and you can also set 3 levels. When ADX value exceed first level ("ADX_Level1") in chart window appears number "1", when ADX exceed second level ("ADX_Level2") appears "2" and when ADX exceed third level ("ADX_Level3") appears "3". Simple. ADX Pointer works on
Description Shows Heikin-Ashi candles (often misspelled Heiken-Ashi) on the chart and can alert when candles change color. The alert is useful for both entry and exit. The number of candles of the new color before an alert is raised can be set. The alert can be controlled interactively, directly from the chart. Also includes bonus indicators of current spread and ask/bid prices in large text, color coded as price changes. Usage Heikin-Ashi candles give a much better insight to the underlying tre
Pluuto Alert
Mati Maello
1 (1)
This indicator Pluuto Alert indicator.Indicator displays trend movement. Indicator calculates automatically line.Alert = arrow.When the alert is up the next alert is down,when the alert is down the next alert is up (new bar). Features FiltPer - displays indicator period.Line1. FiltPer2 - displays indicator period.Line2. Multiplier - displays indicator multiplier.(FlitPer,Line1;step) Deviation1 - displays indicator deviation.(Line2) Deviation2 - displays indicator deviation.(Arrow) Trend - displ
" MACD crossover " is a new version of the oscillator indicator. " MACD crossover " draws a red or blue line on the chart. When the line is blue, it means that the MACD indicator is above zero. If the line on the chart is red, it means that the MACD indicator is below zero. Thus, this indicator helps traders determine the MACD position visually on the chart. This information will be especially useful when trading scalping. You can combine this indicator and trend indicators on the chart. If thi
Owl smart levels
Sergey Ermolov
4.63 (54)
Versão MT5  |  FAQ O   Indicador Owl Smart Levels   é um sistema de negociação completo dentro de um indicador que inclui ferramentas populares de análise de mercado, como   fractais avançados de Bill Williams , Valable ZigZag que constrói a   estrutura de onda correta   do mercado e   níveis de Fibonacci que marcam os níveis exatos de entrada no mercado e lugares para obter lucros. Descrição detalhada da estratégia Instruções para trabalhar com o indicador Consultor de negociação Owl Helper Ch
Infinity Trend Pro
Yaroslav Varankin
1 (1)
This is a trend indicator without redrawing Developed instead of the binary options strategy (by the color of the Martingale candlestick) Also works well in forex trading When to open trades (binary options) A signal will appear in the place with a candle signaling the current candle It is recommended to open a deal for one candle of the current timeframe M1 and M5 When a blue dot appears, open a deal up When a red dot appears, open a trade down. How to open trades on Forex. When a signal is rec
CrossMAn
Pavel Verveyko
"CrossMAn" is a table indicator that gives signals about the intersection of two moving averages, on selected instruments and time periods. The intersection of moving averages is one of the most popular signals on the stock exchange. The signal is displayed as colored rectangles in the table. Thus, you can assess at a glance which tool should be paid attention to. (Crossman does not add moving averages to the chart.) The indicator table can be dragged with the mouse. The size of the table
Индикатор DivergenceMRDM  ситуацию, когда направление движения цены и технических индикаторов не совпадает. Что можно воспринимать как точки для входа в рынок, точки потенциального разворота рынка. Чаще всего проявляется сигнал при достижении индикатором зоны перекупленности или перепроданности. Один из четырех индикаторов: MACD , RSI , ADX , Momentum . Готовая торговая система. Индикатор не перерисовывается и не запаздывает 95% сделок прибыльные. Работает на всех валютных парах и на всех таймфр
The Forex Scalpers Index (FSI) is a trend following Indicator based on moving averages.  The purpose of this indicator is to be used for scalping all kinds of markets without limitations. The indicator can be used for any kind of currency pair. For those Scalpers who are looking for the indicator that can make their trading activities easy we recommend using this indicator because it provides many entry and exit opportunities. This indicator can be used on all timeframes. How it works. Colored
StarSwing
Gabriele Tedeschi
StarSwing è un indicatore NO REPAINT che unisce in un unico strumento oscillatori e indicatori di forza.  I parametri esterni permettono di bilanciare il peso delle componenti e di regolare a proprio piacimento l'indicatore stesso. StarSwing, graficamente, è composto da segmenti di 2 colori: uno rappresentante il rialzo e uno il ribasso. Il colore non dipende dalla pura direzione del segmento ma dal trend di fondo calcolato dall'indicatore stesso. Sul grafico, si può far disegnare una media mobi
Este indicador multi-quadro de tempo e multi-símbolo alerta sobre mudanças de cor suavizadas de Heiken Ashi. Como um bônus, ele também pode verificar as mudanças de tendência (cor) da média móvel do casco. Combinado com suas próprias regras e técnicas, este indicador permitirá que você crie (ou aprimore) seu próprio sistema de negociação poderoso. Recursos Pode monitorar todos os símbolos visíveis na janela Market Watch ao mesmo tempo. Aplique o indicador a apenas um gráfico e monitore instanta
RoyalPrince Trender
Richard Louis Pastor
Trender is a special TrendLine Indicator because it is combined with a  NON-REPAINT Signal Settings: showBars =  if showBars= 0 so the indicator will be shown for all the chart PointLevel = Point Levels; 2 = central bar will be higher (lower) then 2 bars on the left side and 2 bars on the right one. qSteps  = number of steps/ no more than 3 BackStep = number of steps back startBar= if startBar=0 so we have recommendation for the current bar, if 1 - for possible next bar TrendLine= True = Trendli
Os compradores deste produto também adquirem
Gann Made Easy
Oleg Rodin
4.93 (67)
Gann Made Easy é um sistema de negociação Forex profissional e fácil de usar, baseado nos melhores princípios de negociação usando a teoria do sr. W. D. Gann. O indicador fornece sinais precisos de COMPRA e VENDA, incluindo níveis de Stop Loss e Take Profit. Você pode negociar mesmo em movimento usando notificações PUSH. Entre em contato comigo após a compra! Vou compartilhar minhas dicas de negociação com você e ótimos indicadores de bônus de graça! Provavelmente você já ouviu muitas vezes sobr
ACTUALMENTE COM 26% DE DESCONTO A melhor solução para qualquer novato ou comerciante especializado! Este Indicador é uma ferramenta comercial única, de alta qualidade e acessível, porque incorporámos uma série de características proprietárias e uma nova fórmula. Com apenas UM gráfico, pode ler a força da moeda para 28 pares de Forex! Imagine como a sua negociação irá melhorar porque é capaz de apontar o ponto exacto do gatilho de uma nova tendência ou oportunidade de escalada? Manual do u
TPSpro RFI Levels
Roman Podpora
4.87 (15)
Reversal First Impulse levels (RFI)    INSTRUCTIONS        RUS       -       ENG              R ecommended to use with an indicator   -   TREND PRO -  Version MT5 A key element in trading is zones or levels from which decisions to buy or sell a trading instrument are made. Despite attempts by major players to conceal their presence in the market, they inevitably leave traces. Our task was to learn how to identify these traces and interpret them correctly. Main functions: Displaying active zones
Atomic Analyst
Issam Kassas
5 (3)
Primeiramente, vale ressaltar que este Indicador de Negociação não repinta, não redesenha e não apresenta atrasos, tornando-o ideal tanto para negociação manual quanto automatizada. Manual do utilizador: configurações, entradas e estratégia. O Analista Atômico é um Indicador de Ação de Preço PA que utiliza a força e o momentum do preço para encontrar uma vantagem melhor no mercado. Equipado com filtros avançados que ajudam a remover ruídos e sinais falsos, e aumentam o potencial de negociação.
Scalper Inside PRO
Alexey Minkov
4.75 (57)
An exclusive indicator that utilizes an innovative algorithm to swiftly and accurately determine the market trend. The indicator automatically calculates opening, closing, and profit levels, providing detailed trading statistics. With these features, you can choose the most appropriate trading instrument for the current market conditions. Additionally, you can easily integrate your own arrow indicators into Scalper Inside Pro to quickly evaluate their statistics and profitability. Scalper Inside
Advanced Supply Demand
Bernhard Schweigert
4.92 (311)
Atualmente com 33% de desconto! A melhor solução para qualquer Trader Novato ou especialista! Este indicador é uma ferramenta de negociação exclusiva, de alta qualidade e acessível porque incorporamos uma série de recursos proprietários e uma nova fórmula. Com esta atualização, você poderá mostrar fusos horários duplos. Você não só será capaz de mostrar um TF mais alto, mas também mostrar ambos, o TF do gráfico, MAIS o TF mais alto: MOSTRANDO ZONAS ANINHADAS. Todos os traders de Oferta e Demanda
TPSproTREND PrO
Roman Podpora
4.78 (18)
TPSpro TRENDPRO  - is a trend indicator that automatically analyzes the market and provides information about the trend and each of its changes, as well as giving signals for entering trades without redrawing! The indicator uses each candle, analyzing them separately. referring to different impulses - up or down impulse. Exact entry points into transactions for currencies, crypto, metals, stocks, indices!  -  Version MT5               DETAILED DESCRIPTION                R ecommended to use with
Break and Retest
Mohamed Hassan
4.33 (12)
New update to V.4 where  Break & Retest automatically draws the take profit & stop loss levels and you also have more signals per day! ‍You can visually backtest Break & Retest to see how it behaved in the past!     Manual guide:   Click here $65  for only 1  copy left! Next price is $120 .  This Indicator only places quality trades when the market is really in your favor with a clear break and retest. Patience is key with this price action strategy! If you want more alert s
Descubra o segredo da negociação forex bem -sucedida com nosso indicador MT4 personalizado! Você já se perguntou como obter sucesso no mercado de Forex, obtendo lucros consistentemente e minimizando o risco? Aqui está a resposta que você está procurando! Permita -nos apresentar nosso indicador proprietário do MT4 que revolucionará sua abordagem à negociação. Versatilidade única Nosso indicador foi projetado especialmente para usuários que preferem as formações de vela Renko e Rangebar. En
TrendMaestro
Stefano Frisetti
5 (2)
note: this indicator is for METATRADER4, if you want the version for METATRADER5 this is the link:  https://www.mql5.com/it/market/product/108106 TRENDMAESTRO ver 2.4 TRENDMAESTRO recognizes a new TREND in the bud, he never makes mistakes. The certainty of identifying a new TREND is priceless. DESCRIPTION TRENDMAESTRO identifies a new TREND in the bud, this indicator examines the volatility, volumes and momentum to identify the moment in which there is an explosion of one or more of these data a
Trend Punch
Mohamed Hassan
5 (4)
Manual guide:   Click here Starting price of  $88  for the first 25 copies only ( 4  left)! -- Next price is  $176 .  This indicator is unstoppable when combined with our other indicator called  Support & Resistance . After purchase, send us a message and you could get  it  for  FREE as a BONUS!  Introducing Trend Punch , the revolutionary forex trend indicator that will transform the way you trade! Trend Punch is uniquely designed to provide precise buy and sell arrows during strong
TrendDecoder Premium
Christophe Pa Trouillas
5 (4)
Identifica os intervalos e os próximos movimentos prováveis   |  Obter os primeiros sinais e a força das tendências   |  Obter saídas claras antes da reversão   |  Detetar os níveis Fibo que o preço irá testar Indicador não repintável e não atrasado - ideal para trading manual e automatizado - adequado para todos os activos e todas as unidades de tempo Oferta por tiempo limitado >>   50% OFF Após a compra,   por favor contacte-me neste canal  para obter as definições recomendadas Versão   MT5 :
ACTUALMENTE 31% DE DESCONTO!! A melhor solução para qualquer novato ou comerciante especializado! Este indicador é uma ferramenta comercial única, de alta qualidade e acessível, porque incorporámos uma série de características proprietárias e uma fórmula secreta. Com apenas UM gráfico, dá alertas para todos os 28 pares de moedas. Imagine como a sua negociação irá melhorar porque é capaz de identificar o ponto exacto de desencadeamento de uma nova tendência ou oportunidade de escalada! Con
Actualmente 20% OFF ! A melhor solução para qualquer novato ou comerciante especializado! Este software de painel de instrumentos está a funcionar em 28 pares de moedas. É baseado em 2 dos nossos principais indicadores (Advanced Currency Strength 28 e Advanced Currency Impulse). Dá uma grande visão geral de todo o mercado Forex. Mostra valores avançados de força da moeda, velocidade de movimento da moeda e sinais para 28 pares de divisas em todos os (9) períodos de tempo. Imagine como a sua
FX Volume
Daniel Stein
4.6 (35)
Receba a sua atualização diária do mercado com detalhes e screenshots através do nosso Morning Briefing aqui no mql5 e no Telegram ! O Volume FX é o PRIMEIRO e ÚNICO indicador de volume que fornece uma visão REAL do sentimento do mercado do ponto de vista de um corretor. Ele fornece uma visão incrível de como os participantes do mercado institucional, como corretores, estão posicionados no mercado Forex, muito mais rápido do que os relatórios COT. Ver essas informações diretamente no seu gráfi
The indicator of a Professional Trader is an arrow indicator for predicting the direction of price movement. I have been working on this indicator since 2014. You can use this indicator as your main indicator, use its entry signals, and use it as your only indicator to find entry points. About the product: Recommended TF [H4-D1-W1]   . The indicator predicts the direction of the next candle. Fits a variety of tools; Flexibility in settings for different instruments and intervals through the
ICT, SMC, SMART MONEY CONCEPTS, SMART MONEY, Smart Money Concept, Support and Resistance, Trend Analysis, Price Action, Market Structure, Order Blocks, BOS/CHoCH,   Breaker Blocks ,  Momentum Shift,   Supply&Demand Zone/Order Blocks , Strong Imbalance, HH/LL/HL/LH,    Fair Value Gap, FVG,  Premium  &   Discount   Zones, Fibonacci Retracement, OTE, Buy Side Liquidity, Sell Side Liquidity, BSL/SSL Taken, Equal Highs & Lows, MTF Dashboard, Multiple Time Frame, BigBar, HTF OB, HTF Market Structure, 
Antes de tudo, vale ressaltar que esta Ferramenta de Negociação é um Indicador Não Repintante, Não Redesenhante e Não Atrasado, o que a torna ideal para negociação profissional. Curso online, manual do utilizador e demonstração. O Indicador de Conceitos de Ação de Preço Inteligente é uma ferramenta muito poderosa tanto para traders novos quanto experientes. Ele combina mais de 20 indicadores úteis em um único, combinando ideias avançadas de negociação como Análise do Trader do Círculo Interno e
Currency Strength Wizard é um indicador muito poderoso que fornece uma solução completa para uma negociação bem-sucedida. O indicador calcula o poder deste ou daquele par forex usando os dados de todas as moedas em vários intervalos de tempo. Esses dados são representados em uma forma de índice de moeda fácil de usar e linhas de energia de moeda que você pode usar para ver o poder desta ou daquela moeda. Tudo o que você precisa é anexar o indicador ao gráfico que deseja negociar e o indicador mo
FX Power MT4 NG
Daniel Stein
5 (10)
Receba a sua atualização diária do mercado com detalhes e screenshots através do nosso Morning Briefing aqui no mql5 e no Telegram ! O FX Power MT4 NG é a próxima geração do nosso medidor de força de moeda muito popular de longa data, o FX Power. E o que é que este medidor de força da próxima geração oferece? Tudo o que adorou no FX Power original MAIS Análise de força GOLD/XAU Resultados de cálculo ainda mais precisos Períodos de análise configuráveis individualmente Limite de cálculo personal
Legacy of Gann
Pavel Zamoshnikov
4.83 (12)
The indicator very accurately determines the levels of the possible end of the trend and profit fixing. The method of determining levels is based on the ideas of W.D.Gann, using an algorithm developed by his follower Kirill Borovsky. Extremely high reliability of reaching levels (according to K. Borovsky  - 80-90%) Indispensable for any trading strategy – every trader needs to determine the exit point from the market! Precisely determines targets on any timeframes and any instruments (forex, met
Apresentando       Quantum Trend Sniper Indicator   , o inovador Indicador MQL5 que está transformando a maneira como você identifica e negocia as reversões de tendência! Desenvolvido por uma equipe de traders experientes com experiência comercial de mais de 13 anos,       Indicador de Atirador de Tendência Quântica       foi projetado para impulsionar sua jornada de negociação a novos patamares com sua forma inovadora de identificar reversões de tendência com precisão extremamente alta. ***C
Dragon Multi Indicator MT4
Mansour Babasafary
5 (4)
74% discount for the next 10 buyers (original price $605): 1 left Get a 50% bonus by buying (or even renting) any of our products. After buying (or renting), send a message for more information. 3 Indicators in 1 indicator Strategy based on price action Made specifically for the best forex currency pairs Can be used in the best time frame of the market at a very reasonable price This indicator is basically 3 different indicatos . But we have combined these 3 indicators in 1 indicator so th
Auto Order Block with break of structure based on ICT and Smart Money Concepts Futures Break of Structure ( BoS )             Order block ( OB )            Higher time frame Order block / Point of Interest ( POI )    shown on current chart           Fair value Gap ( FVG ) / Imbalance   ,  MTF      ( Multi Time Frame )    Volume Imbalance     ,  MTF          vIMB Gap’s Equal High / Low’s     ,  MTF             EQH / EQL Liquidity               Current Day High / Low           HOD /
Shepherd Harmonic Pattern
Abdullah Alrai
4.68 (59)
Este indicador detectará padrões harmônicos desenhados no gráfico por métodos manuais e automáticos. Você pode ver o manual do usuário neste link: Adicione sua avaliação e entre em contato conosco para obtê-lo Existe uma versão gratuita para experimentar este produto no mt4. Você pode usá-lo para detectar padrões de Gartley e Nenstar: https://www.mql5.com/en/market/product/30181 Você pode comprar a versão completa do MT4 em: https://www.mql5.com/en/market/product/15212 Notas O indicador possui u
TakePropips Donchian Trend Pro
Eric John Pajarillaga Aldana
4.82 (17)
TakePropips Donchian Trend Pro   (MT4) é uma ferramenta poderosa e eficaz que detecta automaticamente a direção da tendência usando o Canal Donchian e fornece sinais de negociação de entrada e saída! Este indicador multifuncional inclui um scanner de tendências, sinais de negociação, painel estatístico, rastreador, sessões de negociação e painel de histórico de alertas. Ele foi projetado para fornecer sinais de negociação e economizar horas analisando os gráficos! Você pode baixar o manual do us
O sistema PRO Renko é um sistema de negociação altamente preciso especialmente concebido para a negociação de gráficos RENKO. Trata-se de um sistema universal que pode ser aplicado a vários instrumentos de negociação. O sistema neutraliza eficazmente o chamado ruído de mercado, dando-lhe acesso a sinais de inversão precisos. O indicador é muito fácil de usar e tem apenas um parâmetro responsável pela geração de sinal. Você pode facilmente adaptar a ferramenta a qualquer instrumento de negoc
Scalper Vault
Oleg Rodin
5 (28)
Scalper Vault é um sistema profissional de escalpelamento que fornece tudo o que você precisa para um escalpelamento bem-sucedido. Este indicador é um sistema de negociação completo que pode ser usado por comerciantes de forex e opções binárias. O período de tempo recomendado é M5. O sistema fornece sinais de seta precisos na direção da tendência. Ele também fornece sinais superiores e inferiores e níveis de mercado Gann. Os indicadores fornecem todos os tipos de alertas, incluindo notificações
Quantum Breakout Indicator PRO
Bogdan Ion Puscasu
4.96 (26)
Apresentando       Quantum Breakout PRO   , o inovador Indicador MQL5 que está transformando a maneira como você negocia Breakout Zones! Desenvolvido por uma equipe de traders experientes com experiência em negociação de mais de 13 anos,   o Quantum Breakout PRO   foi projetado para impulsionar sua jornada comercial a novos patamares com sua estratégia inovadora e dinâmica de zona de rompimento. O Quantum Breakout Indicator lhe dará setas de sinal em zonas de breakout com 5 zonas-alvo de luc
Sacrament
owais_saadeh
4.91 (11)
Sacrament mt4- This is an indicator that includes the best basic forex indicators, without redrawing. Based on this data, a signal for sale or purchase is formed. It does not disappear anywhere after the signal, which gives us the opportunity to see the results on the history. It can be used on any currency pair, crypto metals, stocks It is best used on an hourly chart, but other periods are also acceptable. The best results for the period H1,H4,daily If customers have any questions, I w
Filtro:
Sem comentários
Responder ao comentário
Versão 3.0 2022.09.08
Mainly yellow and white arrows, supplemented by red arrows
Versão 2.0 2022.09.01
指标名称 : Keklik MA .

使用 : MA ,MACD , RSI 等技术指标 。

推荐 周期:1小时图表。

长期趋势 : EMA1,EMA2,EMA3,EMA4 均线排列方式 。均线默认值: 7,14,21,63 。 If you want a 1-minute and 5-minute chart, it is recommended to use parameters
EMA1=30;
EMA2=60;
EMA3=144;
EMA4=250;

短期趋势 : EMA1,EMA2,EMA3 均线排列方式 。

操作者类型: 超级激进者,激进者,稳健者 。 默认值 2. ( 0 稳健者: 信号均线与EMA3 交叉 , 1 激进者: 信号均线与EMA2 交叉,3 超级激进者 : 信号均线与EMA1 交叉 。 )

箭头信号:同时满足均线规则,RSI规则,MACD规则 。

箭头信号均线规则 :信号均线 与交易均线交叉。

箭头信号RSI规则 : 比较连续两条K线的RSI值。

箭头信号MACD规则 : 比较连续两条K线的MACD值。

信号均线: SiginalEMA,交易均线: EMA1 , 防守均线 :EMA2 。 默认值 : 1,7,14 。

交易提醒 :

重要提示1 :1小时图表K线 破了 EMA2 要注意行情变弱 。

重要提示2 :1小时图表K线 破了 EMA3 要注意行情反转 。

重要提示3 :打开两个1小时图表窗口一个用指数均线另一个用简单均线 。

重要提示4 :推荐使用30分钟及以上周期的图表 。

重要提示5 : EMA1,EMA2,EMA3,EMA4 贴合在一起震荡时注意最后箭头方向 。

重要提示6 :亏损时绝对不能加仓,避免单边行情扛单爆仓

重要提示7 :仔细对比主要货币对走势 。

主要货币对各个周期的走势,要参考,可以随时掌握美元指数的走势。