Vwap Bar
- Indicadores
- Jean Jacques Huve Ribeiro
- Versão: 1.7
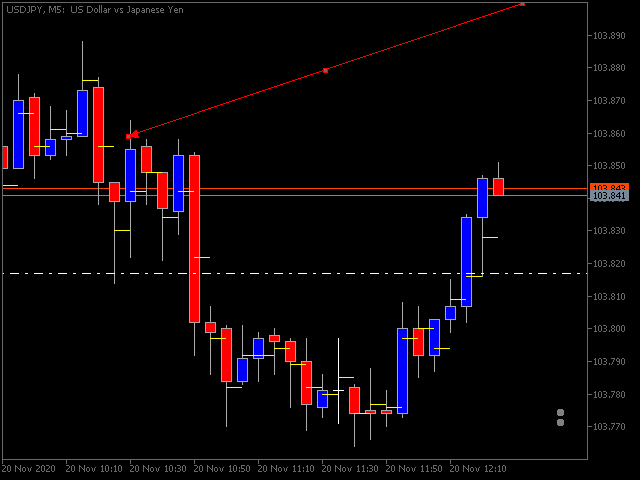
VWAP BAR
It´s power full indicator of candle by candle when lined up with greate analysis, you have great opportunity, finder defense candle. Is a good ideia from order flow method, now your meta trader 5 inside you time frame chart .
What is the Volume Weighted Average Price (VWAP)?
The volume weighted average price (VWAP) is a trading benchmark used by traders that gives the average price a security has traded at throughout the day, based on both volume and price. It is important because it provides traders with insight into both the trend and value of a security.
The Formula for the Volume Weighted Average Price (VWAP) is
VWAP is calculated by adding up the dollars traded for every transaction (price multiplied by the number of shares traded) and then dividing by the total shares traded.
\text{VWAP}=\frac{\sum\text{Price * Volume}}{\sum\text{Volume}} VWAP=∑Volume
Olá, boa tarde. Você poderia criar uma versão desse indicador de forma que eu escolho um candle específico a partir de data e hora a ser preenchido no indicador, de forma que ele marque uma linha na barra informada (data e hora)? Seria para marcar um ponto exato de entrada em order block. Fiz um estudo e esse seu indicador é de grande valia no operacional SMC, mas marcar a VWAP em todas as barras carrega o terminal e trava. Então para o gráfico ficar limpo, seria interessante customizar com essa possibilidade de informar a data e hora do candle nas configurações do indicador. Consegue criar em MT4 e MT5 também? Para mim seria interessante nas duas plataformas. Aguardo retorno, abraço!!!