• Visão global
  • Comentários
  • Discussão

Smart Heikin Ashi CompactView MTF

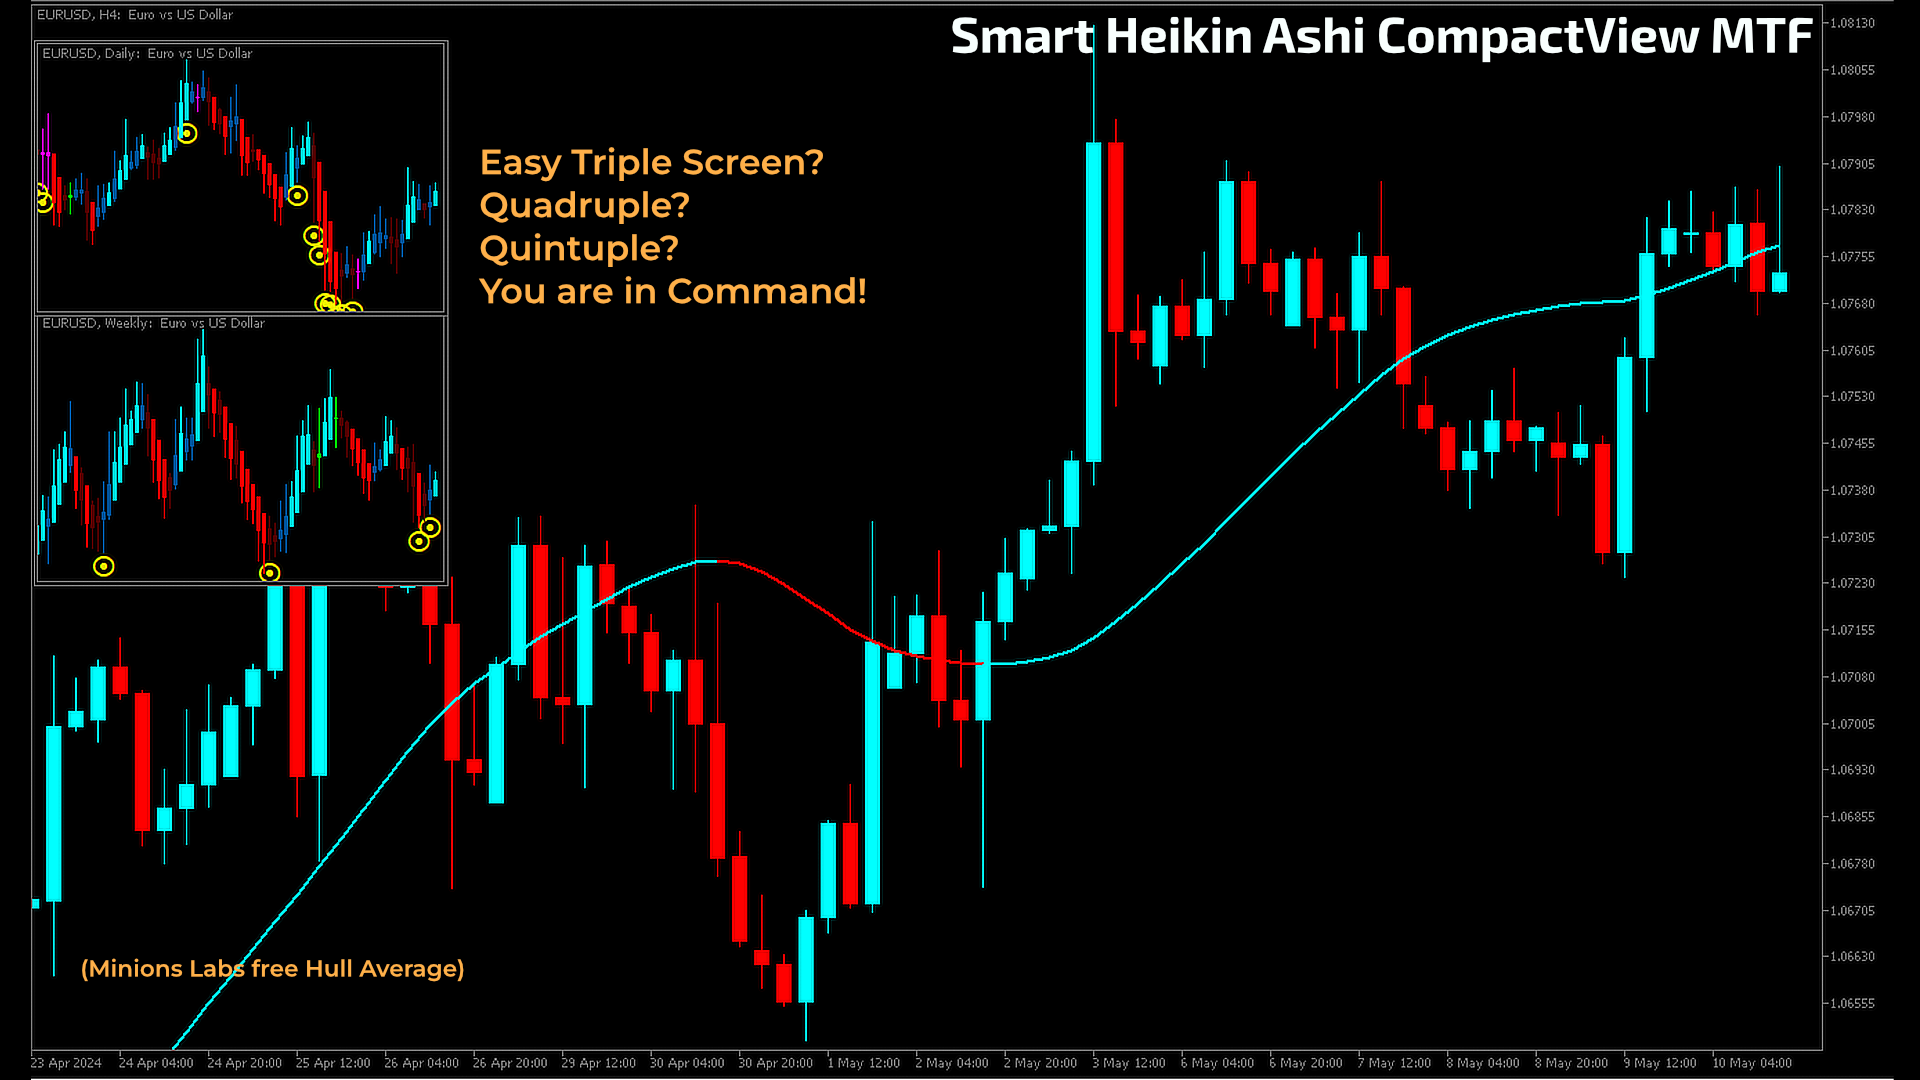
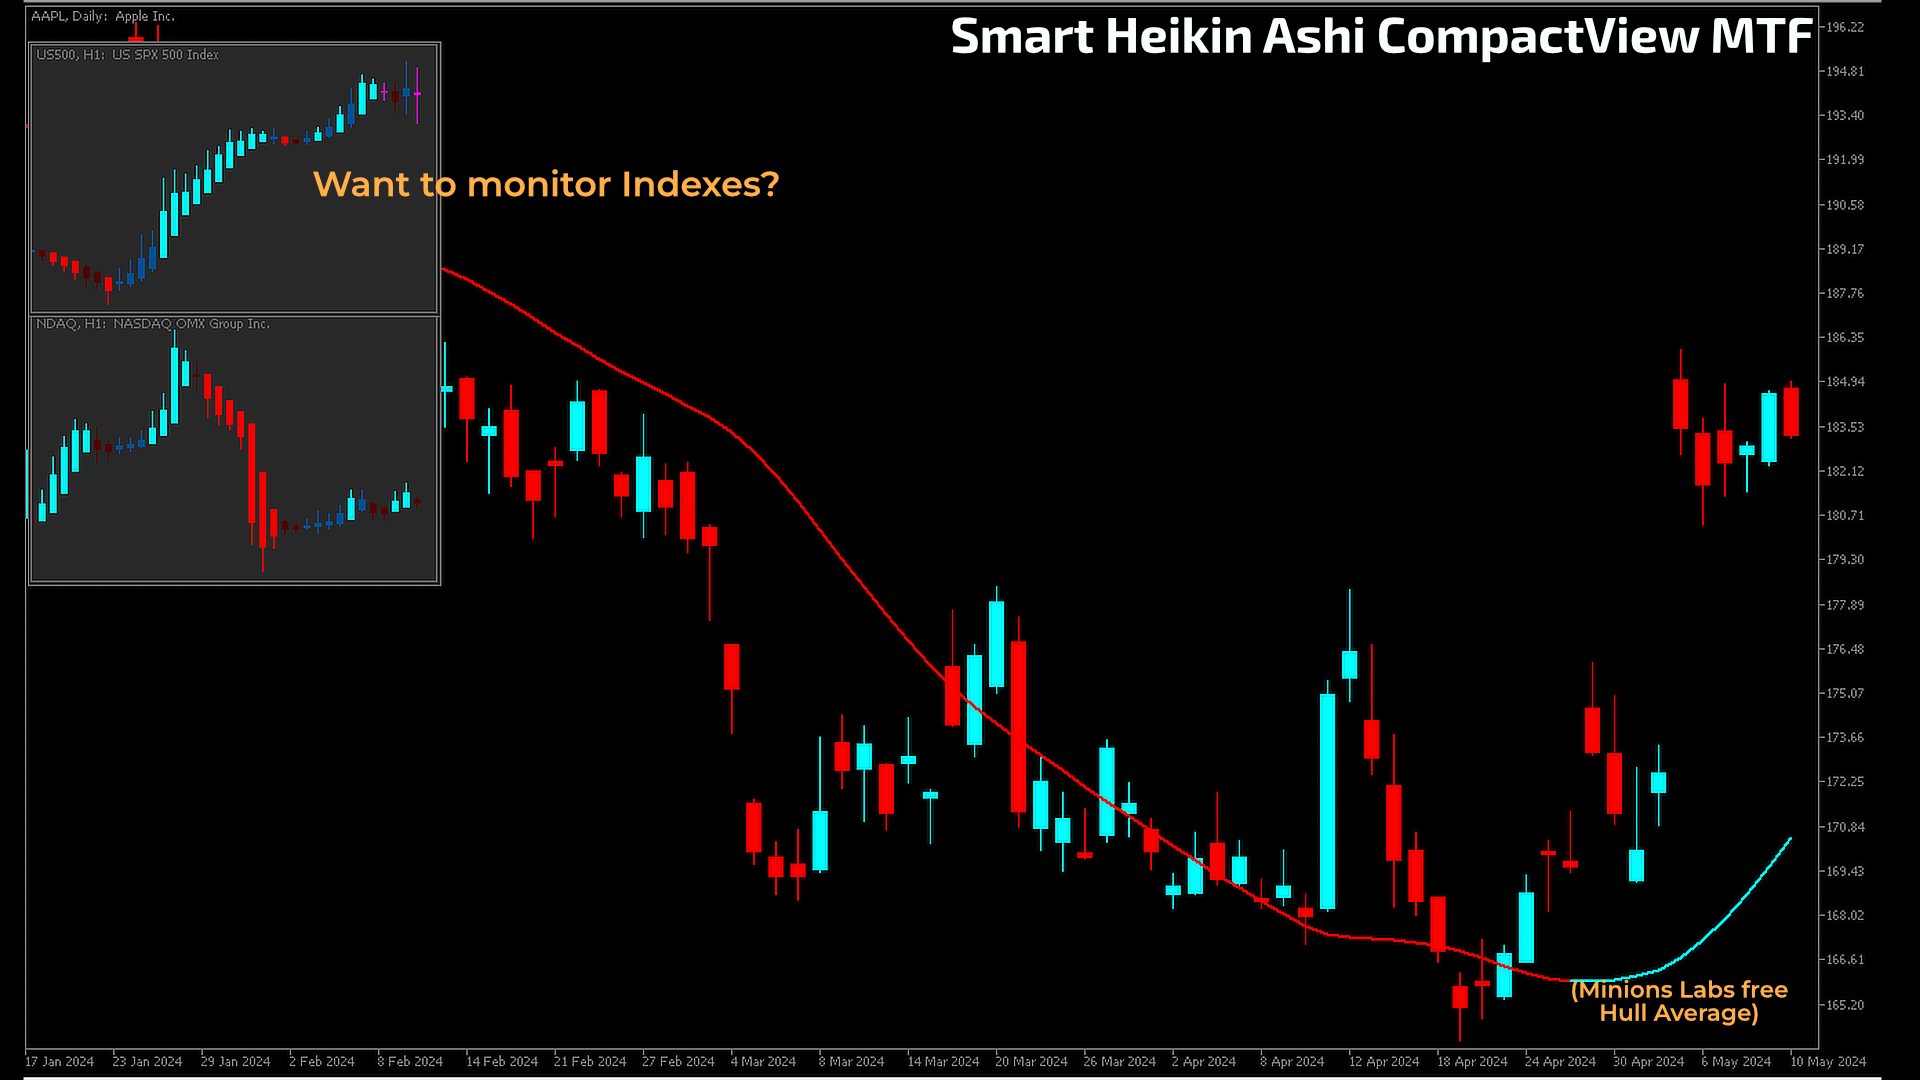
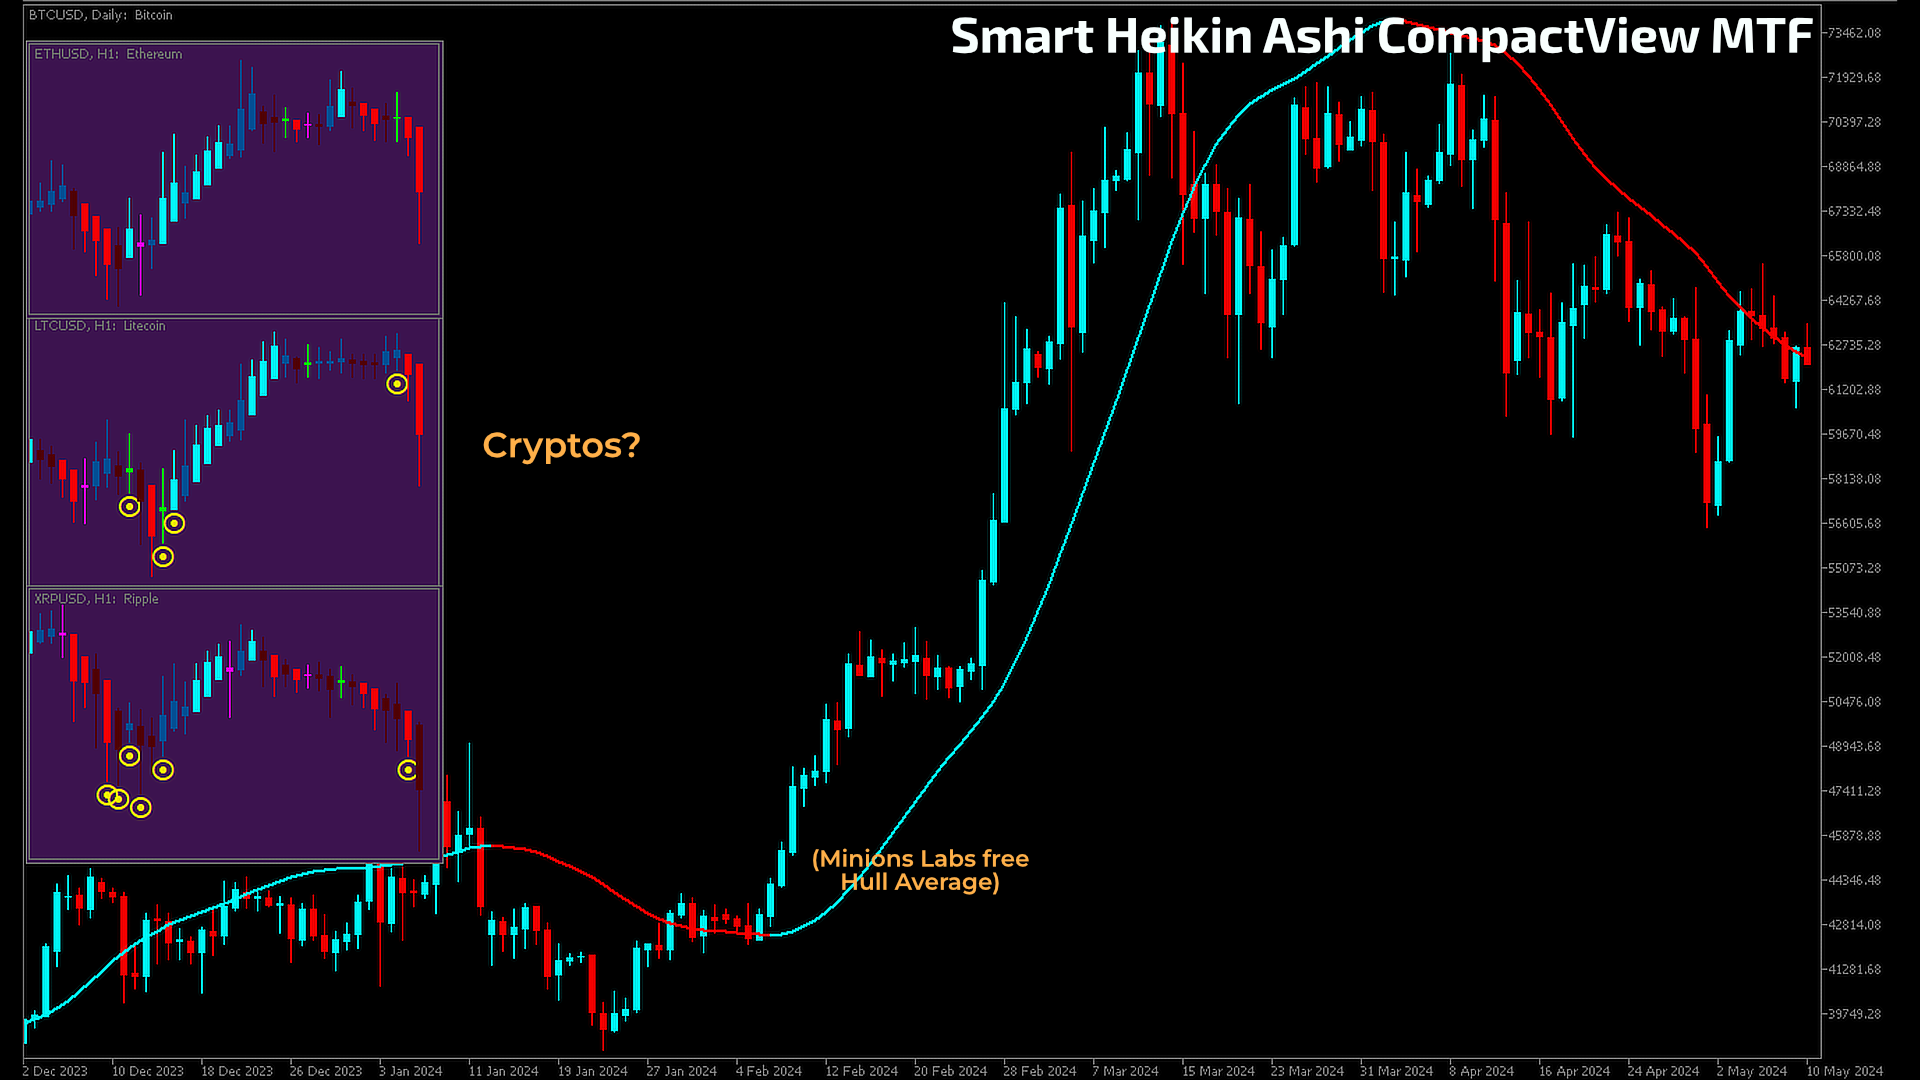
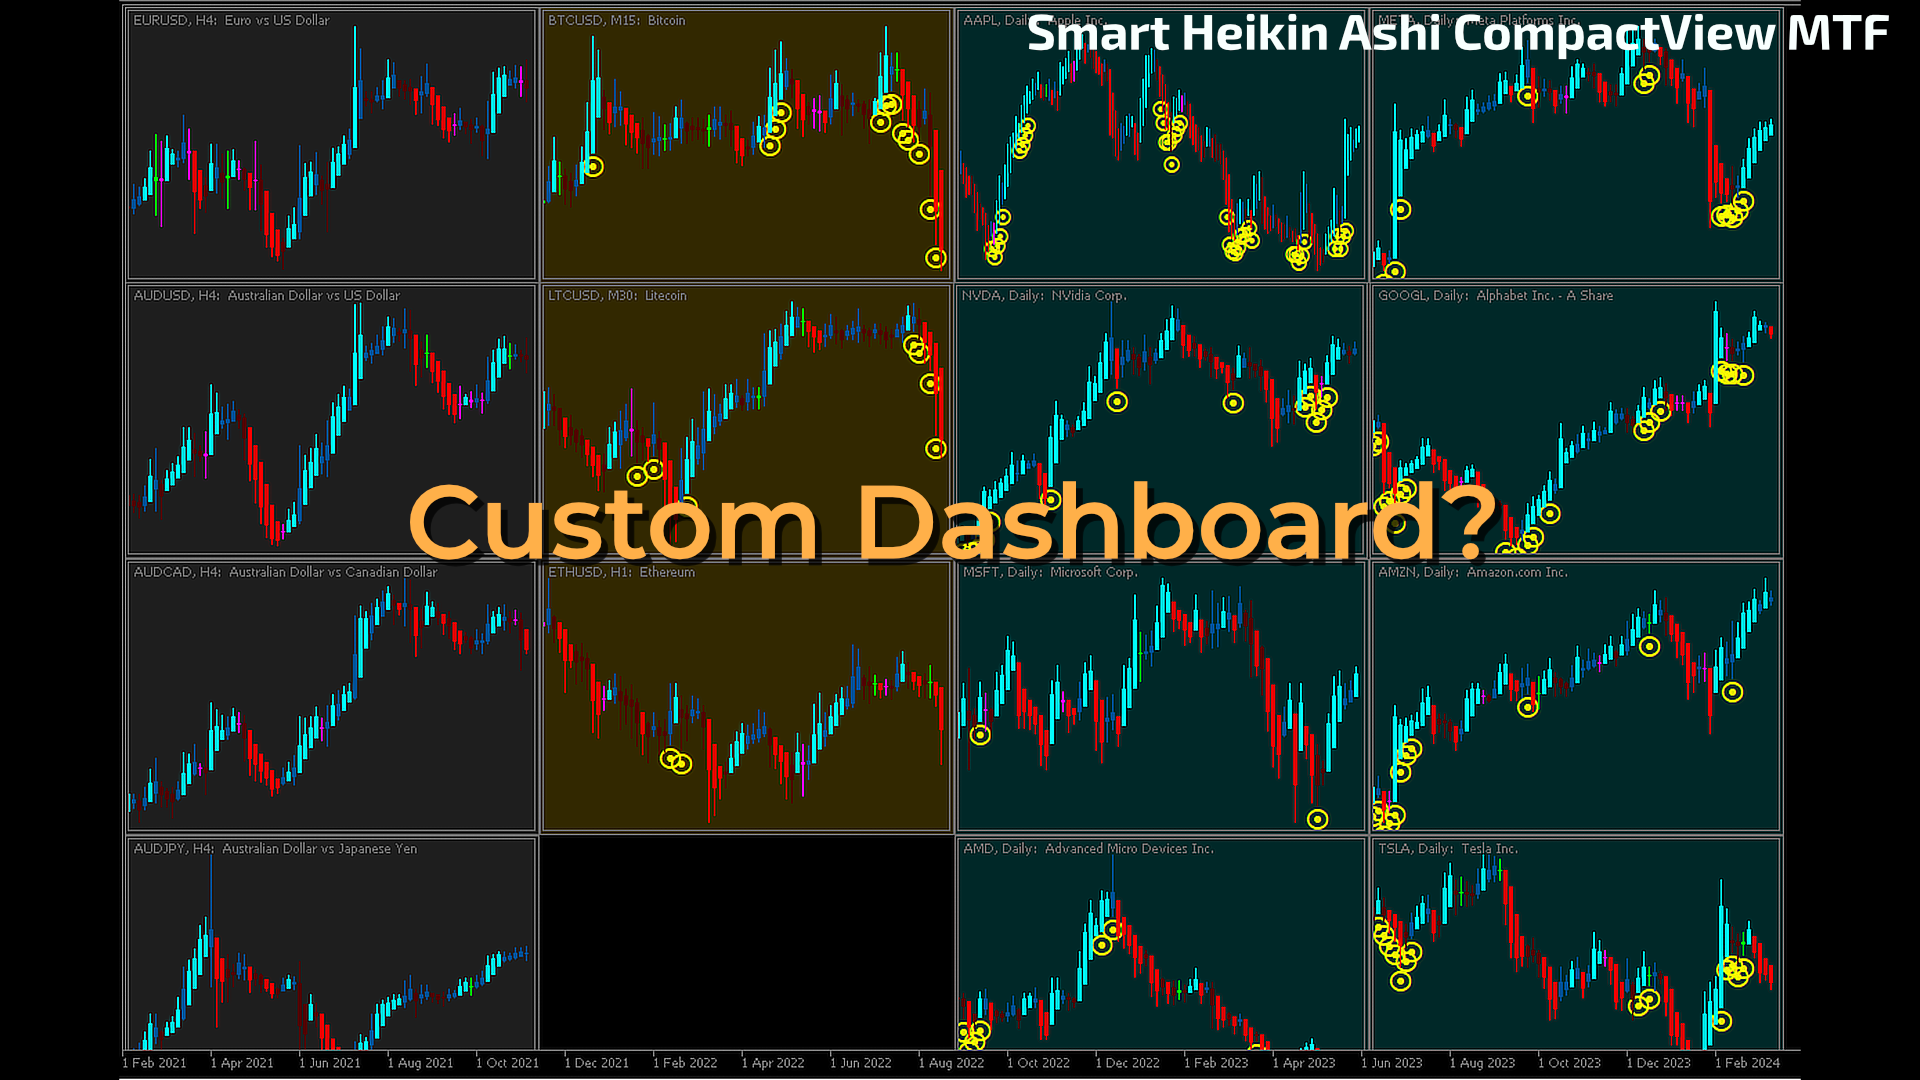
Você já é fã da ferramenta de análise de gráficos Minions Labs Smart Heikin Ashi? Ou talvez esteja procurando um gráfico Heikin Ashi versátil que funcione em múltiplos períodos de tempo? Quer ver o panorama geral antes de se aprofundar nos detalhes para tomar decisões mais inteligentes de ENTRADA? Deseja construir seu próprio Painel de Ativos dentro de apenas um ÚNICO  gráfico, sem lidar com a confusão das múltiplas janelas do MT5?

Bem-vindo ao indicador Minions Labs Smart Heikin Ashi CompactView MTF! Confira o poder deste indicador nas capturas de tela abaixo... Você ficará surpreso!


POR QUE SE IMPORTAR com o indicador Smart Heikin Ashi CompactView MTF?

O Smart Heikin Ashi é uma ferramenta inovadora que melhora sua capacidade de detectar movimentos significativos, dojis e áreas de alto volume no gráfico Heikin Ashi. Mas, adotar uma abordagem multitemporal pode ser complexo, e exibir isso em uma sub-janela nem sempre é prático, e ainda, a integração direta no gráfico principal pode se tornar confusa. Portanto, nós da Minions Labs criamos a versão CompactView do Smart Heikin Ashi!


COMO FUNCIONA o Smart Heikin Ashi CompactVIEW MTF?

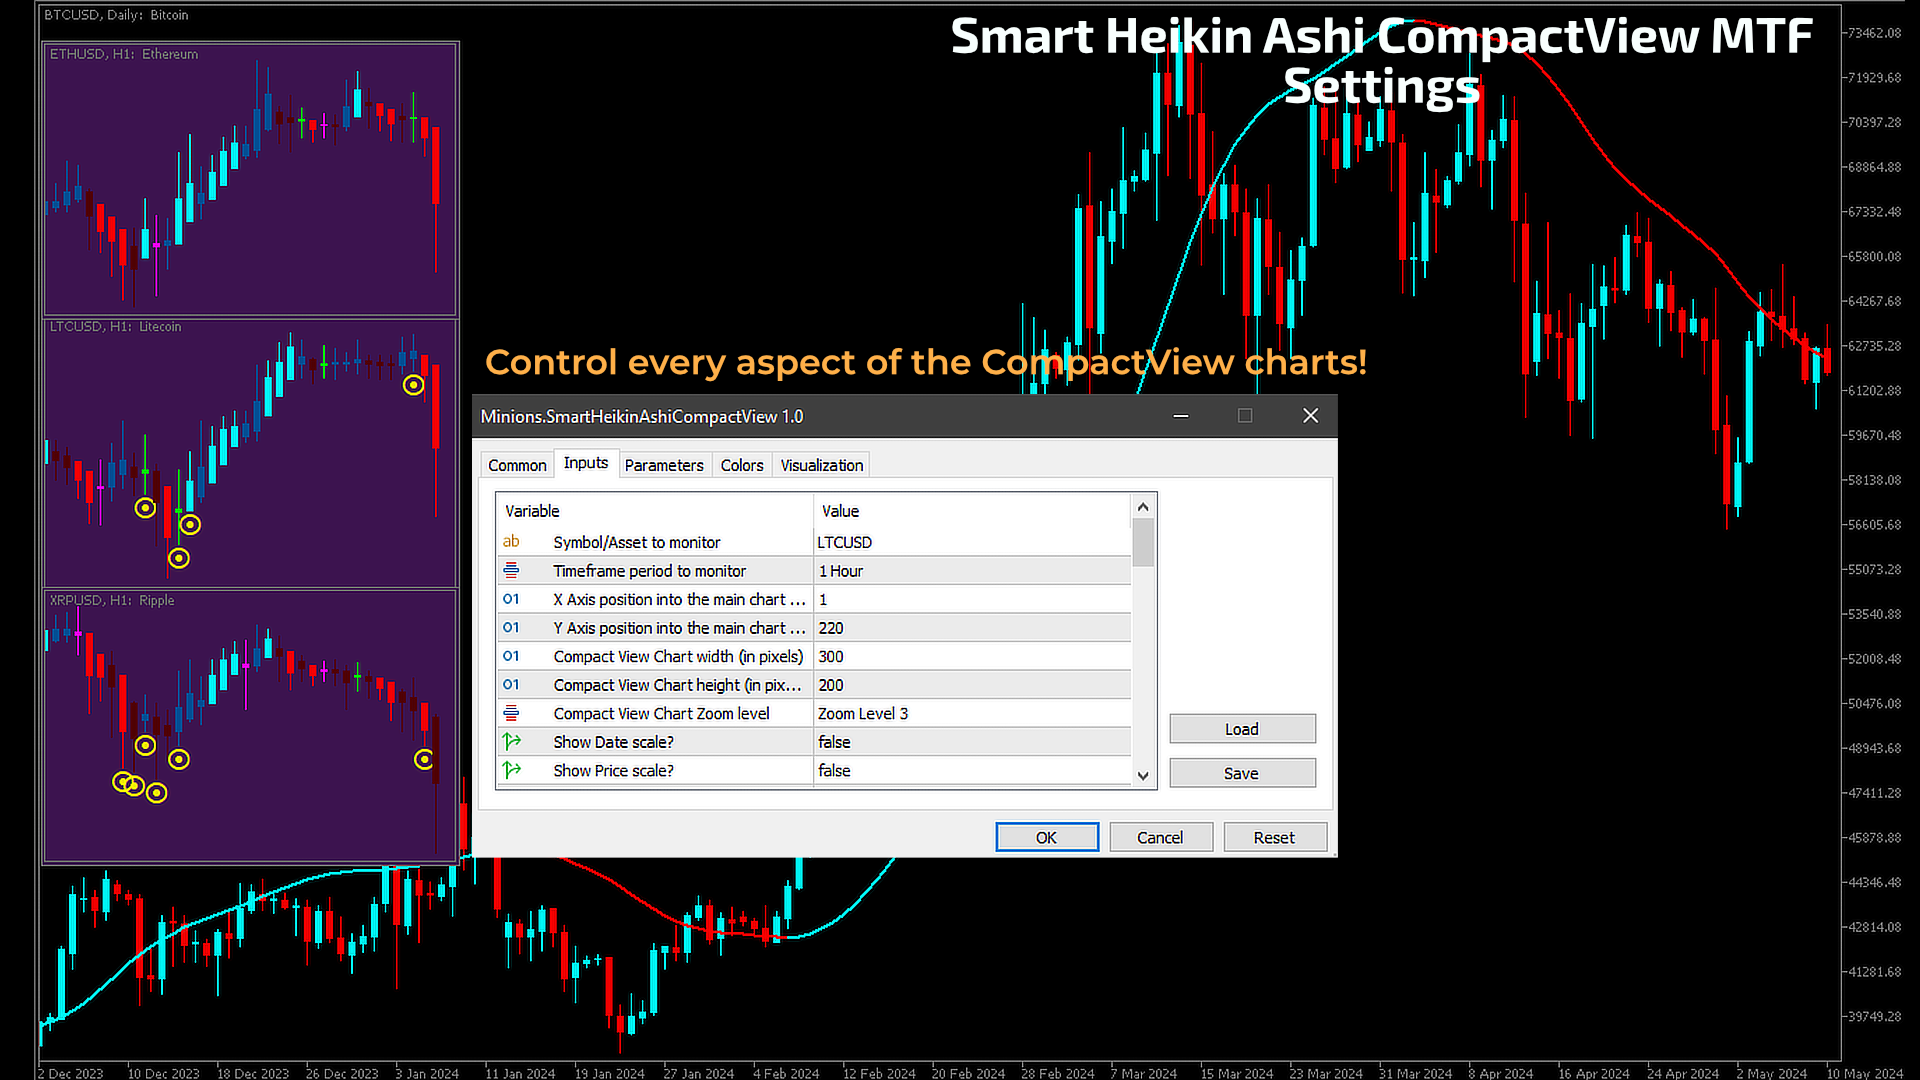
O gráfico Smart Heikin Ashi aprimora a leitura do mercado destacando movimentos fortes e potenciais pontos de reversão através de seus candlesticks Doji. Ele incorpora um alerta de alto volume diretamente no gráfico para destacar volumes de negociação significativos e oferece parâmetros personalizáveis para definir o que constitui um Doji, um movimento Forte, e um movimento Comum... O recurso CompactView permite que você defina seu próprio período de tempo no ativo em uma janela flutuante posicionada onde desejar! Personalize o tamanho e o esquema de cores para se adequar ao seu estilo de trading!

Cada aspecto deste indicador é totalmente personalizável! Legal, não é?

Sem truques no MT5! Apenas código MQL5 puro, altamente criativo e otimizado para entregar o que você precisa. Ponto final. 

Nós, da Minions Labs, levamos o MT5 aos seus limites, como você bem sabe de nossos outros produtos. E, se você ainda não nos conhece, sinta-se à vontade para visitar nossos diversos produtos, gratuitos e pagos... https://www.mql5.com/en/users/fjarabeck/seller


CONFIGURAÇÕES

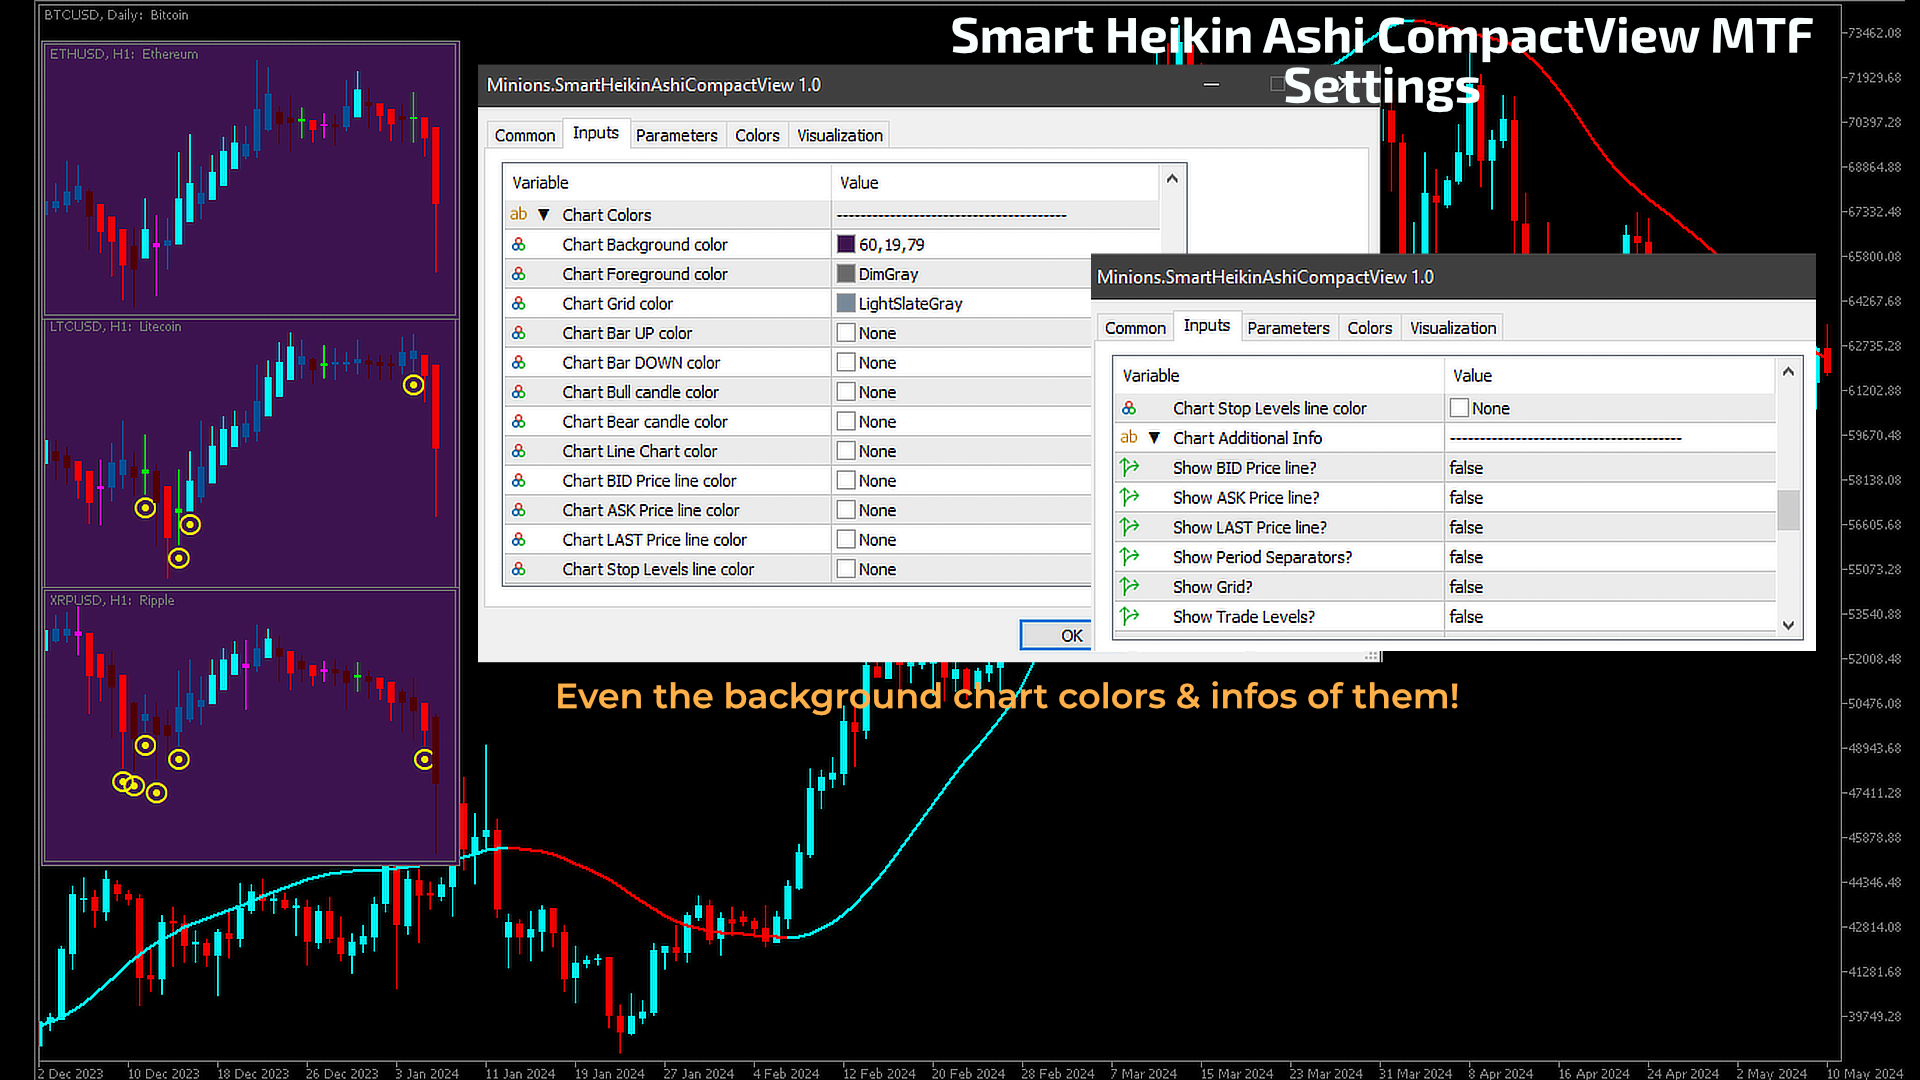
Configurações Gerais do Gráfico:

  • Cores do Gráfico: Ajuste as cores de fundo, primeiro plano, grade, barra de alta/baixa, vela de alta/baixa, gráfico de linhas, linhas de preço BID/ASK/LAST PRICE e linhas de níveis de parada.

Opções de Exibição:

  • Informações Adicionais do Gráfico: Escolha exibir linhas de preço BID, ASK, LAST PRICE.

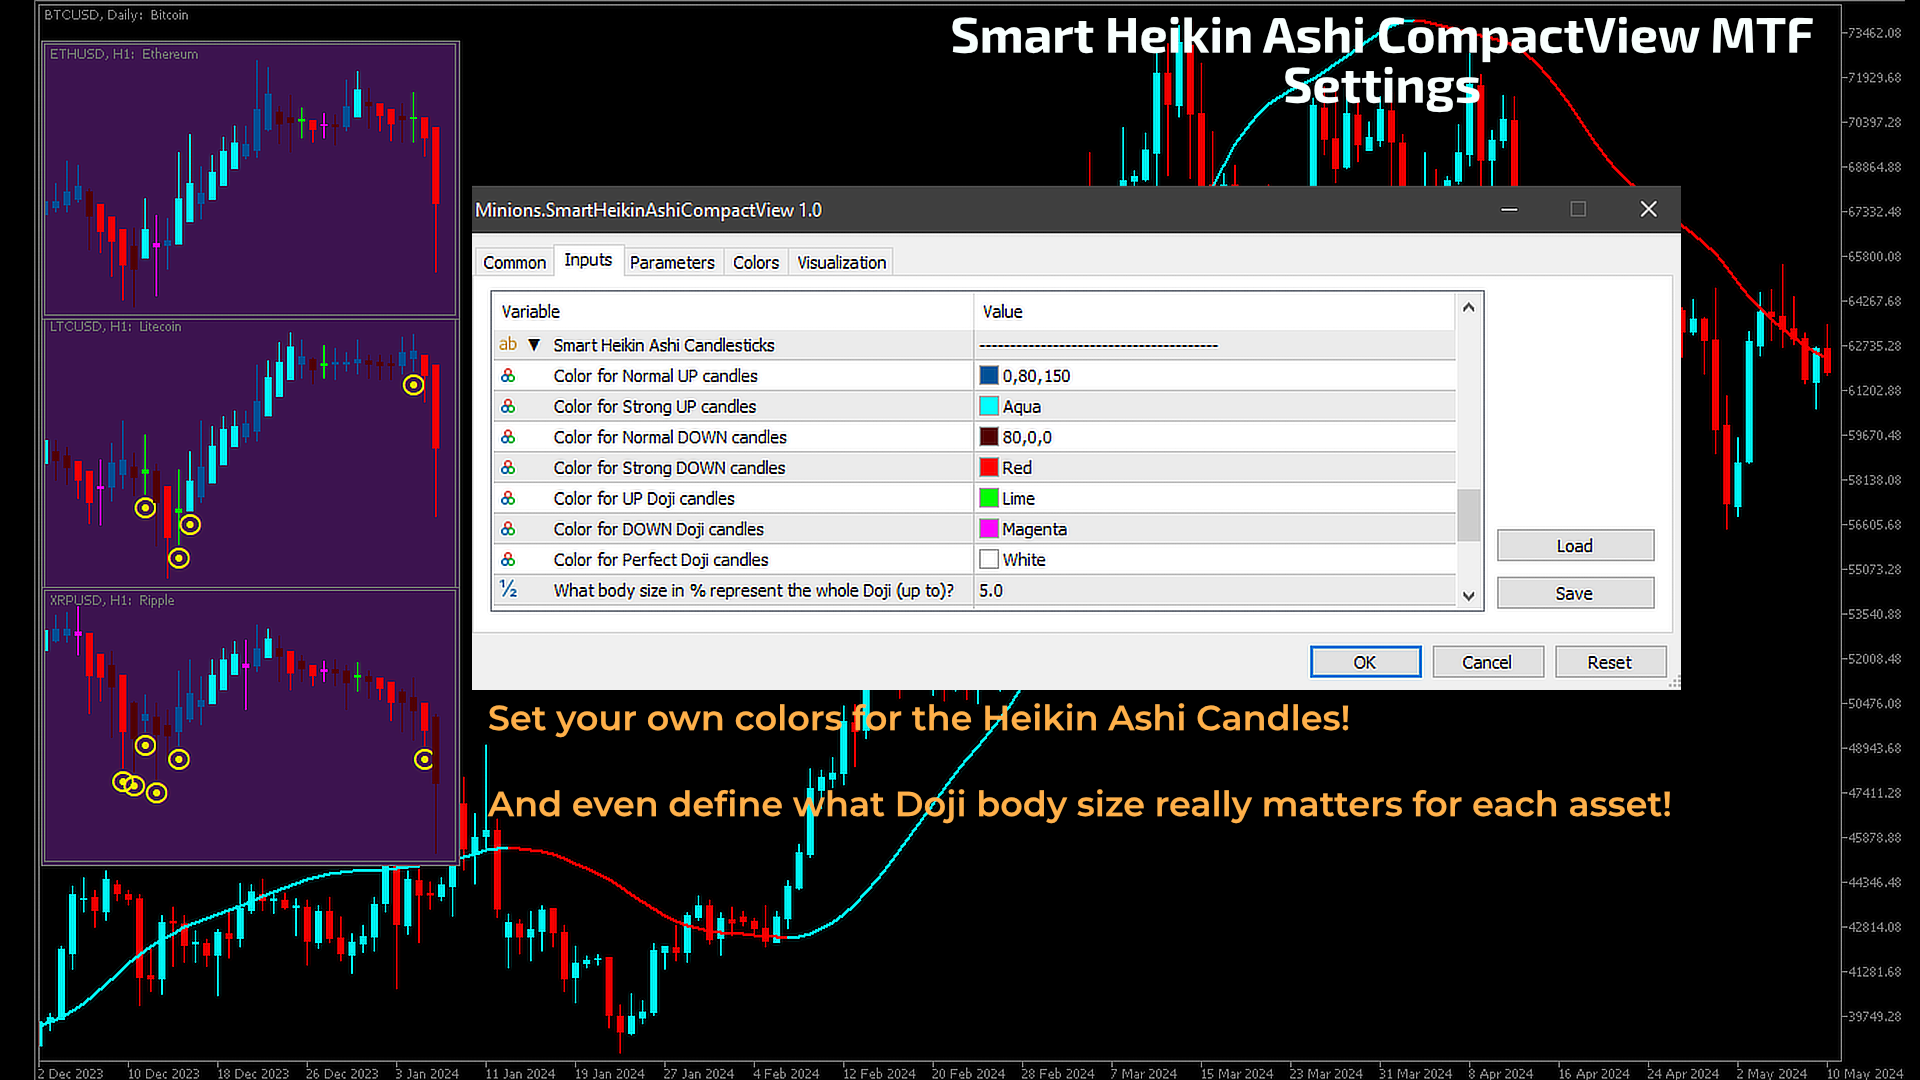
    Configurações dos Candlesticks Smart Heikin Ashi:

    • Cores dos Candlesticks: Defina as cores para Velas Normais de Alta, Alta Forte, Baixa Normal, Baixa Forte, Doji de Alta, Doji de Baixa e Doji Perfeito.
    • Configuração do Tamanho do Doji: Defina qual percentual do corpo representa uma vela Doji.
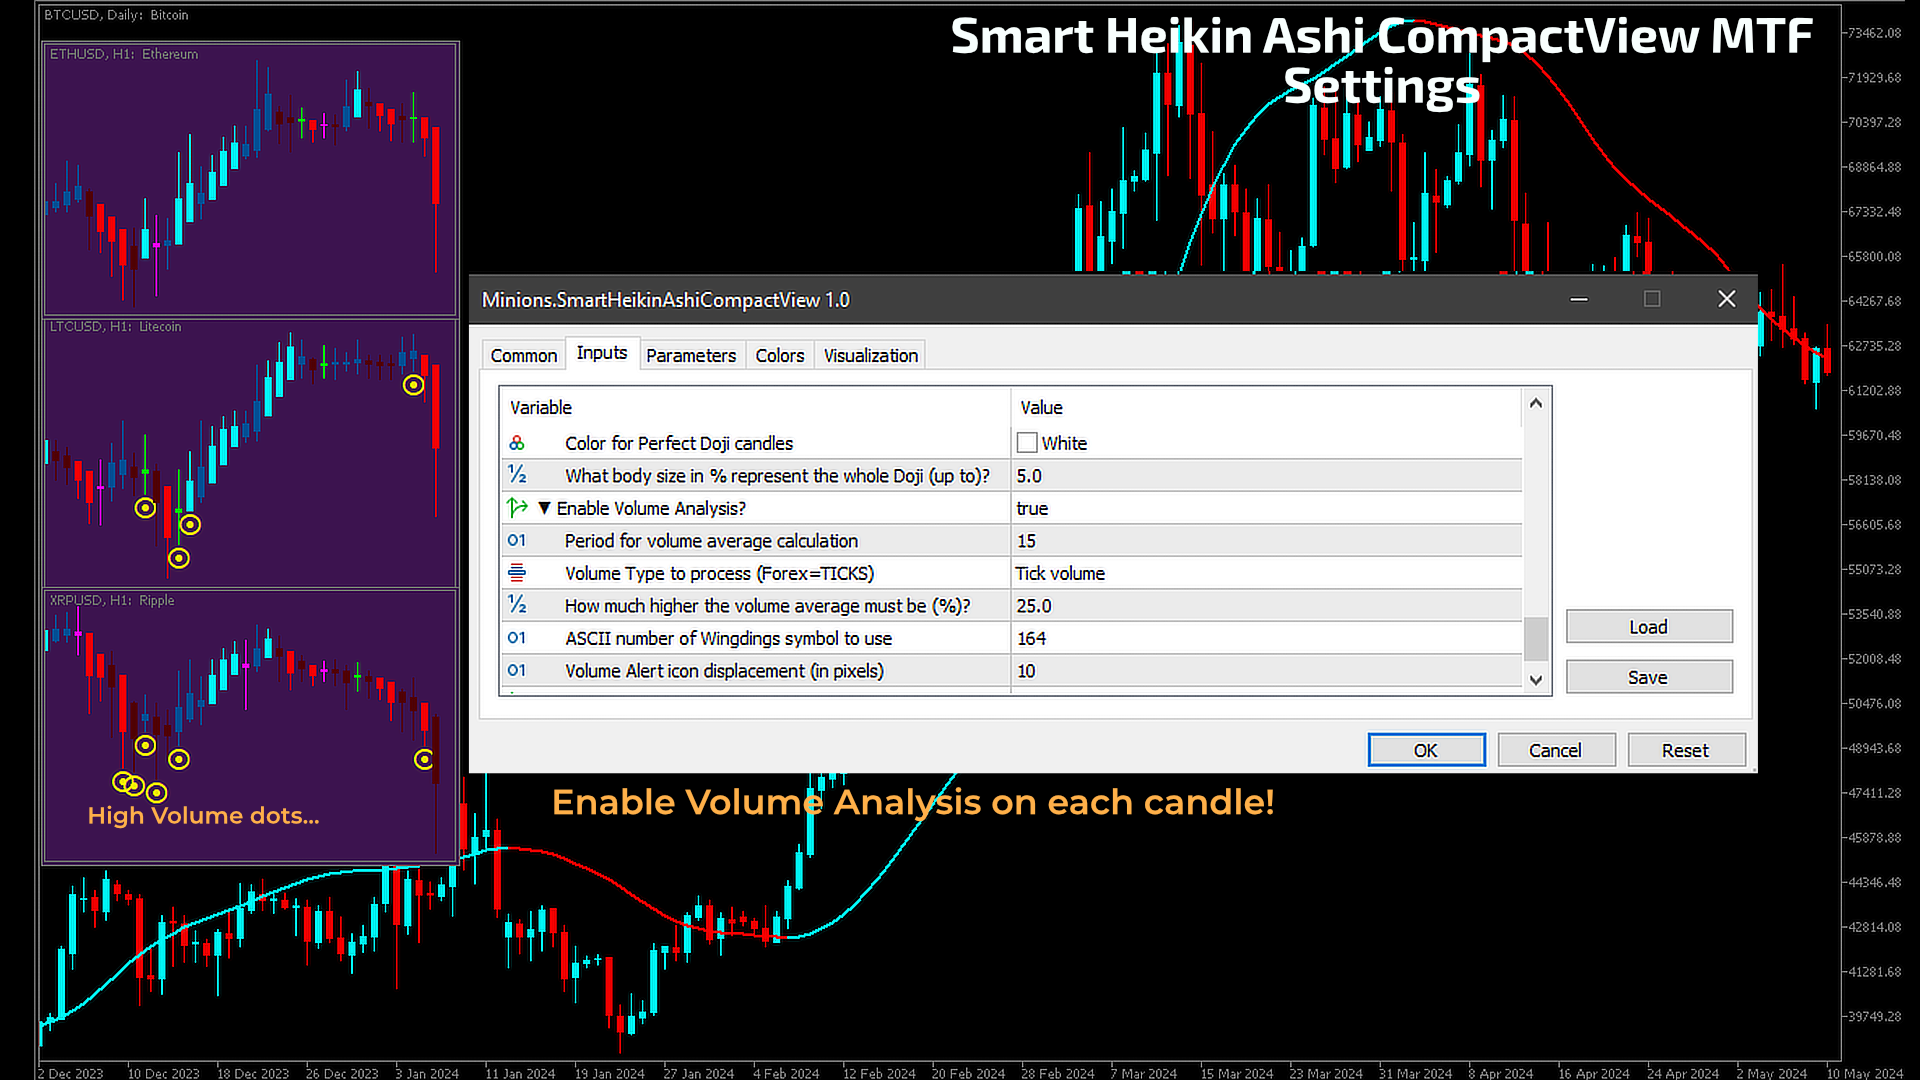
    Análise de Volume:

    • Habilitar Análise de Volume: Ative ou desative a funcionalidade de análise de volume.
    • Configurações de Volume:
      • Período para cálculo da média de volume.
      • Tipo de volume a processar (ex.: Forex=TICKS ou Volume REAL).
      • Aumento percentual necessário sobre a média de volume para alertas.
      • Número ASCII do símbolo Wingdings para alertas de volume.
      • Deslocamento do ícone de alerta em pixels.

    Diversos:

      • Mensagens de Log na aba EXPERTS: Escolha se deseja mostrar mensagens de log na aba EXPERTS.


    Não Encontrou uma Funcionalidade que Precisa?

    Nenhuma ferramenta é perfeita para todos. Se há uma funcionalidade que você está sentindo falta no Smart Heikin Ashi, não hesite em entrar em contato conosco. Sua contribuição é inestimável enquanto nos esforçamos para melhorar nossas ofertas!


    Sobre Nós

    Minions Labs, fundada por Flavio Jarabeck, está comprometida em aumentar as capacidades dos traders profissionais através de robôs de trading e indicadores avançados. Explore estratégias de ponta em diversos mercados e ativos com nossas soluções personalizadas.


    Produtos recomendados
    Gm Volumes
    Antonio Augusto Barreto De Melo
    4.2 (5)
    Um indicador de volume simples de acordo com a cor do candle! - Fundo personalizado!  - Suporta Volume por Ticks ou Volume Real. O indicador de Volume original do Metatrader não mostra as cores da barra de acordo com a cor do Candle, somente muda de cor quando um volume de um candle for maior que o anterior, isso as vezes gera confusão para os iniciantes e não sabe o real motivo da mudança de cor. Indicador grátis, talvez o suporte demore um tempo para responder!
    FREE
    O indicador mede o saldo de agressão acumulado. A fórmula é a seguinte: Acumulado = Acumulado do Candle Anterior + Volume de Compra - Volume de Venda. Conheça Nossos Produtos    ***** Gostou do produto? Então, nos ajude fazendo sua avaliação na aba " Comentário ".  ***** Nota:   Recomenda-se utilizar os valores padrões de configuração e VPS.  É necessário as informações de negociações(Time nd Sales). O indicador envia para o seu email ou celular informação quando o saldo acumulado invert
    AvgVolumes
    Marco Montemari
    5 (2)
    This indicator is based on Volumes standard indicator, calculates the average of Volumes based on the last N bars set by users, and if the value of the volume is bigger then a set % respect the average a different color will be used. The indicator is shown in a separate indicator window. This version has now a limitation in setting the % about the threshold. If you are interested to set threshold consider to buy the PRO version ( https://www.mql5.com/en/market/product/35925 ) If you want to use
    FREE
    Test Phi Cubic
    Genildo De Moura Vasconcelos
    Numa folha qualquer Eu desenho um sol amarelo E com cinco ou seis retas É fácil fazer um castelo Corro o lápis em torno da mão e me dou uma luva E se faço chover com dois riscos, tenho um guarda-chuva Se um pinguinho de tinta Cai num pedacinho azul do papel Num instante imagino uma linda gaivota a voar no céu Vai voando, contornando A imensa curva norte-sul Vou com ela viajando Havai, Pequim ou Istambul Pinto um barco à vela Branco navegando É tanto céu e mar num beijo azul Entr
    FREE
    Tick Speed Free MT5
    John Louis Fernando Diamante
    Tick Speed Free povides a on-chart label of tick speed to allow you to see the ebb and flow of market activity. Observing rises and falls in tick speed may allow you to better time entries to reduce slippage and re-quotes. Options include: - colores for low-mid-high tick speeds - placement and styling - prefix & suffix to customise the speed label Troubleshooting: - Note, in the tester environment, tick timings are limited to what is supplied by the tester environment and it's speed - If
    FREE
    Indicador Volatilidade Histórica Indicador é um oscilador que faz o plot da volatilidade histórica de um ativo, representado pelas fórmulas: Volatilidade Histórica = Raiz quadrada da média das diferenças ao quadrado * Fator de anualização. Média das diferenças ao quadrado = soma de todas as diferenças de retorno diário / número total das diferenças. Retorno diário = (preço atual - preço anterior) / preço anterior. Nesse indicador estamos utilizando os preços de fechamento de cada barra e fazemos
    FREE
    Automatic Vwap Midas
    Ricardo Almeida Branco
    5 (1)
    O Indicador 3 Automatic Vwap (Midas) pode ser usado para quem estuda Preço e Volume para mapear o movimento de quem direciona o mercado. Ele plota automaticamente 3 Vwaps sendo que duas delas são dinâmicas e vão sendo atualizadas no decorrer do dia, se novas máximas ou novas mínimas surgirem. A terceira Vwap é diária e pode ajudar se a tendência é de alta ou baixa. Ainda, foi inserido um indicador auxiliar que plota pontos de interesse (também dinâmicos) com os preços OHLC (Open, High e Low do
    Heiken Ashi DA
    Vitaly Dodonov
    4.5 (2)
    Что такое Heiken Ashi?    Heiken Ashi — это метод построения графиков, который можно использовать для прогнозирования будущего движения цены. Он похож на традиционные свечные графики. Однако в отличие от обычного свечного графика, график Heiken Ashi пытается отфильтровать часть рыночного шума для лучшего определения трендовых движений на рынке. Как рассчитать Heiken Ashi? Heiken Ashi использует формулу COHL, которая означает «Закрытие, Открытие, Максимум, Минимум». Это четыре компонента, кото
    FREE
    Value Chart Candlesticks
    Flavio Javier Jarabeck
    4.67 (9)
    The idea of a Value Chart indicator was presented in the very good book I read back in 2020 , " Dynamic Trading Indicators: Winning with Value Charts and Price Action Profile ", from the authors Mark Helweg and David Stendahl. The idea is simple and the result is pure genius: Present candlestick Price analysis in a detrended way! HOW TO READ THIS INDICATOR Look for Overbought and Oversold levels. Of course, you will need to test the settings a lot to find the "correct" one for your approach.
    FREE
    MW Volume
    Martin Bittencourt
    4 (5)
    O indicador de volume da Martinware desenha uma média móvel colorida sobre as barras de volume. A coloração usa três cores e pode ser feita de diferentes maneiras, escolhidas pelo usuário e aplicada tanto à média quanto às barras de volume. São possíveis três tipos de coloração: Nenhuma: nenhuma coloração é feita Aumentando ou diminuindo: muda a cor dependendo do valor atual ser maior ou menor que o valor anterior Volume relativo à média: as cores variam se o volume atual for maior ou menor
    FREE
    Tick Chart Monitor with countdown tick volume and easy to change tick size without going back to main chart. This work with Tick Chart Generator , which are available for download from the MQL5 Market: Tick chart generator:   https://www.mql5.com/en/market/product/79763 NOTE: Custom symbols on MT5 are not directly tradable. This is by Metatrader5 design. If you want to place trades directly on the custom symbol generated by this product, you will either need a trade panel that offers this functi
    FREE
    Waves Sizer
    Flavio Javier Jarabeck
    3.67 (6)
    Wyckoff fans, enjoy! Ideally to be used with the Weis Waves indicator, but it can be easily used alone, the Waves Sizer puts the range (in resulting Price movement) done by the Price on its market swings. You can control how accurate or loose will be the swings. This tool is very helpful for visually know how much the Price has traveled in your Timeframe. This way you can confront this level of effort with the resulting Volume, etc... Weis Waves indicator: https://www.mql5.com/en/market/pro
    FREE
    Este simples indicador pinta de uma cor mais escura a barra do     quando a quantidade negociada no candle fica acima a média selecionada de períodos do próprio     , apresentando desta forma os momentos aonde houve um grande     de negociações acima da média. É possível também utilizar uma configuração de 4 cores aonde a tonalidade da cor demonstra a força do volume do candle. O padrão do indicador é a média simples de 20 períodos, mas é possível alterar para outros tipos de médias e pe
    FREE
    Aggression Volume
    Flavio Javier Jarabeck
    3.86 (21)
    O Indicador de Volume de Agressão é o tipo de indicador que raramente é encontrado na comunidade MQL5 porque não é baseado nos dados de Volume padrão fornecidos pela plataforma Metatrader 5. Ele requer a análise de todos os Ticks de tráfego solicitados na plataforma... Dito isso, o indicador de Volume de Agressão solicita todos os Dados de Tick do seu Broker e os processa para construir uma versão muito especial de um Indicador de Volume, onde as agressões de Compradores e Vendedores são plotada
    FREE
    Smart Depth Of Market
    Evgeny Shevtsov
    4.2 (20)
    The indicator displays the orders book, as well as increases its depth, remembering the location of orders that have gone beyond the current "window" view. Indicator capability Display the levels of open positions. Simulation of placing/cancelling/editing pending orders directly in the displayed orders book. Indicator features The orders book display works only on those trading symbols for which it is broadcast by the broker. To reset the information about the rows that were recorded in the
    FREE
    White Weis Volume Ticks
    Ricardo Almeida Branco
    5 (3)
    White Weis Volume Este indicador mostra o somatório do volume em cada onda, bulish ou bearish, conforme idealizado por David Weis, mas traz um importante adicional que é a marcação da barra de maior volume da onda (White Bar)! Na codificação do indicador, foi buscado otimizar o código para exigir o mínimo processamento durante o uso e não sobrecarregar o mt5. O indicador pode ser usado para análise e estudo pré pregão, onde o trader analisa possíveis pontos de suporte e resistência com
    VP hidden
    Emr Aljnaby
    5 (6)
    The indicator works to convert normal volume into levels and determine financial liquidity control points. It is very similar in function to Fixed Volume Profile. But it is considered more accurate and easier to use than the one found on Trading View because it calculates the full trading volumes in each candle and in all the brokers present in MetaTrade, unlike what is found in Trading View, as it only measures the broker’s displayed prices. To follow us on social media platforms: tel
    FREE
    Bar Countdown
    Mario Antonio Oliveira
    4.8 (5)
    Bar Countdown é um simples indicador para MetaTrader 5 que mostra o tempo restante de cada vela. Ele pode ser colocado em qualquer canto do gráfico ou perto do fechamento de preço. Escolha o formato do contador entre HR:MIN:SEC ou MIN:SEC É muito fácil de usar, configure a cor, o tamanho e a posição no gráfico do contador e pronto!!! A contagem regressiva começa agora! Atualizações: 28/02/2021; v1.0: Versão inicial 16/03/2021; v1.1: Pequenas alterações no código                            
    FREE
    A Média Móvel é um indicador que faz parte da Análise Técnica. Com ela, é possível identificar o equilíbrio dos preços no mercado, observando tendências de alta, neutra ou baixa. Este indicador customizado traz opções extras pera definir o método de cálculo podendo-se esclolher entre SMA,EMA,SSMA,LWMA,JJMA,JurX,ParMA,T3,Vidya,AMA,HULL MA. Também conta com varias opções para escolher o método de cálculo para o preço base a ser usado no cáculo da média.
    The Volume Weighted ATR indicator is a helpful tool for measuring market activity. It is based on the idea of the Volume-Weighted ATR. Combining these two elements helps identify potential turning points or breakout opportunities. The indicator for the classification of the activity of the market uses the moving average and its multiples. Accordingly, where the VWATR bar is located (relative to the moving average), it is labelled as ultra-low, low, average, high, very high or ultra high. The Vo
    FREE
    Volume Candlestick Bars
    Henrique Helmuth Kreutz Pfeifer
    Indicador que forma barras (candlesticks) com uma amostragem diferente da fixa por tempo. Utiliza dados em tempo real e pode ser usado como substituto do gráfico padrão. Cada barra é formada quando uma certa quantidade de contratos é negociada, devolvendo ao usuário os valores OHLC do agrupamento. Caso a corretora não forneça os dados de volume real por negociação, o indicador não funcionará. Pois é nesse parâmetro que a premissa é baseada. Dessa forma, o preço de um ativo é melhor amostrado,
    FREE
    Market Profile 3 ForexArby com
    Hussien Abdeltwab Hussien Ryad
    4.17 (12)
    Market Profile 3 MetaTrader 5 indicator  version 4.70— is a classic Market Profile implementation that can show the price density over time, outlining the most important price levels, value area, and control value of a given trading session. This indicator can be attached to timeframes between M1 and D1 and will show the Market Profile for daily, weekly, monthly, or even intraday sessions. Lower timeframes offer higher precision. Higher timeframes are recommended for better visibility. It is als
    FREE
    BoxInside MT5
    Evgeny Shevtsov
    5 (4)
    This indicator calculates the volume profile and places labels that correspond to the VAH, VAL and POC levels, for each candle individually. Indicator operation features The indicator works on the timeframes from M3 to MN, but it uses the history data of smaller periods: M1 - for periods from M3 to H1, M5 - for periods from H2 to H12, M30 - for the D1 period, H4 - for the W1 period, D1 - for the MN period. The color and location of the VAL, VAH and POC labels on the current candle are consider
    FREE
    BoletaMiniPanel
    PATRICK ANTONIO MORELO A.
    5 (5)
    Boleta simples com Stop loss (Loss), Stop gain (Gain), Trailing stop (TS) e Breakeven (BE-P). O Lot é o número de contratos a serem negociados. Gain é o número, em pontos, que será posicionado o stop gain. Caso não queira colocar stop gain, é só colocar 0 (zero) no lugar e quando abrir a ordem ela não terá esse stop. Loss é o número, em pontos, que será posicionado o stop loss. Caso não queira colocar stop loss, é só colocar 0 (zero) no lugar e quando abrir a ordem ela não terá esse stop. TS é o
    FREE
    The indicator enables very quick orientation in the market phase (re/accumulation, re/distribution, up/down trend). It is counted only from price data (without volume). It is based on the assumptions of Wyckoff's law of Causa and Effect. Oscillations are an expression of the level of market uncertainty and point to the presence of Big Money. Such a "storm" is followed by a calmer trend that needs to be exited. You need to use other tools or shorter period of the same indicator for that. I kee
    Ticks Bars
    Andrej Nikitin
    4 (6)
    This tick indicator draws synthetic bars/candlesticks that contain a definite number of ticks. Parameters: option prices - price option. It can be Bid, Ask or (Ask+Bid)/2. the number of ticks to identify Bar - number of ticks that form OHLC. price levels count - number of displayed price levels (no levels are displayed if set to 0 or a lower value). calculated bar  - number of bars on the chart. Buffer indexes: 0 - OPEN, 1 - HIGH, 2 - LOW, 3 - CLOSE.
    FREE
    Este indicador irá espelhar os ativos em uso em outro metatrader, podendo escolher o timeframe e um template. Esta é a versão Cliente MT5, e precisa da versão Server do Metatrader 4 ou 5: Metatrader 4 Mirror Chart Server:  https://www.mql5.com/en/market/product/88644 Metatrader 5 Mirror Chart Server:   https://www.mql5.com/en/market/product/88652 Detalhes de como funciona no vídeo.
    FREE
    Weis Waves
    Flavio Javier Jarabeck
    3.15 (26)
    The original author is David Weis, an expert in the Wyckoff Method. The Weis Wave is a modern adaptation of the 1930's Wyckoff Method, another expert in Tape Reading techniques and Chart Analysis. Weis Waves takes market volume and stacks it into waves according to price conditions giving the trader valuable insights about the market conditions. If you want to learn more about this subject you can find tons of videos in YouTube. Just look for "The Wickoff Method", "Weis Wave" and "Volume Spread
    FREE
    DALA Forecast
    Grigorii Matsnev
    About the indicator: DALA Forecast is a universal tool for predicting the dynamics of time series of any nature. For prediction, modified methods of nonlinear dynamics analysis are used, on the basis of which a predictive model is built using machine learning methods.  To get the trial version of the indicator, you can contact me in private messages. How to use the indicator: Apply the indicator to your chosen financial instrument or indicator with the settings you need. The prediction will b
    FREE
    Trend follow by volume verification
    OTAVIO AGUIAR CAMPOS Aguiar
    3 (3)
    O Indicador valida a força da tendência utilizando o volume negociado. Os candles são mostrados na cor verde indicando força compradora e cor vermelha na força vendedora. O movimento é encerrado pelo SAR parabólico. Vantagens: Filtra distorções de preço sem volume financeiro; Filtra consolidações e movimentos laterais; Filtra divergências de volume pelo indicador Money Flow. Desvantagens: Não filtra todos os falsos rompimentos, visto que rompimentos importantes geram altos volumes financeiros; N
    FREE
    Os compradores deste produto também adquirem
    Atomic Analyst MT5
    Issam Kassas
    5 (13)
    Primeiramente, vale ressaltar que este Indicador de Negociação não repinta, não redesenha e não apresenta atrasos, tornando-o ideal tanto para negociação manual quanto automatizada. Manual do utilizador: configurações, entradas e estratégia. O Analista Atômico é um Indicador de Ação de Preço PA que utiliza a força e o momentum do preço para encontrar uma vantagem melhor no mercado. Equipado com filtros avançados que ajudam a remover ruídos e sinais falsos, e aumentam o potencial de negociação.
    Primeiramente, vale ressaltar que este Sistema de Trading é um Indicador Não Repintado, Não Redesenho e Não Atrasado, o que o torna ideal tanto para o trading manual quanto para o automatizado. Curso online, manual e download de predefinições. O "Sistema de Trading Inteligente MT5" é uma solução completa de trading projetada para traders novos e experientes. Ele combina mais de 10 indicadores premium e apresenta mais de 7 estratégias de trading robustas, tornando-o uma escolha versátil para dive
    Reversal First Impulse levels (RFI)      INSTRUCTIONS        RUS       -       ENG              R ecommended to use with an indicator   -   TREND PRO -  Version MT4                 A key element in trading is zones or levels from which decisions to buy or sell a trading instrument are made. Despite attempts by major players to conceal their presence in the market, they inevitably leave traces. Our task was to learn how to identify these traces and interpret them correctly. Main functions:: Di
    TPSpro TRENDPRO  - is a trend indicator that automatically analyzes the market and provides information about the trend and each of its changes, as well as giving signals for entering trades without redrawing! The indicator uses each candle, analyzing them separately. referring to different impulses - up or down impulse. Exact entry points into transactions for currencies, crypto, metals, stocks, indices!  -  Version MT4               DETAILED DESCRIPTION               R ecommended to use with
    Bill Williams Advanced
    Siarhei Vashchylka
    5 (5)
    Bill Williams Advanced is designed for automatic chart analysis using Bill Williams' "Profitunity" system. The indicator analyzes four timeframes at once. Manual (Be sure to read before purchasing) Advantages 1. Automatically analyzes the chart using the "Profitunity" system of Bill Williams. The found signals are placed in a table in the corner of the screen. 2. Equipped with a trend filter based on the Alligator indicator. Most of the system signals are recommended to be used only accordi
    FX Volume MT5
    Daniel Stein
    4.94 (17)
    Receba a sua atualização diária do mercado com detalhes e screenshots através do nosso Morning Briefing aqui no mql5 e no Telegram ! O Volume FX é o PRIMEIRO e ÚNICO indicador de volume que fornece uma visão REAL do sentimento do mercado do ponto de vista de um corretor. Ele fornece uma visão incrível de como os participantes do mercado institucional, como corretores, estão posicionados no mercado Forex, muito mais rápido do que os relatórios COT. Ver essas informações diretamente no seu gráfi
    Quantum Trend Sniper
    Bogdan Ion Puscasu
    5 (39)
    Apresentando       Quantum Trend Sniper Indicator   , o inovador Indicador MQL5 que está transformando a maneira como você identifica e negocia as reversões de tendência! Desenvolvido por uma equipe de traders experientes com experiência comercial de mais de 13 anos,       Indicador de Atirador de Tendência Quântica       foi projetado para impulsionar sua jornada de negociação a novos patamares com sua forma inovadora de identificar reversões de tendência com precisão extremamente alta. ***C
    Trend Screener Pro MT5
    STE S.S.COMPANY
    4.87 (62)
    Desbloqueie o poder da negociação de tendências com o indicador Trend Screener: sua solução definitiva de negociação de tendências, alimentada por lógica difusa e sistema de múltiplas moedas! Eleve sua negociação de tendências com o Trend Screener, o revolucionário indicador de tendências alimentado por lógica difusa. É um poderoso indicador de acompanhamento de tendências que combina mais de 13 ferramentas e recursos premium e 3 estratégias de negociação, tornando-o uma escolha versátil para to
    RelicusRoad Pro MT5
    Relicus LLC
    4.82 (22)
    Agora US $ 147 (aumentando para US $ 499 após algumas atualizações) - Contas ilimitadas (PCs ou Macs) Manual do usuário do RelicusRoad + vídeos de treinamento + acesso ao grupo de discórdia privado + status VIP UMA NOVA FORMA DE OLHAR PARA O MERCADO O RelicusRoad é o indicador de negociação mais poderoso do mundo para forex, futuros, criptomoedas, ações e índices, oferecendo aos traders todas as informações e ferramentas necessárias para se manterem rentáveis. Fornecemos análises técnica
    IVISTscalp5
    Vadym Zhukovskyi
    5 (3)
    Apresentamos a você o indicador iVISTscalp5, que não é apenas único, mas também eficaz em operações de negociação. Este indicador é baseado em dados de tempo e é o resultado de muitos anos de experiência e análise aprofundada dos mercados financeiros. O indicador iVISTscalp5 é uma excelente ferramenta para negociação manual. Conveniência, simplicidade e visualização - toda a complexidade está escondida dentro dele. Simplificamos as configurações e o uso do indicador iVISTscalp5 ao máximo. O indi
    ICT, SMC, SMART MONEY CONCEPTS, SMART MONEY, Smart Money Concept, Support and Resistance, Trend Analysis, Price Action, Market Structure, Order Blocks, BOS/CHoCH,   Breaker Blocks ,  Momentum Shift,   Supply&Demand Zone/Order Blocks , Strong Imbalance,   HH/LL/HL/LH,    Fair Value Gap, FVG,  Premium  &   Discount   Zones, Fibonacci Retracement, OTE, Buy Side Liquidity, Sell Side Liquidity, BSL/SSL Taken, Equal Highs & Lows, MTF Dashboard, Multiple Time Frame, BigBar, HTF OB, HTF Market Structure
    Este é sem dúvida o indicador de reconhecimento automático de formação de preço harmônico mais completo que você pode encontrar para a MetaTrader Platform. Ele detecta 19 padrões diferentes, leva as projeções de Fibonacci tão a sério quanto você, exibe a Zona de Reversão Potencial (PRZ) e encontra níveis adequados de stop loss e take-profit. [ Guia de instalação | Guia de atualização | Solução de problemas | FAQ | Todos os produtos ] Detecta 19 formações harmônicas de preços diferentes Tr
    Advanced Supply Demand MT5
    Bernhard Schweigert
    4.53 (15)
    Atualmente com 33% de desconto! A melhor solução para qualquer Trader Novato ou especialista! Este indicador é uma ferramenta de negociação exclusiva, de alta qualidade e acessível porque incorporamos uma série de recursos proprietários e uma nova fórmula. Com esta atualização, você poderá mostrar fusos horários duplos. Você não só será capaz de mostrar um TF mais alto, mas também mostrar ambos, o TF do gráfico, MAIS o TF mais alto: MOSTRANDO ZONAS ANINHADAS. Todos os traders de Oferta e Demanda
    Dragon Multi Indicator MT5
    Mansour Babasafary
    5 (3)
    74% discount for the next 10 buyers (original price $605): 1 left Get a 50% bonus by buying (or even renting) any of our products. After buying (or renting), send a message for more information. 3 Indicators in 1 indicator Strategy based on price action Made specifically for the best forex currency pairs Can be used in the best time frame of the market at a very reasonable price This indicator is basically 3 different indicatos . But we have combined these 3 indicators in 1 indicator so th
    Antes de tudo, vale ressaltar que esta Ferramenta de Negociação é um Indicador Não Repintante, Não Redesenhante e Não Atrasado, o que a torna ideal para negociação profissional. Curso online, manual do utilizador e demonstração. O Indicador de Conceitos de Ação de Preço Inteligente é uma ferramenta muito poderosa tanto para traders novos quanto experientes. Ele combina mais de 20 indicadores úteis em um único, combinando ideias avançadas de negociação como Análise do Trader do Círculo Intern
    Quantum Heiken Ashi PRO MT5
    Bogdan Ion Puscasu
    4.5 (8)
    Apresentando o   Quantum Heiken Ashi PRO Projetadas para fornecer informações claras sobre as tendências do mercado, as velas Heiken Ashi são conhecidas por sua capacidade de filtrar o ruído e eliminar sinais falsos. Diga adeus às confusas flutuações de preços e olá para uma representação gráfica mais suave e confiável. O que torna o Quantum Heiken Ashi PRO verdadeiramente único é sua fórmula inovadora, que transforma os dados tradicionais de velas em barras coloridas fáceis de ler. As barras ve
    AW Trend Predictor MT5
    AW Trading Software Limited
    4.77 (56)
    A combinação de níveis de tendência e quebra em um sistema. Um algoritmo de indicador avançado filtra o ruído do mercado, determina a tendência, os pontos de entrada e os possíveis níveis de saída. Os sinais indicadores são registrados em um módulo estatístico, que permite selecionar as ferramentas mais adequadas, mostrando a eficácia do histórico do sinal. O indicador calcula as marcas Take Profit e Stop Loss. Manual e instruções ->   AQUI   / versão MT4 ->   AQUI Como negociar com o indicador
    "Piranha" - an autonomous trading system that determines overbought and oversold levels on the chart. Red and blue zones represent overbought and oversold levels respectively. Entry points are marked with arrows: a downward arrow in the red zone for "sell" and an upward arrow in the blue zone for "buy". The Take profit level is indicated by the green moving average. Key features: Adjusting the Take profit level as the green moving average changes position. Averaging ability when a new market e
    FxaccurateLS
    Shiv Raj Kumawat
    WHY IS OUR FXACCCURATE LS MT5 THE PROFITABLE ? PROTECT YOUR CAPITAL WITH RISK MANAGEMENT Gives entry, stop and target levels from time to time. It finds Trading opportunities by analyzing what the price is doing during established trends. POWERFUL INDICATOR FOR A RELIABLE STRATEGIES We have made these indicators with a lot of years of hard work. It is made at a very advanced level. Established trends provide dozens of trading opportunities, but most trend indicators completely ignore them!
    Apresentando       Quantum Breakout PRO   , o inovador Indicador MQL5 que está transformando a maneira como você negocia Breakout Zones! Desenvolvido por uma equipe de traders experientes com experiência comercial de mais de 13 anos,       Quantum Breakout PRO       foi projetado para impulsionar sua jornada comercial a novos patamares com sua estratégia de zona de fuga inovadora e dinâmica. O Quantum Breakout Indicator lhe dará setas de sinal em zonas de breakout com 5 zonas-alvo de lucro e
    Fractal Advanced MT5
    Siarhei Vashchylka
    5 (3)
    Fractal Advanced - displays Fractal and Alligator indicators on the price chart. Has wide options for settings and customization. It is also equipped with alerts and a hotkey system. Manual (Be sure to read before purchasing) | Version for MT4 Advantages 1. The indicator does not fill the entire chart with fractals, but allows you to display only relevant signals. 2. The number of fractals is adjusted by scrolling the mouse while holding down the Shift key. 3. Instantly show/hide the Alligator
    Was: $249  Now: $99   Market Profile defines a number of day types that can help the trader to determine market behaviour. A key feature is the Value Area, representing the range of price action where 70% of trading took place. Understanding the Value Area can give traders valuable insight into market direction and establish the higher odds trade. It is an excellent addition to any system you may be using. Inspired by Jim Dalton’s book “Mind Over Markets”, this indicator is designed to suit the
    IX Power MT5
    Daniel Stein
    5 (3)
    O   IX Power   traz finalmente a precisão imbatível do FX Power para símbolos não-Forex. Determina com exatidão a intensidade das tendências a curto, médio e longo prazo nos seus índices, acções, mercadorias, ETFs e até criptomoedas favoritos. Pode   analisar tudo o que   o seu terminal tem para oferecer. Experimente e veja como   o seu timing melhora significativamente   quando negoceia. Características principais do IX Power Resultados de cálculo 100% precisos e sem repintura - para tod
    Gartley Hunter Multi
    Siarhei Vashchylka
    5 (6)
    Gartley Hunter Multi - An indicator for searching for harmonic patterns simultaneously on dozens of trading instruments and on all classic timeframes: (m1, m5, m15, m30, H1, H4, D1, Wk, Mn). Manual (Be sure to read before purchasing) | Version for MT4 Advantages 1. Patterns: Gartley, Butterfly, Shark, Crab. Bat, Alternate Bat, Deep Crab, Cypher 2. Simultaneous search for patterns on dozens of trading instruments and on all classic timeframes 3. Search for patterns of all possible sizes. Fr
    XQ Indicator MetaTrader 5
    Marzena Maria Szmit
    5 (1)
    Step into the realm of Forex trading with confidence and precision using XQ, a cutting-edge Forex indicator designed to elevate your trading game to unprecedented heights. Whether you're a seasoned trader or just stepping into the world of currency exchange, XQ Forex Indicator empowers you with the insights and signals needed to make informed trading decisions. The signal conditions are a combination of three indicators, and XQ Forex Indicator only display  medium and long-term trends . The ind
    Torne-se um Negociador Breaker e lucre com as mudanças na estrutura do mercado à medida que o preço reverte. O indicador de quebra de bloco de pedidos identifica quando uma tendência ou movimento de preço está chegando à exaustão e pronto para reverter. Ele o alerta sobre mudanças na estrutura do mercado, que normalmente ocorrem quando uma reversão ou uma grande retração está prestes a ocorrer. O indicador usa um cálculo proprietário que identifica rupturas e momento do preço. Toda vez que
    Auto Order Block with break of structure based on ICT and Smart Money Concepts (SMC) Futures Break of Structure ( BoS )             Order block ( OB )            Higher time frame Order block / Point of Interest ( POI )    shown on current chart           Fair value Gap ( FVG ) / Imbalance   -  MTF      ( Multi Time Frame )    HH/LL/HL/LH  -  MTF      ( Multi Time Frame )  Choch  MTF      ( Multi Time Frame )  Volume Imbalance     ,  MTF          vIMB Gap’s Equal High / Low’s     ,
    O Indicador de Reversão ADR mostra rapidamente onde o preço está sendo negociado atualmente em relação ao seu intervalo médio diário normal. Você receberá alertas instantâneos via pop-up, e-mail ou push quando o preço exceder seu intervalo médio e níveis acima dele de sua escolha, para que você possa saltar rapidamente para retrocessos e reversões. O indicador desenha linhas horizontais no gráfico nos extremos médios do intervalo diário e também extensões acima daqueles níveis que têm probabili
    Introducing the South African Sniper indicator created by a small group of traders with a few years trading trading the financial market profitably . This is a plug and play indicator that provides you with  BUY and SELL (SNIPER ENTRY) signals with TARGET and trail stops. The indicator Works with all MT5 trading instruments. The indicator uses previous  chart data as receipt to speculate on future market moves.  "The South African Sniper indicator community are very happy with the indicator an
    Blahtech Supply Demand MT5
    Blahtech Limited
    4.57 (14)
    Was: $299  Now: $99   Supply Demand uses previous price action to identify potential imbalances between buyers and sellers. The key is to identify the better odds zones, not just the untouched ones. Blahtech Supply Demand indicator delivers functionality previously unavailable on any trading platform. This 4-in-1 indicator not only highlights the higher probability zones using a multi-criteria strength engine, but also combines it with multi-timeframe trend analysis, previously confirmed swings
    Mais do autor
    Mini POC
    Flavio Javier Jarabeck
    4.76 (25)
    For those who struggle with overbloated Volume Profile/Market Profile indicators, here is a solution that contains only the Point of Control (POC) information. Super-fast and reliable, the Mini POC indicator presents this vital information visually within your chart. Totally customizable in splittable timeframes, type of Volume, calculation method, and how many days back you need. SETTINGS Timeframe to split the POCs within the day. Volume type to use: Ticks or Real Volume. Calculation method
    FREE
    Tabajara V5
    Flavio Javier Jarabeck
    4.88 (41)
    Metatrader 5 version of the famous Andre Machado's Tabajara indicator. If you don't know Andre Machado's Technical Analysis work you don't need this indicator... For those who need it and for those several friend traders who asked this porting from other platforms, here it is... FEATURES 8-period Moving Average 20-period Moving Average 50-period Moving Average 200-period Moving Average Colored candles according to the inflexion of the 20-period MA SETTINGS You can change the Period of all M
    FREE
    Auto Support and Resistances
    Flavio Javier Jarabeck
    4.6 (80)
    Are you tired of drawing Support & Resistance levels for your Quotes? Are you learning how to spot Support & Resistances? No matter what is your case, Auto Support & Resistances will draw those levels for you! AND, it can draw them from other timeframes, right into you current chart, no matter what timeframe you are using... You can also Agglutinate regions/zones that are too much closer to each other and turning them into one single Support & Resistance Level. All configurable. SETTINGS Time
    FREE
    Economic Markers
    Flavio Javier Jarabeck
    4.83 (18)
    Easily get all relevant economic events of the current day right into your chart, as markers. Filter what kind of markers do you want: by country (selected individually) and by Importance (High relevance, Medium, Low or any combination of these). Configure the visual cues to your liking. If there is more than one event set to the very same time, their Names will be stacked and you will see the messages merged with the plus (+) sign on the marker. Obviously that long or too much events on the sam
    FREE
    Closing Price Reversal
    Flavio Javier Jarabeck
    5 (10)
    Closing Price Reversal is a very well known and traded candlestick pattern. This little indicator paints with specific (user-selected) colors the Closing Price Reveral Up and Down patterns, as well as the Inside Bars (as a bonus). Higher timeframes are more effective  as with all other candlesticks patterns. Do NOT trade solely on this indicator. Search the web for "Closing Price Reversal" to learn about the several approaches that can be used with this pattern. One of them is combining short/me
    FREE
    Weis Waves
    Flavio Javier Jarabeck
    3.15 (26)
    The original author is David Weis, an expert in the Wyckoff Method. The Weis Wave is a modern adaptation of the 1930's Wyckoff Method, another expert in Tape Reading techniques and Chart Analysis. Weis Waves takes market volume and stacks it into waves according to price conditions giving the trader valuable insights about the market conditions. If you want to learn more about this subject you can find tons of videos in YouTube. Just look for "The Wickoff Method", "Weis Wave" and "Volume Spread
    FREE
    Big Player Candles
    Flavio Javier Jarabeck
    4.75 (28)
    If you heard about The Wyckoff Method, Volume Spread Analysis, etc... You are probably searching for the candlestick indicator that shows you the Volume spread all over the current bar, signaling every types of market status... You can control the several Market Levels with custom colors... It is up to you to decide how to use it. Our job is provide you with the indicator... If you like this indicator, all I am asking is a little Review (not a Comment, but a REVIEW! )...    This will mean A
    FREE
    Inside Bar Radar
    Flavio Javier Jarabeck
    4.67 (6)
    The Inside Bar pattern is a very well known candlestick formation used widely by traders all over the world and in any marketplace. This approach is very simple and adds a little confirmation candle, so it adds a third past candlestick to the count to confirm the direction of the move (upward or downward). Obviously, there is no power on this candlestick formation if the trader has no context on what it is happening on the market he/she is operating, so this is not magic, this "radar" is only a
    FREE
    Aggression Volume
    Flavio Javier Jarabeck
    3.86 (21)
    O Indicador de Volume de Agressão é o tipo de indicador que raramente é encontrado na comunidade MQL5 porque não é baseado nos dados de Volume padrão fornecidos pela plataforma Metatrader 5. Ele requer a análise de todos os Ticks de tráfego solicitados na plataforma... Dito isso, o indicador de Volume de Agressão solicita todos os Dados de Tick do seu Broker e os processa para construir uma versão muito especial de um Indicador de Volume, onde as agressões de Compradores e Vendedores são plotada
    FREE
    MIDAS Super VWAP
    Flavio Javier Jarabeck
    4.29 (14)
    Imagine VWAP, MVWAP and MIDAS in one place... Well, you found it! Now you can track the movement of Big Players in various ways, as they in general pursue the benchmarks related to this measuring, gauging if they had good execution or poor execution on their orders. Traders and analysts use the VWAP to eliminate the noise that occurs throughout the day, so they can measure what prices buyers and sellers are really trading. VWAP gives traders insight into how a stock trades for that day and deter
    FREE
    Symbol Watermark
    Flavio Javier Jarabeck
    4.62 (13)
    Another request from my brotherhood was putting the name of the Symbol being seen - a little bigger - on the Chart, just to get sure that they are seeing the correct one... Mistakes pay a high price on the market... It is a very effective, and almost resource-null-consuming indicator that displays the current Symbol Name and Timeframe in almost any position of your Chart, with any color, and any Font Size... And also you can change the divisor character that is presented between the Symbol Name
    FREE
    VWAP and MVWAP
    Flavio Javier Jarabeck
    4.17 (6)
    Volume Weighted Average Price (VWAP) is a trading benchmark commonly used by Big Players that gives the average price a Symbol has traded throughout the day. It is based on both Volume and price. Additionally we put in this indicator the MVWAP (Moving Volume Weighted Average Price). For those who do not know the usage and the importance od this indicator I recommend a great article about this subject at Investopedia ( https://www.investopedia.com/articles/trading/11/trading-with-vwap-mvwap.asp )
    FREE
    Waves Sizer
    Flavio Javier Jarabeck
    3.67 (6)
    Wyckoff fans, enjoy! Ideally to be used with the Weis Waves indicator, but it can be easily used alone, the Waves Sizer puts the range (in resulting Price movement) done by the Price on its market swings. You can control how accurate or loose will be the swings. This tool is very helpful for visually know how much the Price has traveled in your Timeframe. This way you can confront this level of effort with the resulting Volume, etc... Weis Waves indicator: https://www.mql5.com/en/market/pro
    FREE
    Price Momentum
    Flavio Javier Jarabeck
    4.92 (13)
    Value Chart indicator presents the Price evolution in a new form. This indicator, Price Momentum , was developed taking all the calculations presented in the book " Dynamic Trading Indicators " by Mark W. Helweg and David Stendahl (2002). The technique involves de-trended Prices from a user-defined Period of analysis and the addition of a Volatility index correction. The result is an Oscillator with 3 zones: Fair Price Value, Overbought/Oversold and Extremely Overbought/Oversold zones. Adding th
    FREE
    Stackable VWAP
    Flavio Javier Jarabeck
    3.33 (6)
    Volume Weighted Average Price (VWAP) is a trading benchmark commonly used by Big Players that gives the average price a Symbol has traded throughout the day. It is based on both Volume and price. Additionally we put in this indicator the MVWAP (Moving Volume Weighted Average Price). For those who do not know the usage and the importance od this indicator I recommend a great article about this subject at Investopedia ( https://www.investopedia.com/articles/trading/11/trading-with-vwap-mvwap.asp
    FREE
    Money Flow Index EA Friendly
    Flavio Javier Jarabeck
    4.25 (4)
    O indicador tradicional Money Flow Index, desta vez, compatível com EAs . Existem 3 buffers expostos que podem ser usados por EAs para analisar automaticamente as condições de sobrecompra e sobrevenda da cotação. Basta usar a função tradicional iCustom() para obter esses sinais. Este cálculo do Money Flow Index é baseado no indicador MFI tradicional da Metaquote. CONFIGURAÇÕES Período do MFI Tipo de volume para analisar (Volume Real ou Ticks) Início da região de sobrecompra Início da região d
    FREE
    Market Momentum
    Flavio Javier Jarabeck
    3.86 (7)
    O indicador de Momento do Mercado é baseado no Oscilador de Zona de Volume (VZO), apresentado por Waleed Aly Khalil na edição de 2009 do jornal da Federação Internacional de Analistas Técnicos , e apresenta uma nova visão desses valiosos dados de mercado que muitas vezes são mal compreendidos e negligenciados: o VOLUME. Com essa nova abordagem de "ver" os dados de Volume, os traders podem inferir de maneira mais adequada o comportamento do mercado e aumentar suas chances em uma negociação bem-su
    FREE
    Force Numbers
    Flavio Javier Jarabeck
    Several assets in several markets have the behavior of using specific numbers as Force Numbers, where support, resistance and price thrust is created. Let this indicator draw those levels of support and resistance for you. You can also stack it to show different level of Prices! This technique is being used by Tape Readers and Order Flow traders all over the world for a long time. Give it a try. Challenge yourself to study new ways of Price Action! SETTINGS What Price reference to use in th
    FREE
    Candle Zones
    Flavio Javier Jarabeck
    5 (1)
    You probably heard about Candlesticks behaviors, which in most of the times could denote and trace Volume behaviors even if you are not watching Volume itself... Well, this indicator will do this. Naked traders love to rely solely on candlesticks patterns and with Candle Zones you can trap special patterns and DRAW THEM on your chart. As simple as that. There are several filters you can tweak in order to achieve the analysis you want. Just give it a try. After several months of testing, we think
    FREE
    Flux Diffuser
    Flavio Javier Jarabeck
    4.43 (7)
    Based on Brazilian trader André Moraes' Difusor de Fluxo theory, the indicator is a more reliable version of the original MACD. It is a great confirmation indicator for Swing Trading and also can be used as a Day Trading tool. If you are not familiar with the concept or André's trading strategies, I strongly recommend his excelent book named "Se Afastando da Manada" in which he explains in detail how this indicator is used. Even if you don't know the Portuguese language it is not difficult to un
    FREE
    Time Spaced Moving Averages
    Flavio Javier Jarabeck
    4.67 (6)
    The concept is simple: Plotting Price behavior within several periods of time. Some Symbols behave very well during the trading day - with this I mean Intraday trading - and this behavior ends up plotting effectively well with the proposed Exponential Moving Averages in this indicator... Obviously that this behavior could not be seen in all Symbols, but you can give it a try... Just drop this indicator in a chart and you will see for yourself... This indicator is intended for "Feeling the Trend
    FREE
    Price Trail Chart
    Flavio Javier Jarabeck
    5 (4)
    For those who hate candlesticks in lower timeframes (M1 through M15) we "invented" a clean new way to follow Price movement and displacement (volatility) called Price Trail Chart . The big "secret" is to get rid of those annoying candle wicks and draw the whole complete candle without them, this way we get a cleaner chart and a new view of the Price Path. No Open or Close markings, just LOW's and HIGH's, full body candle. Additionaly we inserted a Volume monitor from our Best Downloaded indicat
    FREE
    ATR Monitor
    Flavio Javier Jarabeck
    4.83 (6)
    O ATR é uma medida de volatilidade introduzida pelo famoso autor J. Welles Wilder Jr. em seu livro "New Concepts in Technical Trading Systems". Em geral, os traders estão acostumados a ver o ATR na forma de um indicador em uma sub-janela do gráfico. O que estou apresentando aqui é uma versão simplificada do ATR - apenas contendo o número atual do ATR - muito útil para monitorar apenas o momento atual do mercado. Se você quiser monitorar vários tempos gráficos dentro do gráfico corrente,
    FREE
    Server Clock
    Flavio Javier Jarabeck
    4.89 (9)
    Many friends asked me for a simple, non-obtrusive, resource-friendly clock to track the time during their trades. It seems pretty obvious, but it is a must-have for those trading the market manually, waiting for the Market News, or just to visually know what time it is... Trading is an absorbing endeavor! So, here it is... Totally configurable, including Font Type, Font Size and Chart Location: Upper Left/Center/Right OR Lower Left/Center/Right, with a little twist of adjusting the Offset, just
    FREE
    ATR Monitor EA Friendly
    Flavio Javier Jarabeck
    ATR Monitor ATR is a measure of volatility introduced by market technician J. Welles Wilder Jr. in his book, "New Concepts in Technical Trading Systems". In general, traders are accustomed to seeing the ATR in the form of a sub-window indicator. What I am presenting here is a simplified version of ATR - just the current ATR number - very useful for monitoring just the very moment of the current chart. And, by default, this indicator will not show up on screen, you can just use the buffers thems
    FREE
    Arrows Cleaner
    Flavio Javier Jarabeck
    4.86 (7)
    For those who use the Trading Arrows on the chart for later study, but use the Triple Screen approach and got all those arrows everywhere on all additional charts, here it is: Arrows Cleaner! Just drop it on the chart and leave it there. When needed, just with 1-click you get rid of all those annoying arrows... SETTINGS You can position the little Button on any corner of the chart. Additionally you can displace it with the Offset settings. You can enlarge or shrink its size, as well as the tex
    FREE
    Candlestick Pattern Teller
    Flavio Javier Jarabeck
    5 (1)
    Minions Labs' Candlestick Pattern Teller It shows on your chart the names of the famous Candlesticks Patterns formations as soon as they are created and confirmed. No repainting. That way beginners and also professional traders who have difficulties in visually identifying candlestick patterns will have their analysis in a much easier format. Did you know that in general there are 3 types of individuals: Visual, Auditory, and Kinesthetic? Don't be ashamed if you cannot easily recognize Candlest
    Economic Markers PRO
    Flavio Javier Jarabeck
    5 (1)
    Easily get all relevant economic events of the current day right into your chart, as markers. Filter what kind of markers do you want: by country (selected individually) and by Importance (High relevance, Medium, Low or any combination of these). Configure the visual cues to your liking. Additionaly you have the ability to add up to 5 personal markers of your own agenda. With Alerts and/or with blackout periods, if you are using it within an Expert Advisor! All in one Economic Calendar indicator
    Mini Chart Indicators
    Flavio Javier Jarabeck
    The Metatrader 5 has a hidden jewel called Chart Object, mostly unknown to the common users and hidden in a sub-menu within the platform. Called Mini Chart, this object is a miniature instance of a big/normal chart that could be added/attached to any normal chart, this way the Mini Chart will be bound to the main Chart in a very minimalist way saving a precious amount of real state on your screen. If you don't know the Mini Chart, give it a try - see the video and screenshots below. This is a gr
    Market Momentum PRO
    Flavio Javier Jarabeck
    The Market Momentum indicator is based on the Volume Zone Oscillator (VZO), presented by Waleed Aly Khalil in the 2009 edition of the International Federation of Technical Analysts journal, and presents a fresh view of this market valuable data that is oftenly misunderstood and neglected: VOLUME. With this new approach of "seeing" Volume data, traders can infer more properly market behavior and increase their odds in a winning trade. "The VZO is a leading volume oscillator; its basic usefulnes
    Filtro:
    Sem comentários
    Responder ao comentário