• Visão global
  • Comentários
  • Discussão
  • O que há de novo

Trend On Close

O TrendOnClose é um indicador sofisticado desenvolvido para investidores do mercado binário, com foco na análise estatística de tendências e contra-tendências dentro de ciclos específicos de candles.

Cada ciclo é definido pelo preço de FECHAMENTO do candle, estabelecendo a direção da tendência (UP/DOWN - BULL/BEAR) para a análise estatística subsequente até o início do próximo ciclo. A análise estatística opera com duas configurações:

⦁ Estatística como CANDLE SUBSEQUENTE: O algoritmo se concentra no candle subsequente dentro do ciclo.

⦁ Estatística como INTERCICLOS: O algoritmo considera todos os candles entre cada ciclo.

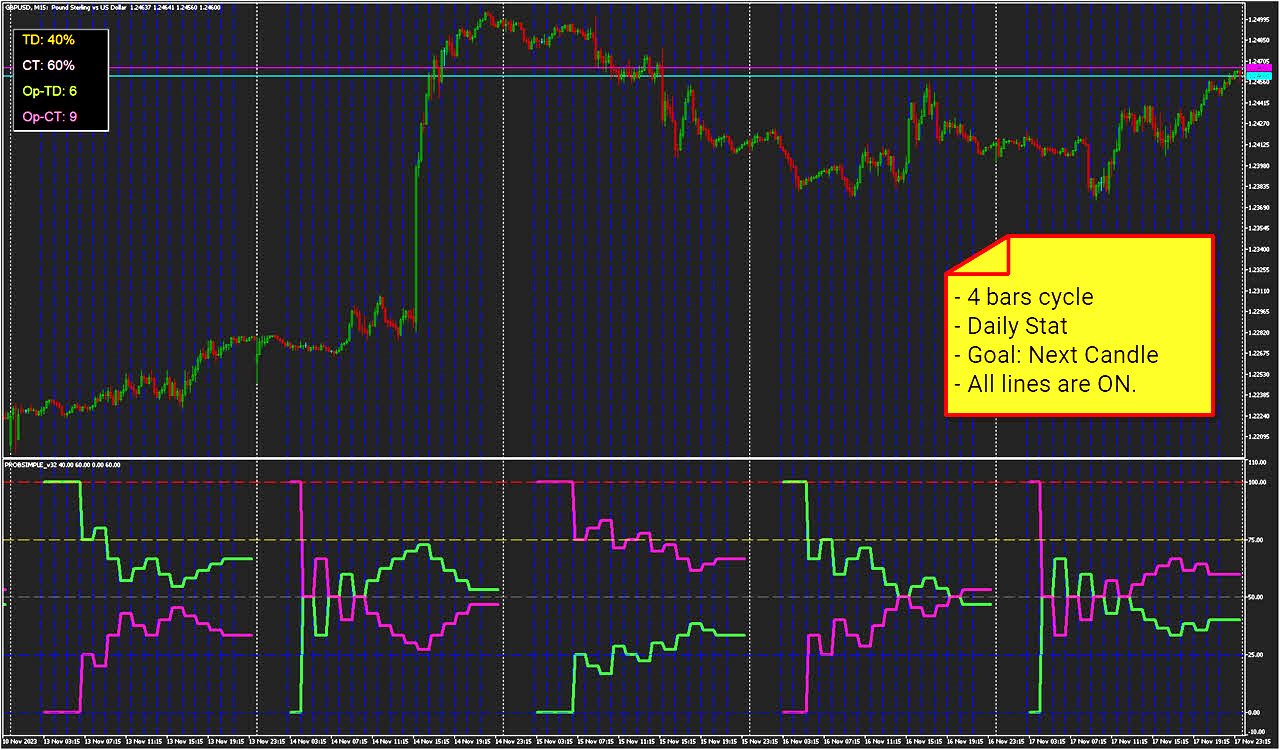
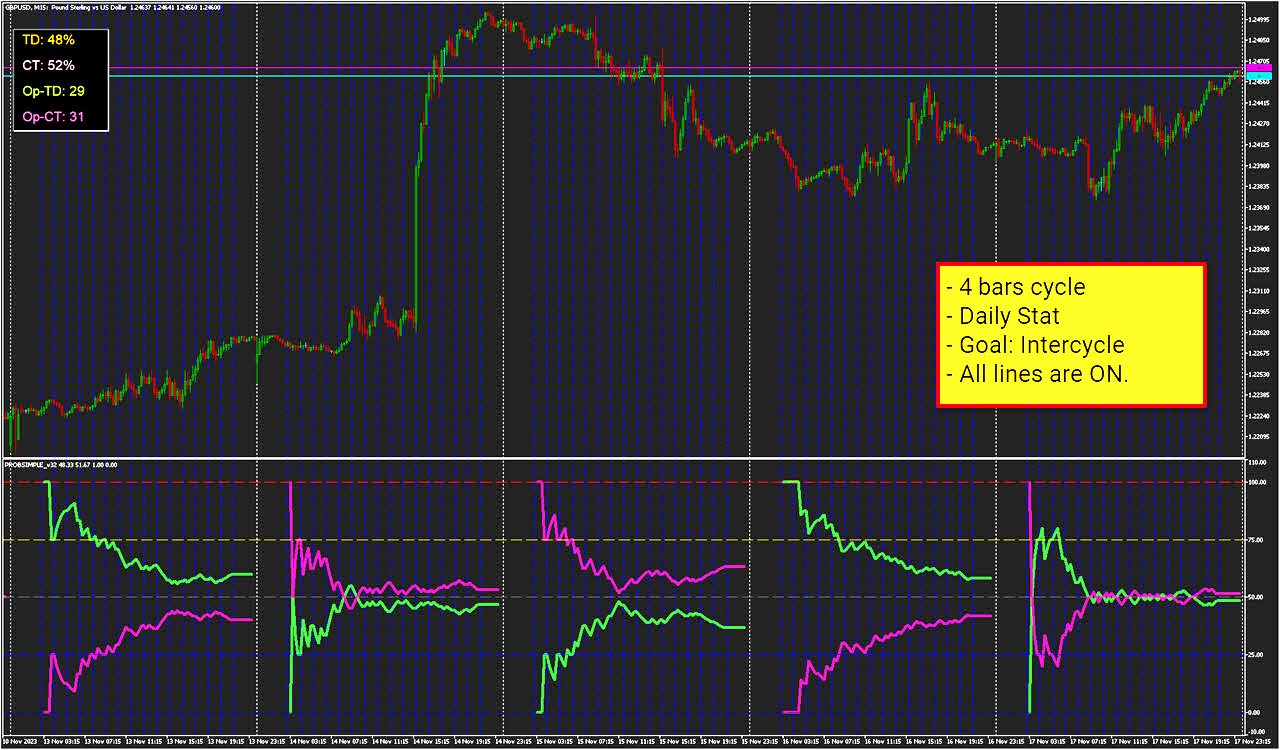
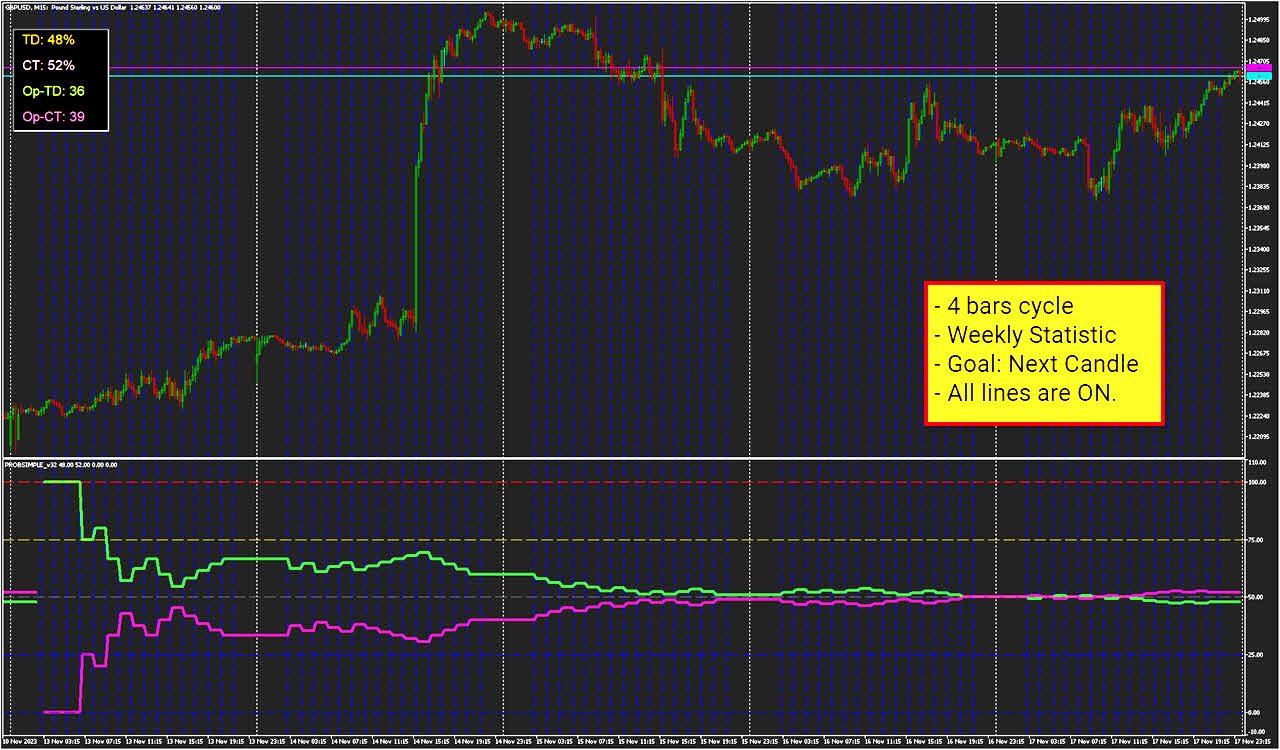
Com base na meta estatística selecionada, a tendência de cada candle é comparada à tendência do candle do CICLO, resultando em um aumento no percentual de tendência (TD) e nas ocorrências de tendência (N-TD) para direções idênticas, ou na tendência contrária (CT e N-CT) para tendências divergentes. Além disso, o indicador fornece uma soma estatística para períodos diários, semanais ou mensais, revelando o número de velas que seguem a "tendência" ou a "contra-tendência" de cada CICLO durante esses períodos. No final de cada período predefinido, as estatísticas são redefinidas para o ciclo subsequente.

Recursos

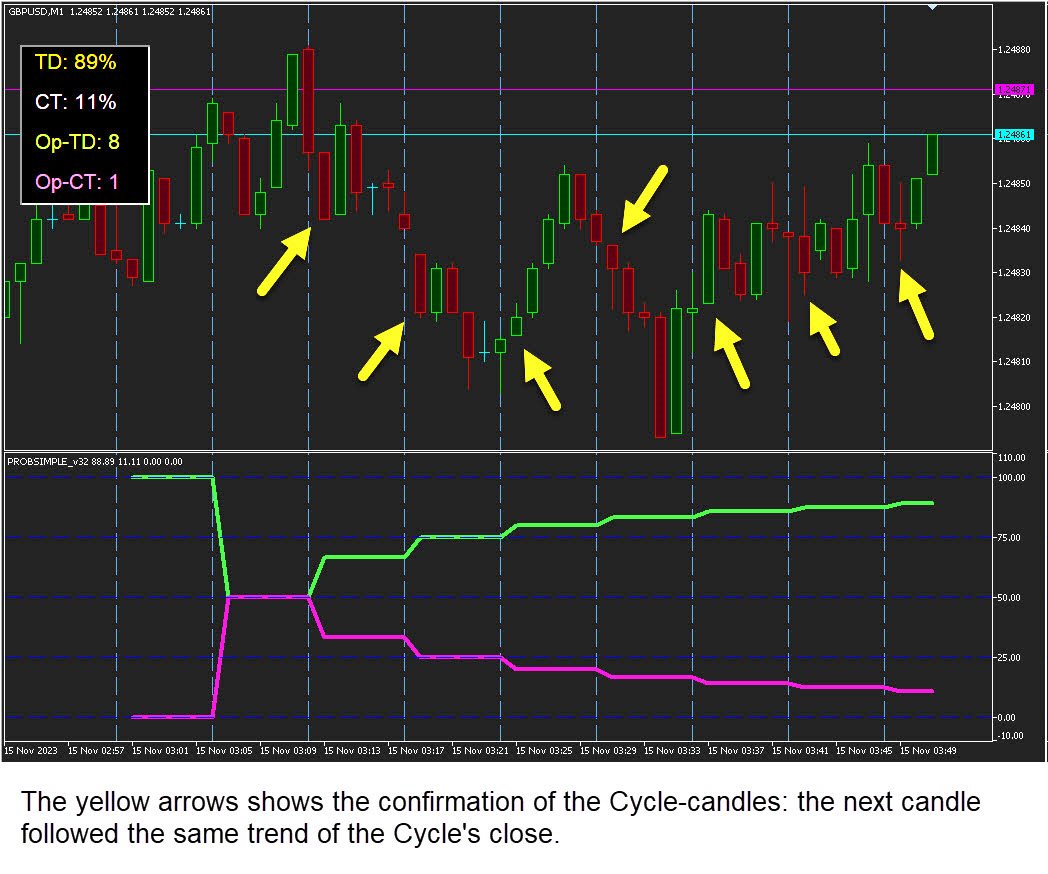
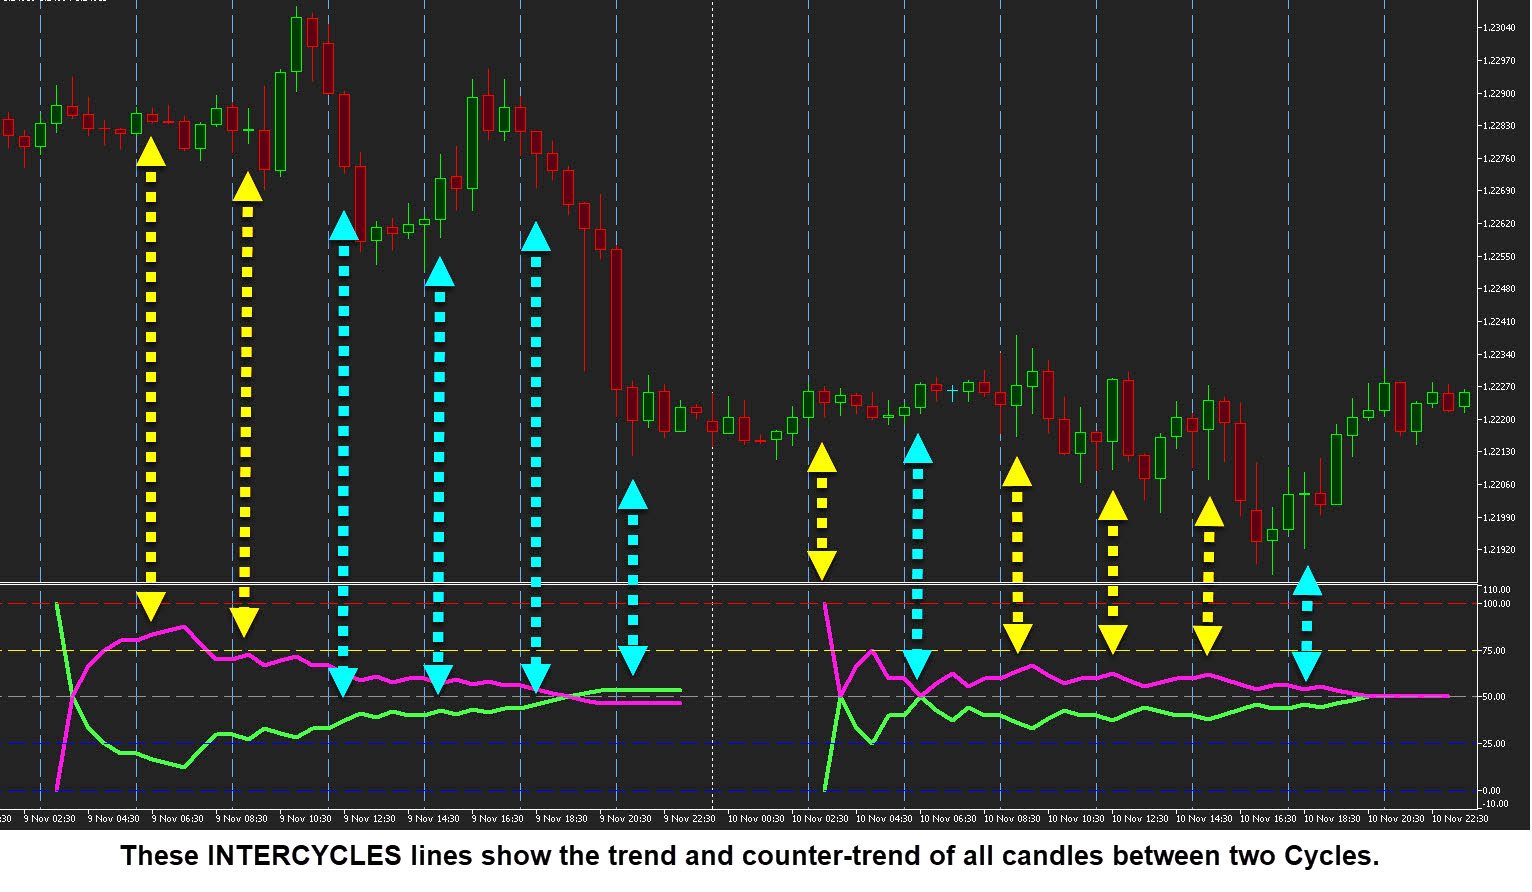
⦁ Informações estatísticas sem pintura: Otimize a análise de tendências e contra-tendências em ciclos/tempos específicos, avaliando a probabilidade de repetições (e divergências) com base na VELA SUBSEQUENTE AO CICLO ou nas VELAS INTERCICLOS.

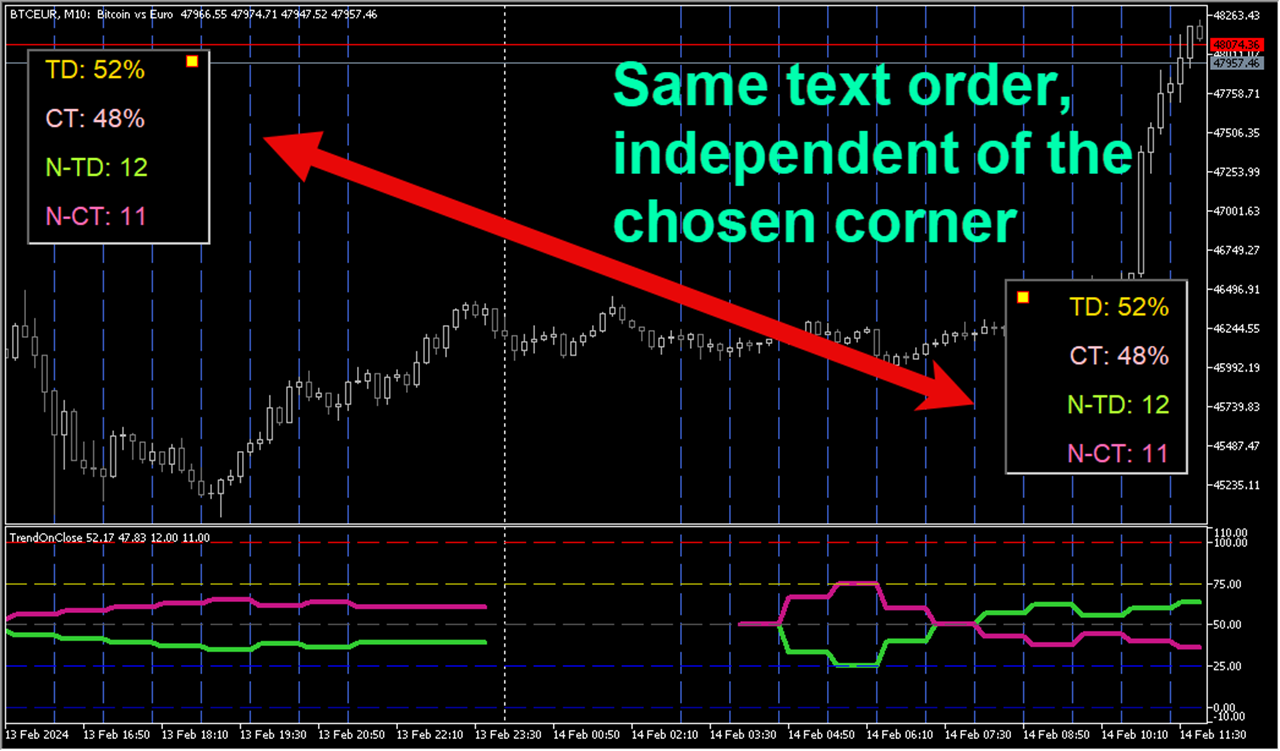
⦁ Intuitivo: Exibe a contagem e a porcentagem de tendências/contra-tendências nos modos de texto e gráfico. Além disso, mostra linhas de CICLO e linhas de TENDÊNCIA/COUNTER-TENDÊNCIA que podem ser totalmente configuradas e até mesmo suprimidas.

⦁ Configuração fácil e rápida de HORA DE INÍCIO/FIM, CICLOS, METAS e PERÍODOS. Os horários de INÍCIO/FIM funcionam em um modo inteligente, adaptando-se ao TIMEFRAME selecionado em caso de incompatibilidade (por exemplo, horas pares em TIMEFRAMES ímpares como M3, M15 etc.).

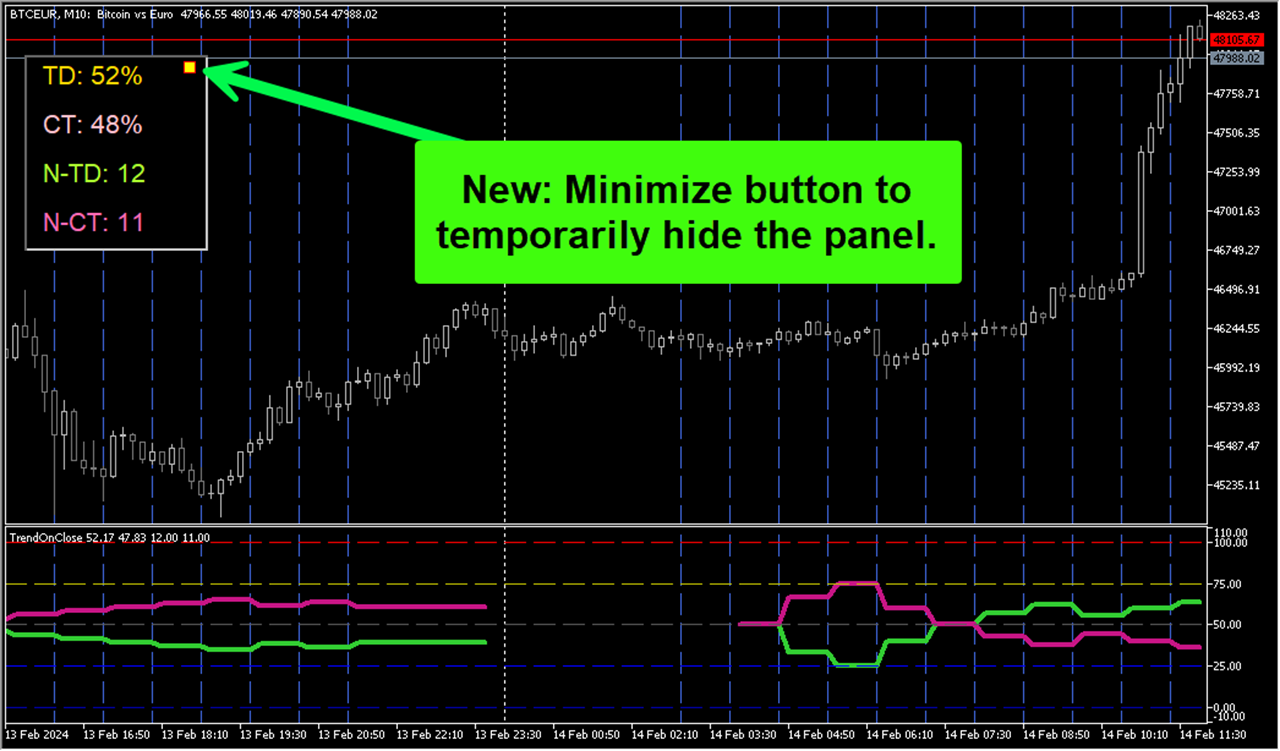
⦁ Um PAINEL para acesso rápido a informações estatísticas no modo de texto. O painel pode ser minimizado ou movido para qualquer um dos quatro quadrantes do GRÁFICO principal, com muitas opções de layout.


Produtos recomendados
Limitless MT5
Dmitriy Kashevich
Limitless MT5 is a universal indicator suitable for every beginner and experienced trader. works on all currency pairs, cryptocurrencies, raw stocks Limitless MT5 - already configured and does not require additional configuration And now the main thing Why Limitless MT5? 1 complete lack of redrawing 2 two years of testing by the best specialists in trading 3 the accuracy of correct signals exceeds 80% 4 performed well in trading during news releases Trading rules 1 buy signa
Smooth price for Monarch
Konstantin Gruzdev
5 (1)
The Smooth Price technical indicator is used for plotting a smoothed line as close to the price of the financial instrument as possible, and serves to eliminate its noise components. The indicator is part of the Monarch trading system, but here it is presented as an independent technical analysis tool. The indicator is based on the cluster digital filter , which, unlike the ClusterSMA , is applied directly to the price time series. Smooth Price does not redraw (except the very last, zero bar) an
HiLo Activator Plus
Rodrigo Galeote
5 (1)
HiLo Activator is one of the most used indicators to determine trend. Find it here with the ability to customize period and colors. This indicator also plots up and down arrows when there is a change on the trend, indicating very strong entry and exit points. HiLo fits well to different types of periods for day trading. You can easily understand when it is time to buy or sell. It works pretty good also for other periods like daily and monthly signalizing long-term trends. The use of the indicato
The Volume by Price Indicator for MetaTrader 5 features Volume Profile and Market Profile TPO (Time Price Opportunity). Volume and TPO histogram bar and line charts. Volume Footprint charts. TPO letter and block marker collapsed and split structure charts. Session filtering and grouping. Static, dynamic and flexible range segmentation and compositing methods with relative and absolute visualizations. Graphical layering, positioning and styling options to suit the user's analytic and aesthetic n
Win43 Scalper
Eadvisors Software Inc.
O novo s43 Scalper para Mini-Índice (WIN-IND) faz operações de curto prazo no timeframe 1min buscando pequenas variações do mercado, utiliza nova tecnologia de trade, os resultados no intraday são íncríveis, confira:      Após a instalação adicione no gráfico dos instrumentos win para visualizar os resultados no backteste. Recomendamos o timeframe de 1min.
PipFinite Exit EDGE MT5
Karlo Wilson Vendiola
4.89 (35)
Did You Have A Profitable Trade But Suddenly Reversed? In a solid strategy, exiting a trade is equally important as entering. Exit EDGE helps maximize your current trade profit and avoid turning winning trades to losers. Never Miss An Exit Signal Again Monitor all pairs and timeframes in just 1 chart www.mql5.com/en/blogs/post/726558 How To Trade You can close your open trades as soon as you receive a signal Close your Buy orders if you receive an Exit Buy Signal. Close your Sell orde
XCalper HiLo Activator
Aecio de Feo Flora Neto
HiLo Activator v1.02 by xCalper The HiLo Activator is similar to moving average of previous highs and lows. It is a trend-following indicator used to display market’s direction of movement. The indicator is responsible for entry signals and also helps determine stop-loss levels. The HiLo Activator was first introduced by Robert Krausz in the Feb. 1998 issue of Stocks & Commodities Magazine.
O indicador cria cotações atuais, que podem ser comparadas com as históricas e, com base nisso, fazer uma previsão do movimento dos preços. O indicador possui um campo de texto para navegação rápida até a data desejada. Opções: Símbolo - seleção do símbolo que o indicador exibirá; SymbolPeriod - seleção do período do qual o indicador coletará dados; IndicatorColor - cor do indicador; HorisontalShift - deslocamento das cotações desenhadas pelo indicador pelo número especificado de
Классификатор силы тренда. Показания на истории не меняет. Изменяется классификация только незакрытого бара. По идее подобен полной системе ASCTrend, сигнальный модуль которой, точнее его аппроксимация в несколько "урезанном" виде, есть в свободном доступе, а также в терминале как сигнальный индикатор SilverTrend . Точной копией системы ASCTrend не является. Работает на всех инструментах и всех временных диапазонах. Индикатор использует несколько некоррелируемых между собой алгоритмов для класси
Noize Absorption Index - is the manual trading system that measures the difference of pressure between bears forces and bulls forces. Green line - is a noize free index that showing curent situation. Zero value of index shows totally choppy/flat market.Values above zero level shows how powerfull bullish wave is and values below zero measures bearish forces.Up arrow appears on bearish market when it's ready to reverse, dn arrow appears on weak bullish market, as a result of reverse expectation.
WanaScalper
Isaac Wanasolo
1 (1)
A scalping indicator based on mathematical patterns, which on average gives signals with relatively small SL, and also occasionally helps to catch big moves in the markets (more information in the video) This indicator has three main types of notifications: The first type warns of a possible/upcoming signal on the next bar The second type indicates the presence of a ready signal to enter the market/open a position The third type is for SL and TP levels - you will be notified every time price r
Golden Limit
Renato Fridschtein
Não há limites! O indicador Golden Limit é a ferramenta definitiva para ter uma leitura clara e fácil dos movimentos do preço no gráfico. Ele projeta faixas de suporte e resistência, calculadas por modelos estatísticos envolvendo Price Action e a sequência de Fibonacci, revelando de antemão o comportamento dos preços e os melhores locais para operar (e para não operar). Ainda conta com duas médias móveis para auxiliar na escolha das melhores entradas. O Método Golden Limit foi criado a p
Setup Double 7s
Luigi Nunes Labigalini
Sinais de entrada e saída da Estratégia Duplo 7 de Larry Connors em seu livro "Estratégias Operacionais de Curto Prazo Que Funcionam". Larry alega que esta estratégia previu a direção do mercado mais de 80% do tempo desde 1995. Lucrando sem se expor ao mercado em mais de 25% do tempo. Ótima para swing trade em gráfico diário do SPY, Nasdaq, FXI da China, EWZ do Brasil (IBOV dolarizado) e a maioria dos ETFs e índices do mundo. Como o indicador funciona? O indicador plota o sinal de compra qu
SmartTrendMt5
Andrey Spiridonov
The SmartTrendMt5 trend indicator generates signals based on the principle of combined analysis of calculated reference points within the Keltner channel. The indicator plots the Keltner channel in a separate window (by default, red lines and a blue line - the middle of the channel), and also draws the histogram of calculated reference points for each candle (by default, the histogram bars are yellow). The should be attached to a chart of any timeframe and any trading symbol in the usual way.
Você utiliza o volume na sua leitura do mercado? Certamente muitos traders usam, e não se imaginam operando sem ele. O indicador Color Histogram Volume Set permite que o usuário escolha o valor que ele considera interessante para monitorar. Ao ultrapassar este você terá a confirmação visual e se quiser terá também o alerta sonoro que é dado pelo indicador. Claro que existem outras maneiras de tentar encontrar um volume elevado, como avaliar se o v olume está acima da média, se é o maior vo
Orbit Rage Final 2
BILLY ARANDUQUE ABCEDE
Note : i only sell this EA on MQL5, any other sellers is fake. Orbit Rage Final, a cutting-edge trading strategy meticulously designed around the bull/bear candle approach and divergence analysis. This powerful tool is engineered to empower you to shape the life you desire. To embark on this transformative journey, simply download and seamlessly integrate it into your MetaTrader 4 platform by placing it in the experts advisors folder. Orbit Rage Final revolutionizes trading by offering a risk-f
Welcome to the Ultimate Harmonic Patterns recognition indicator that is focused to detect advanced patterns. The Gartley pattern, Bat pattern, and Cypher pattern  are popular technical analysis tools used by traders to identify potential reversal points in the market. Our Ultimate Harmonic Patterns recognition Indicator is a powerful tool that uses advanced algorithms to scan the markets and identify these patterns in real-time. With our Ultimate Harmonic Patterns recognition Indicator, you
Mt5TradeCopier
Mcblastus Gicharu Ndiba
Forex Trade copier MT5.  It copies forex trades, positions, orders from any accounts to any other account,  MT5 even multiple accounts. The unique copying algorithm exactly copies all trades from the master account to your client account. It is also noted for its high operation speed and Tough error handling. It also can copy from demo account to live account too. It is one of the best free trade copiers that can do ,  MT5 or to multiple accounts  MT5 to multiple accounts  Features of Trade Copi
Perfect Sniper
Ignacio Agustin Mene Franco
Perfect Sniper! is a triple indicator with support resistance detection, downtrend channel, uptrend channel Bands included! where he hunts the rebounds in the red lines for sale, in the green lines mark purchase, in the lower bands that are the breaks gives another second entry either buy or sell, perfect to take advantage of the double entrance, It is used in any temporality, It is used to scalp and long on h1 or h4 to D1. It works for Forex markets, All pairs. It is used for the synthetic inde
WAPV Weis Wave Chart Forex
Eduardo Da Costa Custodio Santos
O Weis Wave Chart Forex para MT 5 é um um indicador de Preço e Volume. A leitura de Preço e Volume foi amplamente divulgada através de Richard Demille Wyckoff com base nas três leis criadas por ele: Oferta e Demanda, Causa e Efeito e Esforço x Resultado. Em 1900 R.Wyckoff já utilizava o gráfico de Ondas em suas análises. Muitos anos depois, por volta de 1990 , David Weis Automatizou o gráfico de ondas de R. Wyckoff e hoje nós trazemos a evolução do gráfico de ondas de David Weis. Ele mo
O nível Premium é um indicador único com mais de 80% de precisão nas previsões corretas! Este indicador foi testado pelos melhores Especialistas em Negociação por mais de dois meses! O indicador do autor você não encontrará em nenhum outro lugar! A partir das imagens você pode ver por si mesmo a precisão desta ferramenta! 1 é ótimo para negociar opções binárias com um tempo de expiração de 1 vela. 2 funciona em todos os pares de moedas, ações, commodities, criptomoedas Instruções:
Master OBV
Thalles Nascimento De Carvalho
O indicador MasterOBV é uma poderosa ferramenta de análise técnica que utiliza o volume, correlação positiva e uma Média Móvel (MA) para aprimorar a identificação de tendências nos mercados financeiros. Incorporando ativos com correlação positiva por meio do menu do indicador, o MasterOBV oferece uma abordagem refinada para avaliar a força e direção das tendências. A inclusão da Média Móvel proporciona uma suavização adicional aos movimentos de preços, auxiliando no rastreamento mais preciso da
Based on the trading model/strategy/system of gold double-position hedging and arbitrage launched by Goodtrade Brokers, problems encountered in daily operations: 1. Account B immediately places an order immediately following account A. 2: After account A places an order, account B will automatically copy the stop loss and take profit. 3: Account A closes the position of Account B and closes the position at the same time. 4: When account B closes the position, account A also closes the position.
UPD1 Profile Levels MT5
Vitaliy Kuznetsov
5 (3)
O indicador localiza os níveis de volume máximo e mínimo de preços (perfil do mercado) no histograma de trabalho para o número especificado de barras.   Perfil composto. A altura do histograma é totalmente automática e se adapta a qualquer instrumento e período de tempo. O algoritmo do autor é usado e não repete análogos conhecidos. A altura dos dois histogramas é aproximadamente igual à altura média da vela. Um alerta inteligente irá ajudá-lo a informar sobre o preço relativo ao nível de volume
Weis Wave with Alert MT5
Trade The Volume Waves Single Member P.C.
4.93 (15)
Rental/Lifetime Package Options and Privileges  * For optimum results the yearly or lifetime package is suggested due to live training ! Rent Monthly Six Months   Yearly/Lifetime Weis Wave with Speed with Alert+Speed Index x x x Manual  x x x Quick Set up Video x x x Blog x x x Lifetime Updates x x x Setup and Training Material x x Free Rectangle Break Alert Tool      x Discord Access Channel "The SI traders" x 2-hour live methodology training x How to trade with it:    http://
Description The indicator uses market profile theory to show the most relevant trading zones, on a daily basis. The zones to be shown are LVN (low volume nodes) and POC (point of control). An LVN zone is one which represents price areas with the least time or volume throughout the day. Typically, these areas indicate a supply or demand initiative, and in the future, they can turn into important breakout or retracement zones. A POC zone is one which represents price areas with the most time or vo
The "RMA Signal Indicator MT5" refers to an indicator called "RMA" (Running Moving Average) Signal Indicator designed specifically for the MetaTrader 5 (MT5) trading platform. The RMA is a variation of the Moving Average indicator that emphasizes recent price data. The specific details and functionality of the "RMA Signal Indicator MT5" may depend on the developer or the version you are using. However, in general, here is a general approach to using a signal indicator like RMA on the MT5 platfor
ISing
Yury Smagin
O EA trabalha com o princípio do desvio máximo do preço do valor médio. A ideia é que o preço sempre busca o equilíbrio, e qualquer grande desvio da média leva a uma força recíproca - reação. A entrada é realizada nestes desvios. Este é um exemplo de um sinal para este consultor https://www.mql5.com/en/signals/2047087 (você pode negociar de forma mais conservadora, se desejar). Opções: sigal_deviation - desvio máximo após o qual uma negociação é aberta; Filtros: closeBarOnly - funciona ap
Negociação automática e manual Um sistema comercial pronto baseado nas  ondas de Elliott e níveis de Fibonacci . Simples e de fácil acesso Exibição de marcação das ondas de Elliott (opção geral ou alternativa) em um gráfico Construção dos níveis horizontais, linhas de apoio e resistência, canal Sobreposição dos níveis de Fibonacci para as ondas 1, 3, 5, A Sistema de alerta (no ecrã, E-Mail, Push notificações) painel visual para abertura de ordens para negociação manual painel visual para configu
VWAP Daily
Anton Polkovnikov
Weighted average price indicator or VWAP. The well-known standard VWAP with the beginning of the day is added with the function of selecting the periodization. It can be calculated both every day and on other periods. Also the indicator allows to exclude the volume from the calculation, which will allow using it on the cryptocurrencies and forex. There is an alert for a VWAP price crossing. There are 1 and 2 standard deviation. Settings: Volume: turning volume on and off in the calculation mecha
Os compradores deste produto também adquirem
IVISTscalp5
Vadym Zhukovskyi
5 (3)
Apresentamos a você o indicador iVISTscalp5, que não é apenas único, mas também eficaz em operações de negociação. Este indicador é baseado em dados de tempo e é o resultado de muitos anos de experiência e análise aprofundada dos mercados financeiros. O indicador iVISTscalp5 é uma excelente ferramenta para negociação manual. Conveniência, simplicidade e visualização - toda a complexidade está escondida dentro dele. Simplificamos as configurações e o uso do indicador iVISTscalp5 ao máximo. O indi
Bill Williams Advanced
Siarhei Vashchylka
5 (5)
Bill Williams Advanced is designed for automatic chart analysis using Bill Williams' "Profitunity" system. The indicator analyzes four timeframes at once. Manual (Be sure to read before purchasing) Advantages 1. Automatically analyzes the chart using the "Profitunity" system of Bill Williams. The found signals are placed in a table in the corner of the screen. 2. Equipped with a trend filter based on the Alligator indicator. Most of the system signals are recommended to be used only accordi
Este é sem dúvida o indicador de reconhecimento automático de formação de preço harmônico mais completo que você pode encontrar para a MetaTrader Platform. Ele detecta 19 padrões diferentes, leva as projeções de Fibonacci tão a sério quanto você, exibe a Zona de Reversão Potencial (PRZ) e encontra níveis adequados de stop loss e take-profit. [ Guia de instalação | Guia de atualização | Solução de problemas | FAQ | Todos os produtos ] Detecta 19 formações harmônicas de preços diferentes Tr
Dragon Multi Indicator MT5
Mansour Babasafary
5 (4)
74% discount for the next 10 buyers (original price $605): 1 left Get a 50% bonus by buying (or even renting) any of our products. After buying (or renting), send a message for more information. 3 Indicators in 1 indicator Strategy based on price action Made specifically for the best forex currency pairs Can be used in the best time frame of the market at a very reasonable price This indicator is basically 3 different indicatos . But we have combined these 3 indicators in 1 indicator so th
FxaccurateLS
Shiv Raj Kumawat
WHY IS OUR FXACCCURATE LS MT5 THE PROFITABLE ? PROTECT YOUR CAPITAL WITH RISK MANAGEMENT Gives entry, stop and target levels from time to time. It finds Trading opportunities by analyzing what the price is doing during established trends. POWERFUL INDICATOR FOR A RELIABLE STRATEGIES We have made these indicators with a lot of years of hard work. It is made at a very advanced level. Established trends provide dozens of trading opportunities, but most trend indicators completely ignore them!
"Piranha" - an autonomous trading system that determines overbought and oversold levels on the chart. Red and blue zones represent overbought and oversold levels respectively. Entry points are marked with arrows: a downward arrow in the red zone for "sell" and an upward arrow in the blue zone for "buy". The Take profit level is indicated by the green moving average. Key features: Adjusting the Take profit level as the green moving average changes position. Averaging ability when a new market e
Introducing the South African Sniper indicator created by a small group of traders with a few years trading trading the financial market profitably . This is a plug and play indicator that provides you with  BUY and SELL (SNIPER ENTRY) signals with TARGET and trail stops. The indicator Works with all MT5 trading instruments. The indicator uses previous  chart data as receipt to speculate on future market moves.  "The South African Sniper indicator community are very happy with the indicator an
Professional Scalping Tool on Deriv Attention! The indicator will be sold in limited quantities!!! The previous 5 copies were sold for $250 The remaining 4 copies will be sold for $350 The next price is $500 Description: This trading indicator is designed for professional traders focused on scalping. Designed with the market in mind, it provides highly accurate spike trading signals. It works on the M1 timeframe and supports the following symbols: Boom 300 Index, Boom 500 Index, Boom 1000 I
TrendMaestro5
Stefano Frisetti
note: this indicator is for METATRADER4, if you want the version for METATRADER5 this is the link:  https://www.mql5.com/it/market/product/108106 TRENDMAESTRO ver 2.4 TRENDMAESTRO recognizes a new TREND in the bud, he never makes mistakes. The certainty of identifying a new TREND is priceless. DESCRIPTION TRENDMAESTRO identifies a new TREND in the bud, this indicator examines the volatility, volumes and momentum to identify the moment in which there is an explosion of one or more of these data a
Fibonacci Suavizado
Cesar Juan Flores Navarro
Indicador en MQL5, que obtiene el promedio de 10 EMAS, que son alineadas según Fibonacci, obteniendo un promedio, que sera suavizado.  Se puede ingresar un numero desde 2 a N, que multiplica a los EMA-Fibonacci. Funciona en cualquier criptomoneda, etc. etc... pudiendo calcular el futuro segun la tendencia de las EMAS. Funciona excelentemente en tramos largos, determinando exactamente el mejor inicio/salida. El precio inicial por apertura sera por un periodo de tiempo, luego aumentará.
PZ Swing Trading MT5
PZ TRADING SLU
5 (4)
Swing Trading é o primeiro indicador projetado para detectar oscilações na direção da tendência e possíveis oscilações de reversão. Ele usa a abordagem de negociação de linha de base, amplamente descrita na literatura de negociação. O indicador estuda vários vetores de preço e tempo para rastrear a direção da tendência agregada e detecta situações nas quais o mercado está sobrevendido ou sobrecomprado em excesso e pronto para corrigir. [ Guia de instalação | Guia de atualização | Solução de prob
Elliot Waves Analyzer Pro
Viktor Weidenthal
3.25 (4)
Elliot Waves Analyzer Pro calculates Elliot Waves to Help Identify Trend direction and Entry Levels. Mainly for Swing Trading Strategies. Usually one would open a Position in trend direction for Wave 3 or a Correction for Wave C . This Indicator draws Target Levels for the current and next wave. Most important Rules for Elliot Wave Analysis are verified by the Indicator.  The Pro version analyzes Multiple Timeframes and shows the Subwaves and Target-Levels.   For an Overview  " Elliot Waves Anal
Difícil de encontrar e com pouca frequência, as divergências são um dos cenários de negociação mais confiáveis. Este indicador localiza e verifica automaticamente divergências ocultas e regulares usando seu oscilador favorito. [ Guia de instalação | Guia de atualização | Solução de problemas | FAQ | Todos os produtos ] Fácil de trocar Encontra divergências regulares e ocultas Suporta muitos osciladores conhecidos Implementa sinais de negociação baseados em fugas Exibe níveis adequados de
TREND HARMONY MT5 – Multi Timeframe Trend and Phase and Pullback Level Visualizer indicator for Metatrader5 The TREND HARMONY indicator automates deep trend analysis and generates visualizations for you. Take control of your trades by eliminating uncertainty! Revolutionize your trading experience with precision and insight through the TREND HARMONY Multi Timeframe indicator – your ultimate MT5 trend visualization indicator. [  Features and Manual   | MT4 version |   All Products   ] Are you t
VTrende Pro
Andrii Diachenko
5 (1)
VTrende Pro - MTF indicator for trend trading with a display panel for MT5 *** Videos can be translated into any language using subtitles (video language - Russian) Although the signals of the VTrende Pro indicator can be used as signals of a full-fledged trading system, it is recommended to use them in conjunction with the Bill Williams TS. VTrende Pro is an extended version of the VTrende indicator. Difference between Pro version and VTrende: - Time zones - Signal V - signal 1-2 waves
SMCpro
Arief
5 (1)
SMCpro MT5  Original Price  $440   ---  Currently Price  40% OFF  ( for unlimited use ) Hello World! Introducing.. SMCpro tool and Indicator for  MetaTrader 5 , a cutting-edge feature designed to revolutionize your trading experience. With innovative ICT Smart Money Concept, you gain unparalleled insight into market dynamics, empowering you to make informed trading decisions like never before. Built on the foundation of advanced algorithms and real-time data analysis, SMCpro tool and Indicat
RAD CRITICAL LEVES RAD indicator tracks “Relevant Volume” in real time, identifying accumulation and distribution processes, projecting them in the chart as SUPPORT or RESISTANCE zones. Natural   support   and resistance levels are generated by Volume Accumulation and Distribution processes. As these processes evolve, levels at which the relevant volume in the market place is positioned, become difficult areas to cross upwards or downwards. By using this information, traders can identify very s
Eng Gold
Ely Alkrar Xshkaky
ENG-GOLD Scalper It is an auxiliary indicator that identifies potential targets and determines the place of entry with a stop loss that works on Heiken Ashi candles  The green lines are usually the targets, the red lines are the stop loss, and the yellow lines are the entry location.  This file is recognized on small and medium frames, usually less than the watch frame I highly recommend using XAUUSD US100 US30 USOIL 
PZ Trend Trading MT5
PZ TRADING SLU
3.67 (3)
O Trend Trading é um indicador projetado para lucrar o máximo possível com as tendências que ocorrem no mercado, cronometrando retrocessos e rupturas. Ele encontra oportunidades de negociação analisando o que o preço está fazendo durante as tendências estabelecidas. [ Guia de instalação | Guia de atualização | Solução de problemas | FAQ | Todos os produtos ] Negocie mercados financeiros com confiança e eficiência Lucre com as tendências estabelecidas sem ser chicoteado Reconhecer retrocesso
Multi-currency, multi-timeframe, harmonic pattern indicator AB = CD. Supports sending push notifications about signals to a mobile device, messages on e-mail, as well as messages using alerts on all available currency pairs and timeframes. This indicator was based on the indicator Harmonic ABCD Universal. Version for MetaTrader 5:  https://www.mql5.com/en/market/product/44972 . See also: Harmonic ABCD Universal for MetaTrader 4 . Using modern software development methods has made the indicator a
INDICADOR baseado em INTELIGÊNCIA ARTIFICIAL que gera possíveis entradas de chamada e venda para opções binárias. o indicador funciona em 3 estratégias diferentes: 1) ao ler volumes, envia um sinal quando o preço deve reverter 2) através da divergência entre preço e volume, envia um sinal quando a tendência deve continuar ou reverter 3) através da convergência entre preço e volume, envia um sinal de quando a tendência deve continuar. o indicador funciona em todos os prazos, mas os
PZ Day Trading MT5
PZ TRADING SLU
2.83 (6)
Este indicador detecta reversões de preços em zigue-zague, usando apenas análise de ação de preços e um canal donchiano. Ele foi projetado especificamente para negociações de curto prazo, sem repintar ou retroceder. É uma ferramenta fantástica para traders astutos, com o objetivo de aumentar o tempo de suas operações. [ Guia de instalação | Guia de atualização | Solução de problemas | FAQ | Todos os produtos ] Surpreendentemente fácil de negociar Fornece valor em cada período de tempo Imple
Introduction to X3 Chart Pattern Scanner X3 Cherart Pattern Scanner is the non-repainting and non-lagging indicator detecting X3 chart patterns including Harmonic pattern, Elliott Wave pattern, X3 patterns, and Japanese Candlestick patterns. Historical patterns match with signal patterns. Hence, you can readily develop the solid trading strategy in your chart. More importantly, this superb pattern scanner can detect the optimal pattern of its kind. In addition, you can switch on and off individu
The indicator is designed to close positions on the market in time. For example: to take profits ahead of schedule if the price has not reached TakeProfit, and the market is turning around. The indicator analyzes the momentum, not the trend. He does not give any information about the trend. The indicator is well suited for finding divergence. The Ershov 38 Parrots indicator dynamically adjusts to the market and detects price movement impulses of medium and high amplitude. It almost does not rea
How to use Pair Trading Station Pair Trading Station is recommended for H1 time frame and you can use it for any currency pairs. To generate buy and sell signal, follow few steps below to apply Pair Trading Station to your MetaTrader terminal. When you load Pair Trading Station on your chart, Pair Trading station will assess available historical data in your MetaTrader platforms for each currency pair. On your chart, the amount of historical data available will be displayed for each currency pai
MT4 Version SMT Divergences MT5 SMT Divergences is one of the most innovative indicators in the market. It offers the possibility of analyzing price divergences between 2 pairs. These divergences highlight and help to foresee what banks and institutions are planning to do. SMT divergences also provides you with a kill zones indicator and the possibility of filtering divergences occurring during these kill zones.  This indicator is specially powerful if applied in 2 highly correlated pairs. A pr
[ MT4 Version ] Order Block Indicator MT5 Order Block Indicator MT5 is currently the most accurate and customizable indicator in the market. It has been developed to facilitate the analysis of operations based on Order Blocks and Supply and Demand Zones. These zones are possible reversal points of a movement. Order Blocks indicate a possible accumulation of orders in one area. The price usually gets to reach and react strongly to those areas. The most relevant levels for this reaction are the c
BookMap HeatMap
Roberto Spadim
1 (3)
This Indicator creates a heatmap based on depth of market of the current symbol or another symbol. Other symbol is useful when you trade futures market and a contract has 'mini' and 'full' split. For example, in Brazil (B3 - BMF&Bovespa), WDO and DOL are future Forex contract of BRL/USD (where 1 DOL = 5 WDO) and big banks work mostly with DOL (where liquidity is important). Please use with M1 timeframe , objects are too small to be displayed at higher timeframes (MT5 limit). The number of level
Gartley Projections D
Oleksandr Medviediev
3 (2)
The indicator identifies the harmonic patterns (XABCD) according to developments of H.M.Gartley ( "Profits in the Stock Market" , 1935г). It projects D-point as a point in the perspective projection (specify ProjectionD_Mode = true in the settings). Does not redraw. When a bar of the working timeframe closes, if the identified pattern point has not moved during Patterns_Fractal_Bars bars, an arrow appears on the chart (in the direction of the expected price movement). From this moment on, the ar
Splash MT5
Pavel Verveyko
The indicator identifies the most suitable moment for entering the market in terms of market volatility, when the market has the strength to move (the signal is indicated by an arrow under the candle). For each of the signals, the presence of trends on the current and higher timeframes is determined, so that the signal is in the direction of the majority of positions opened on the market (denoted near the signal by abbreviations of timeframes with a trend present). The signal appears after the c
Mais do autor
Quantas vezes você procurou por um PIVOT que funcionasse em uma vela específica todo dia? Muitos traders gostam de estimar a direção da tendência do dia com base em um horário específico de todos os dias, como 30 minutos após a abertura do mercado, ou às 12h, e assim por diante. Esse indicador permite que você especifique um determinado horário (hora e minuto) e traça um pivô a partir desse horário até o dia seguinte, no mesmo horário. Ele mostra cinco linhas com base nesse candle/horário e
FREE
Keltner Enhanced
David Ben Svaiter
5 (1)
O Keltner-Enhanced melhora a precisão e a legibilidade dos Keltner Channels com muitas opções de ajuste, adicionando CINCO novas modalidades de preço ao padrão do Metatrader. O indicador Keltner-E é um indicador em faixas semelhante às Bandas de Bollinger e aos Envelopes de Média Móvel. Eles consistem em um envelope superior acima de uma linha média e um envelope inferior abaixo da linha média.  As principais ocorrências a serem observadas ao usar os Canais de Keltner são rompimentos acima
FREE
O Jurik Advanced MA (JurMA) é um indicador técnico "no-repaint" desenvolvido com base no JMA original concebido por Mark Jurik.  Ele foi projetado para reduzir a defasagem presente nas médias móveis tradicionais, melhorar a suavidade e reduzir o ruído. O JurMA se adapta à volatilidade do mercado e pode ser ajustado pelo usuário quanto à sensibilidade, o que o torna útil para identificar tendências e reversões nos mercados financeiros. Essa adaptabilidade e eficiência o tornam popular entre tr
O HAshi-E é uma forma aprimorada de analisar os sinais do Heiken-Ashi. Resumo: O Heiken-Ashi é particularmente valorizado por sua capacidade de filtrar a volatilidade de curto prazo, o que o torna a ferramenta preferida para identificar e acompanhar tendências, ajuda na tomada de decisões sobre pontos de entrada e saída e auxilia na distinção entre sinais falsos e reversões genuínas de tendências. Diferentemente dos gráficos de velas tradicionais, as velas Heiken-Ashi são calculadas usando
Projetado por Welles Wilder para gráficos diários de commodities, o ADXW agora é usado em vários mercados por traders técnicos para avaliar a força de uma tendência ou mesmo uma tendência para negociações de curto ou longo prazo. O ADXW usa um indicador direcional positivo (DI+) e negativo (DI-) além de sua linha de tendência (ADX). De acordo com Wilder, uma tendência tem força quando o sinal ADX está acima de 25; a tendência é fraca (ou o preço não tem tendência) quando o ADX está abaixo d
O OBV (On-Balance Volume) é um indicador técnico que relaciona volume e preço para identificar movimentos de preço. A ideia básica por trás do OBV é que as mudanças no volume geralmente precedem as mudanças de preço. O indicador acumula volumes para períodos em que o preço fecha em alta e subtrai volumes para períodos em que o preço fecha em baixa. Isso resulta em um valor usado para identificar a direção da tendência do ativo. A interpretação do OBV é simples: um OBV em alta sugere que os co
No campo da análise técnica, a ParbMA surge como uma ferramenta altamente intuitiva para examinar a tendência do SAR Parabólico . Essa abordagem inovadora utiliza uma linha personalizável, que se distingue por sua versatilidade em opções de cor, forma e largura. Essa flexibilidade aprimora a análise visual e ajuda significativamente na elaboração de estratégias e na tomada de decisões. O ParbMA (Parabolic Moving Average) é um indicador técnico personalizado que combina os conceitos do Parabol
Slow AMA
David Ben Svaiter
Em comparação com as médias móveis simples ou exponenciais, as linhas de tendência adaptativas lentas podem oferecer uma visão mais matizada da tendência, ajustando sua sensibilidade com base nas condições do mercado. No entanto, sua natureza lenta também pode significar que elas estão atrasadas na sinalização de reversões quando as condições do mercado mudam rapidamente - e essa é a diferença entre elas e nossa SlowAMA. A SlowAMA foi projetada para ser um indicador de tendência de longo praz
O HAshi-E é uma forma aprimorada de analisar os sinais do Heiken-Ashi. Briefing: O Heiken-Ashi é particularmente valorizado por sua capacidade de filtrar a volatilidade de curto prazo, o que o torna a ferramenta preferida para identificar e acompanhar tendências, ajuda na tomada de decisões sobre pontos de entrada e saída e auxilia na distinção entre sinais falsos e reversões genuínas de tendências. Diferentemente dos gráficos de velas tradicionais, as velas Heiken-Ashi são calculadas usand
Quantas vezes você já procurou um PIVOT que funcionasse em um período de tempo específico todos os dias? Muitos traders gostam de estimar a direção da tendência do dia com base em um intervalo de tempo específico todos os dias, como de 2 horas antes da abertura da NYSE até 1 hora depois, ou da abertura da NYSE até 30 minutos depois. Esse indicador permite que você especifique um determinado intervalo de tempo (hora e minuto) e traça um pivô desse intervalo para o dia seguinte no mesmo inter
VIDYA Enhanced
David Ben Svaiter
O indicador VIDYA-ENHANCED (Variable Index Dynamic Average) é uma ferramenta de análise técnica usada para identificar tendências e movimentos laterais. Ele ajusta dinamicamente sua sensibilidade com base na volatilidade do mercado, usando o Chande Momentum Oscillator como um índice de volatilidade. Esse recurso permite que o VIDYA-ENHANCED seja mais ágil durante os períodos de movimentos significativos de preços, mantendo-se mais estável durante as fases menos voláteis.  Recursos: - Sele
Filtro:
Sem comentários
Responder ao comentário
Versão 3.92 2024.02.16
- Correção de pequenos erros.
Versão 3.91 2024.02.16
- Adição dos novos botões "minimizar" e "restaurar" ao painel de texto.
- As informações de texto agora são exibidas na mesma ordem, independentemente do canto em que o painel é colocado.
- O painel de texto agora funciona com o evento TIMER, reduzindo a carga de CPU relacionada a ele.
- Melhoria no tratamento de DPI para monitores 4K e 8K.
- Correção de um problema intermitente com os valores numéricos na vela 0.
- Foi corrigida a exibição de EMPTY_VALUE no painel.
Versão 3.9 2024.02.15
- Adição de novos botões "minimizar" e "restaurar" ao painel de texto.
- As informações de texto agora aparecem na mesma ordem, independentemente do canto em que o painel será colocado.
- O painel de texto agora funciona com o evento TIMER, reduzindo a carga de CPU relacionada a ele.
- Aprimorado o tratamento de DPI para monitores 4K e 8K.
- Corrigido um problema intermitente com os valores numéricos na vela 0.
Versão 3.4 2024.01.24
- Desempenho otimizado em 10%.