PUA MultiType Pivot MT4
- Indicadores
- Yuriy Ponyatov
- Versão: 1.2
- Atualizado: 28 dezembro 2023
- Ativações: 5
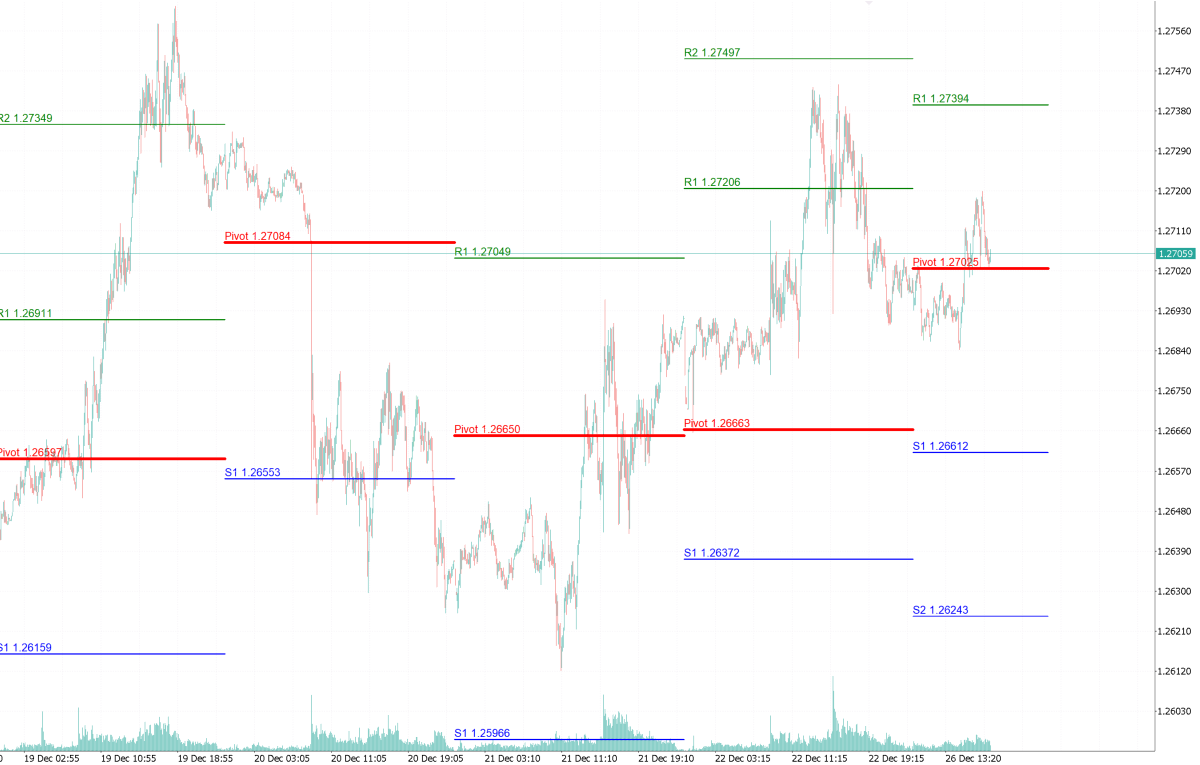
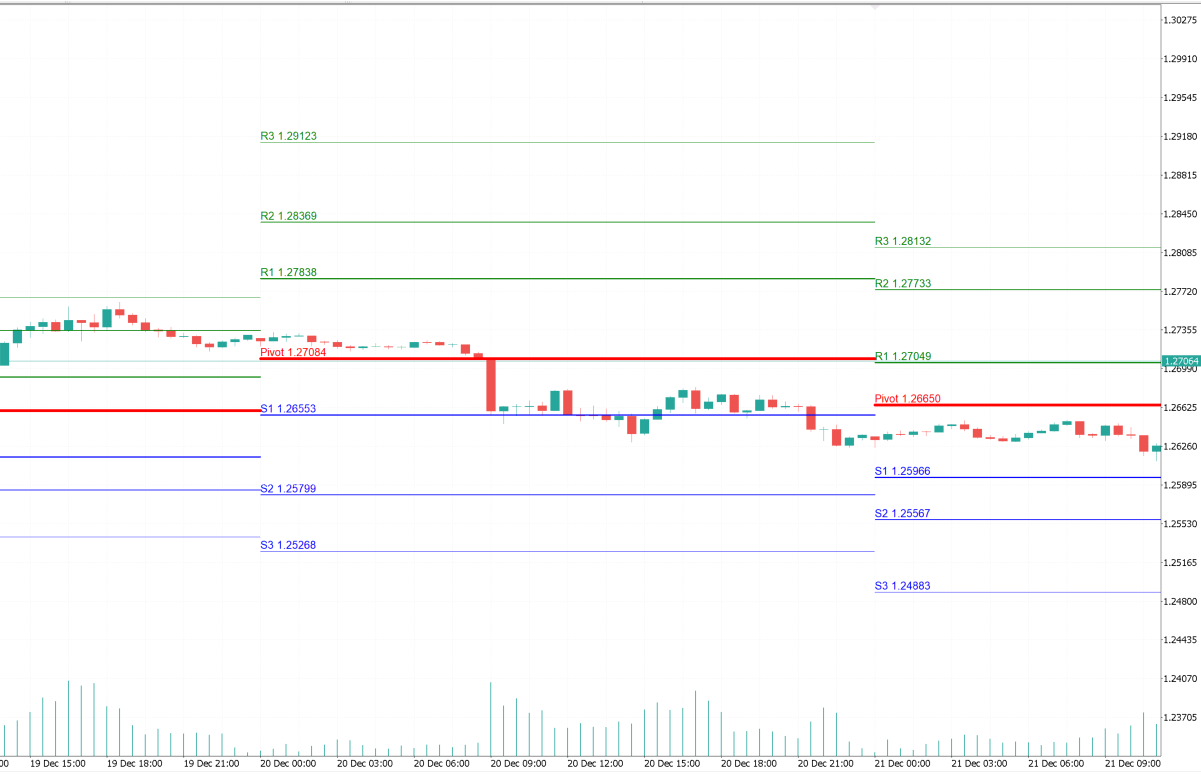
The PUA MultiType Pivot indicator is built on the daily chart of the previous day.
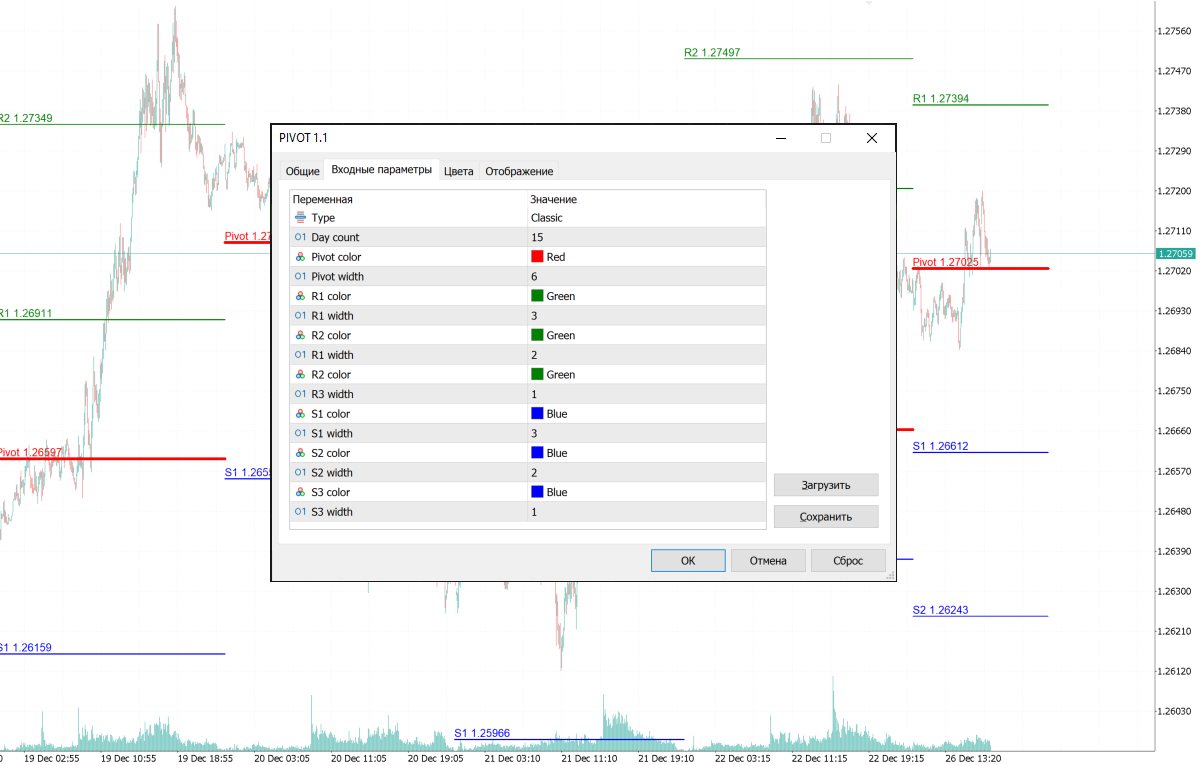
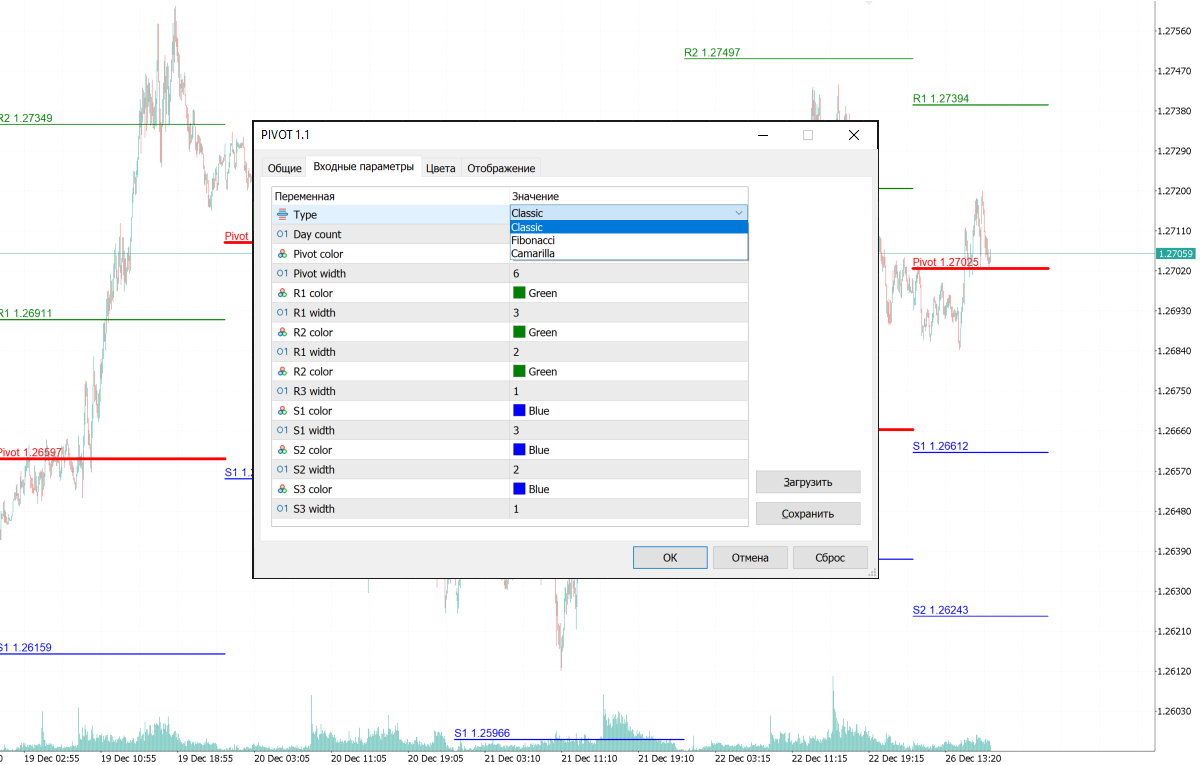
The PUA MultiType Pivot indicator is one of the most popular tools in technical analysis, used by traders to identify potential reversal points in financial markets. This indicator constructs three types of Pivot points: Classic, Fibonacci, and Camarilla, each offering its unique approach to market analysis. The advantages of this indicator include:
Simplicity and Clarity
- PUA MultiType Pivot provides clearly defined support and resistance levels, making them easy to understand and apply even for beginner traders.
Versatility
- These levels can be used over various time frames (from intraday to long-term) and across a wide range of markets, including stocks, forex, futures, and cryptocurrencies.
Predictive Capability
- PUA MultiType Pivot helps to predict potential support and resistance levels before the start of the trading session, providing traders with advanced information.
Functionality in Various Market Conditions
- These levels are effective in both trending and sideways markets, offering opportunities for trading in diverse market scenarios.
Identification of Entry and Exit Points
- PUA MultiType Pivot levels can be used to identify optimal entry and exit points, helping traders maximize profits and minimize losses.
Improved Risk Management
- Identifying clear support and resistance levels allows traders to set more accurate stop-losses and take-profits.
Combination with Other Tools
- PUA MultiType Pivot can be used in conjunction with other indicators and technical analysis methods, enhancing the overall effectiveness of a trading strategy.
Trend Confirmation
- These levels can serve as additional confirmation of trends and reversals, especially when they coincide with other technical analysis signals.
Adaptability to Market Volatility
- PUA MultiType Pivot automatically adapts to changes in market volatility, as they are calculated based on the latest price data.
Value for Intraday Trading
- For intraday traders, these levels provide key zones around which to focus daily trading