Quick Drawing Tool
- Indicadores
- Ao Shen
- Versão: 3.88
- Atualizado: 2 junho 2024
- Ativações: 5
About testing Mode:
1.To get the best usage experience please use the tick data to test and adjust the test speed to proper speed (tick price jump quickly but K bars scroll slowly)!!!
2.Click "Indicator Properties"-> Click "Reset" before testing the indicator to restore the default parameters of the indicator.
1. Compound Drawings
- (1) Line segment with arrow
- (2) Continuous line segment (broken line)
- (3) Parallelogram
- (4) Polygon
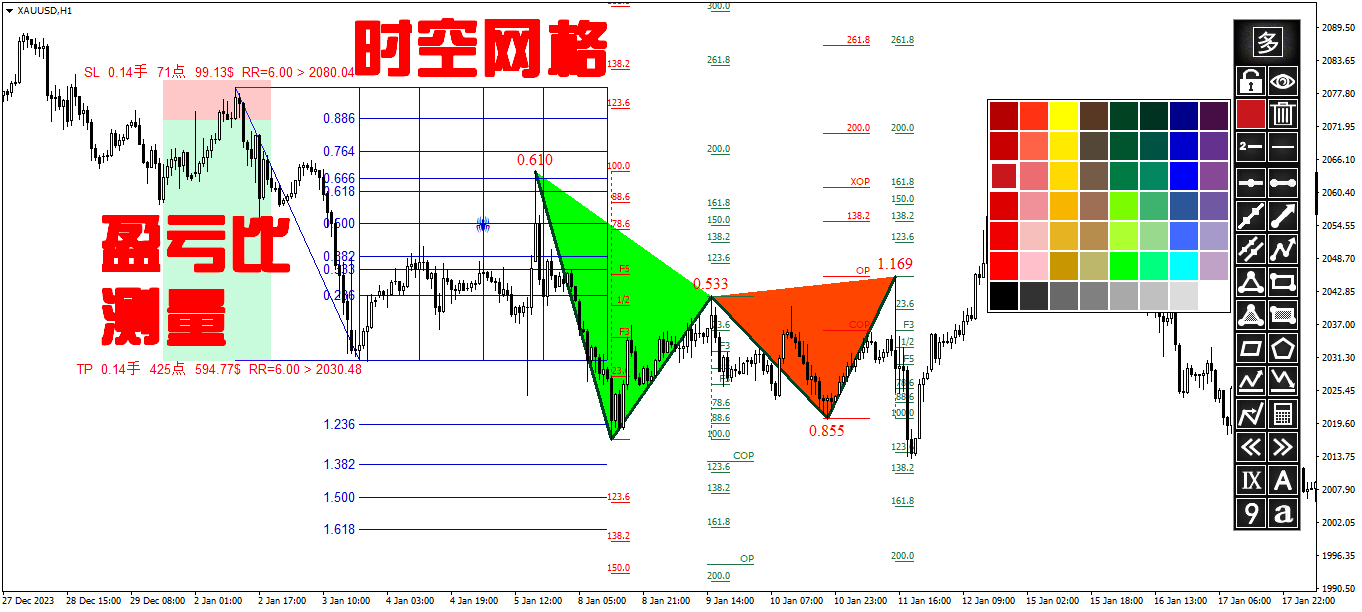
- (5) Profit and loss ratio measurement tools
2. Backtracking By the Z key in the process of drawing the line
Line types that support Z-key backtracking:
continuous line segments (broken line) ,channels,parallelograms,polygons, and fibo extensions.
3.Automatic Adsorption
- (1) Click the "Lock-Button" to switch the automatic adsorption switch before drawing the line
- (2) The shortcut Ctrl key can be used to switch the automatic adsorption during drawing
4. Stretch Horizontally To Right
When drawing a trend line segment or rectangle, click the "Line-Type-Button" or the shortcut key C to switch horizontal extension.
5. Show On TF Of Drawings
Click the "多/单" button and the "Line-Style-Button" to set the single tf/All tf/specified tf display.
6.Stop Drawing
- (1) Click the original location twice
- (2) Click the button on panel
- (3) Click on the price axis on the right
- (4) Special treatment of continuous line segments
- Click in the original location -- without arrow
- Click on the right price axis -- with the arrow
- Click the button to stop -- with arrow
7. Object Selection
Click an object to select it. The information about the selected object is displayed in the upper left corner of the chart and the audio of the object is played. Whether the object is locked or not has different sound effects.
8. Lock/Unlock Selected Object
Select the object and then click the "Lock/Unlock-Button".
9. Object Replication
Select objects (trendline and rectangle) and click the "多/单" button to copy, or the shortcut key V to copy.
10. Delete Selected Object
Select the object and then click the "Delete-Button" to delete.
11. Delete In Batches
Click the "Delete-Button" when no object is selected to bring up the Batch Delete panel.
12. Continuous Lock
Click the "Lock/Unlock-Button" to enable continuous lock mode when no object is selected.
13. Continuous Deletion
Shortcut key D To enable or disable continuous deletion. Click "连续删除" to disable continuous deletion.
14. Hide Drawings
Click the "Visibility-Button" to show and hide all drawn lines.
15. Hide the Candlestick
Shortcut key K hides the candlestick.
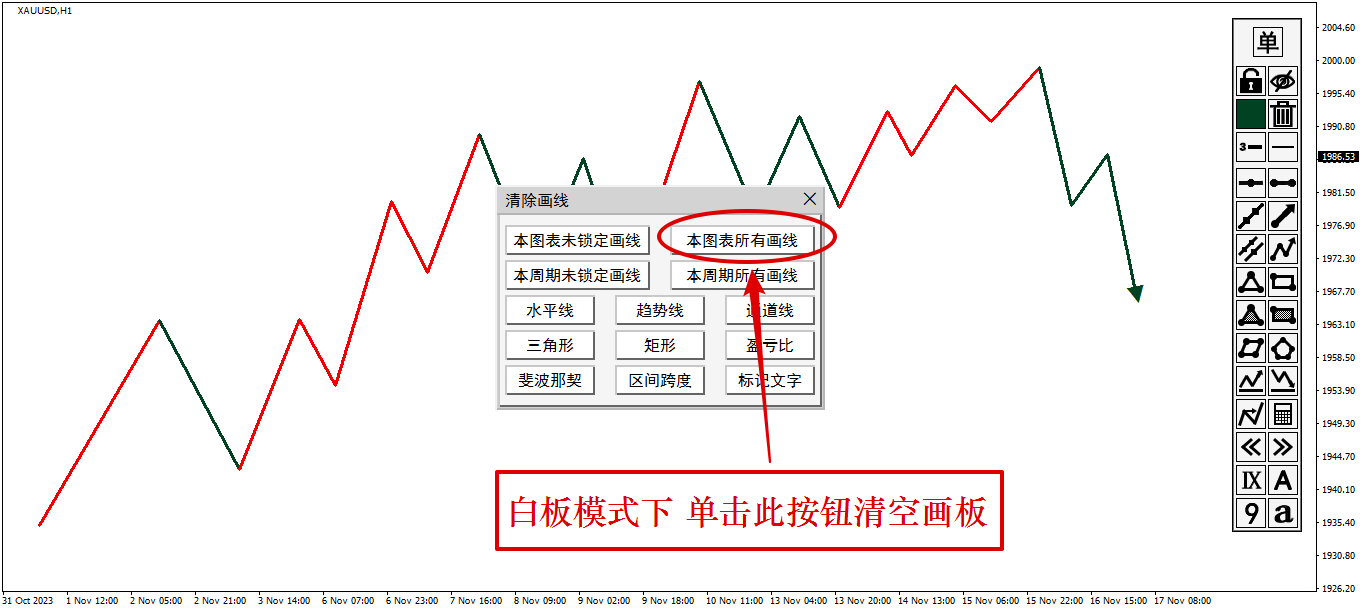
16. Whiteboard Mode
Hide all drawn lines + hide candlestick .
Delete whiteboard contents: If no objects are selected, click Delete to display the Batch Delete panel. Then click All in This Chart to clear the whiteboard
17, Adjust Trend Line To Keep Horizontal/Fibo To Keep Vertical
Select the object (trendline and Fibo callback FIbo extension) and use the shortcut key C.
18. The Trend Line Flips Horizontally
- (1) Shortcut key H-- left and right symmetric horizontal flip
- (2) Shortcut key 2--2:3 more steep horizontal flip
- (3) Shortcut key 3--3:2 more gentle horizontal flip
19, Two-Color Switch
- (1) Shortcut key G - red and green switch
- (2) Shortcut key R - red and blue switch
20.Object Properties Panel
- (1) Double click the object
- (2) Shortcut key E
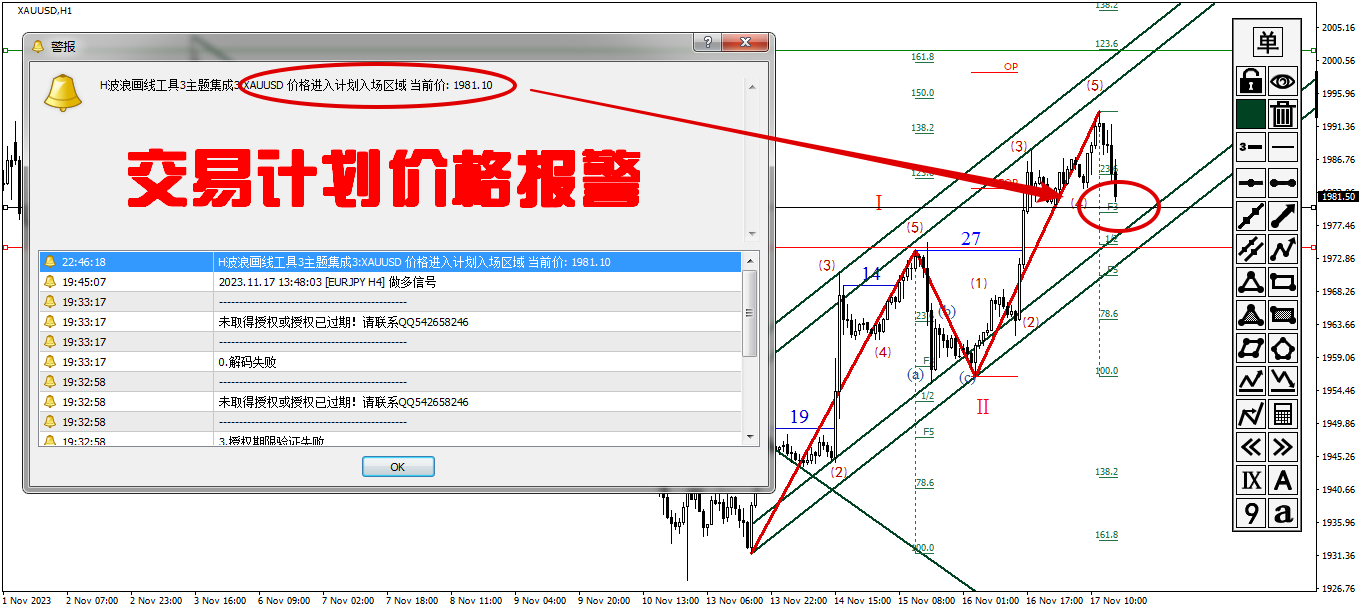
21.Drawings Alert
Double click the objects to bring up the properties panel and click the alarm switch button to turn on and off the alarm
22. Save Screenshots
- (1) Shortcut key J-- bring up the screenshot settings panel
- (2) Shortcut key O-- save the screenshot
InpDivideLine1=*********************************************************************************
InpUseWithEA=false
InpUseTradeBuyLine=false
InpTheme=3
InpSHIcon=0
InpShowSHIcon=true
InpShowOnRight=true
InpShowMainTabByClickAutoHide=true
InpShowMainTabByChartClick=true
InpShowMainTabClickR=30
InpShowMainTabClickY=0
InpPlaySounds=true
InpHShiftIcon=15
InpVShiftIcon=40
InpHShift=15
InpVShift=40
InpDLine1exp1=--------------------------------------------
InpDeleteConfirm=true
InpShowOBJInfo=true
InpShowLineInfo=true
InpChannelRayRight=true
InpChannelPointSize=10
InpCrossLineOnBack=false
InpCrossLineStyle=0
InpDLine1exp2=--------------------------------------------
InpAutoSearchHLOnPlaySound=true
InpTLine0AutoSearchHL=true
InpTLine2AutoSearchHL=false
InpTLine2StretchAutoSearchHL=true
InpChannelAutoSearchHL=true
InpTLineNArrAutoSearchHL=true
InpRectangleAutoSearchHL=false
InpTriangleAutoSearchHL=false
InpPolygonAutoSearchHL=true
InpFiboAutoSearchHL=true
InpExpansionAutoSearchHL=true
InpDLine1exp3=--------------------------------------------
InpHLineBack=true
InpTLineBack=true
InpTLineNArrBack=true
InpPolygonBack=true
InpChannelBack=true
InpDLine1exp4=--------------------------------------------
InpDTLineShowMode=1
InpTimeDifference=18000
InpLocalDTShowDate=false
InpDivideLine2=*********************************************************************************
InpTipPicName=TipPic
InpHisPicOnlyLoadCurSymbol=true
InpTipPicLeft=-3
InpTipPicTop=-3
InpTipPicWidth=0
InpTipPicHeight=0
InpDivideLine3=*********************************************************************************
InpPLLotsType=1
InpPLDefaultLots=0.10000000
InpPLDefaultRisk=100.00000000
InpChangeOnlyOnSelected=true
InpRR1=1.00000000
InpRR2=2.00000000
InpRR3=3.00000000
InpRR4=4.00000000
InpRR5=5.00000000
InpRR6=0.00000000
InpRR7=0.00000000
InpRR8=0.00000000
InpRecSLColorB=150
InpRecTPColorB=1978880
InpRecSLColorW=13158655
InpRecTPColorW=14482120
InpFontName=Arial
InpFontSize=10
InpPLTextColor=255
InpDivideLine4=*********************************************************************************
InpFiboLevelWaveFolder=FiboWav
InpABCMeasureMode=false
InpABCModeFiboShowLevelPrice=false
InpAdjustWaveFiboType=1
InpFiboSearchHLPix=15
InpFiboRateStr=-3.236,-2.236,-2,-1.618,-1,-0.618,-0.5,-0.382,-0.236,0,0.236,0.382,0.5,0.618,0.786,0.886,1,1.236,1.382,1.618,2,2.618,3,3.236,4.236
InpAlertFiboRateStr=0,0.382,0.5,0.618,1,1.382,1.618,2,2.618,3,-0.382,-0.618,-1,-1.618,-2
InpDistinguishFiboLevelWave=true
InpFiboDesStrRight=
InpFiboShowLevelPrice=false
InpFiboBack=true
InpFiboRayRight=false
InpFiboColorB=65535
InpFiboLevelColorB=65535
InpFiboColorW=16711680
InpFiboLevelColorW=16711680
InpFiboLevelWidth=1
InpFiboLevelStyle=0
InpExpansionRateStr=0,0.618,1,1.382,1.618,2,2.618,3
InpAlertExpansionRateStr=0.618,1,1.618,2
InpExpansionDesStrRight=
InpDistinguishExpansionLevelWave=true
InpExpansionShowLevelPrice=false
InpExpansionBack=true
InpExpansionRayRight=false
InpExpansionColorB=65535
InpExpansionLevelColorB=65535
InpExpansionColorW=16711680
InpExpansionLevelColorW=16711680
InpExpansionLevelWidth=1
InpExpansionLevelStyle=0
InpDivideLine5=*********************************************************************************
InpTLineNWithLengthColor=255
InpTLineNWithLengthWidth=2
InpTLineNWithLengthStyle=0
InpTLineNWithLengthTxtColor=255
InpTLineNWithLengthTxtFont_=4
InpTLineNWithLengthTxtFontsize=12
InpTLineNWithLengthAphla=0.10000000
InpTLineNWithLengthTxtVShift=50
InpRSPRateList=1.01,1.02,1.03,1.04,1.05
InpRSPLWidthR=0.25000000
InpDivideLine6=*********************************************************************************
InpRatioListA=0.236,0.333,0.382,0.5,0.618,0.666,0.764,0.886,1.236,1.382,1.5,1.618,2.0,2.618,3.236,4.236
InpRatioListB=0.125,0.25,0.375,0.5,0.625,0.75,0.875,1.125,1.25,1.375,1.5,1.625,1.75,1.875,2.0,2.5,3.0,3.5,4.0
InpRatioListC=0.333,0.5,0.666,1.333,1.5,1.666,2.0,2.5,3.0,3.5,4.0
InpRatioListD=0.3,0.4,0.5,0.6,0.8,0.9,1.2,1.4,1.5,1.6,1.8,2.0,2.5,3.0,3.5,4.0
InpDivideLine7=*********************************************************************************
InpOnBack=true
InpQJT_dn=5
InpQJT_up=120
InpR0=1
InpR1=20
InpNoneQJTLineLength=40
InpQJTLockHRang=15
InpFont=4
InpQJTFontsize=15
InpQJTWidth=1
InpQJTColorB=16777215
InpQJTColorW=16711680
InpDivideLine8=*********************************************************************************
InpWaveBtnFontsize=15
InpMarkListWidth=30
InpMarkSeriesA=1,2,3,4,5,6,7,8,9
InpMarkSeriesB=A,B,C,D,E
InpMarkSeriesC=j,k,l,m,n,o,p,q,r
InpMarkSeriesD=(a),(b),(c),(d),(e)
InpWMAnchor=8
InpFontA_=8
InpFontsizeA=20
InpFontColorA=255
InpFontB_=5
InpFontsizeB=15
InpFontColorB=14772545
InpFontC_=9
InpFontsizeC=15
InpFontColorC=180
InpFontD_=4
InpFontsizeD=12
InpFontColorD=10114859
InpDivideLine7exp0=Wingdings 2
InpDivideLine7exp1=j,k,l,m,n,o,p,q,r
InpDivideLine7exp2=u,v,w,x,y,z,{,|,}
InpDivideLine9=*********************************************************************************
InpShowOnMode=0
InpAppliedM1=false
InpAppliedM5=true
InpAppliedM15=true
InpAppliedM30=true
InpAppliedH1=true
InpAppliedH4=false
InpAppliedD1=false
InpAppliedW1=false
InpAppliedMN1=false
InpDivideLine10=*********************************************************************************
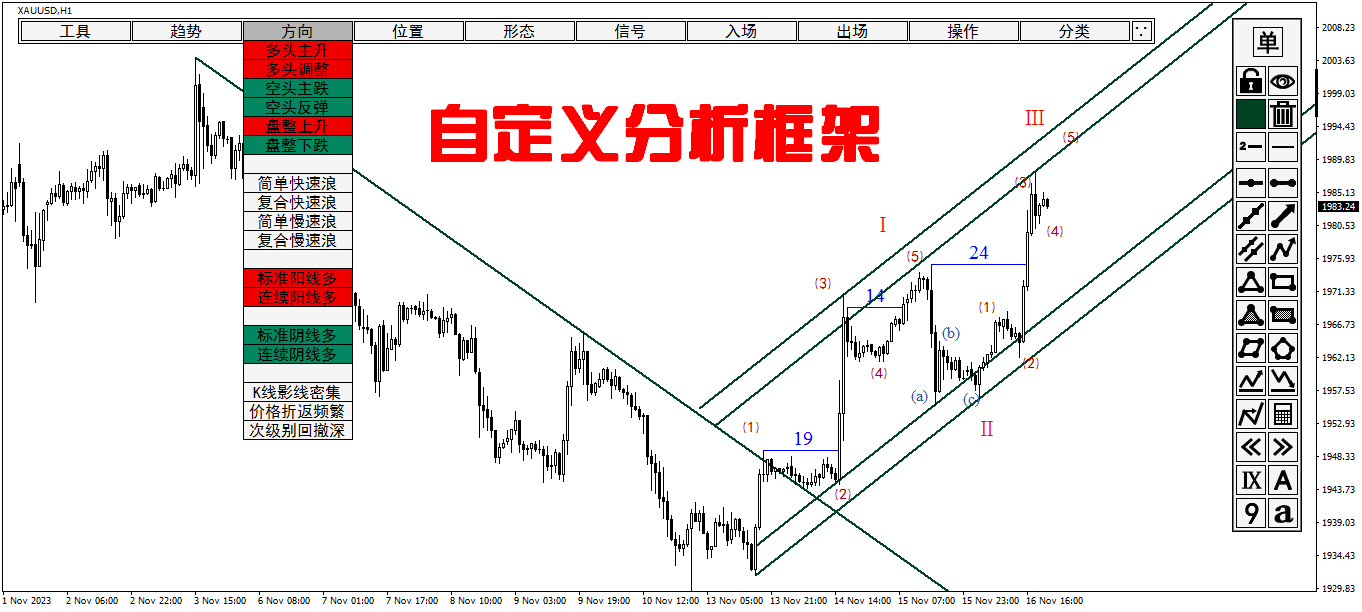
InpUserFrame=1
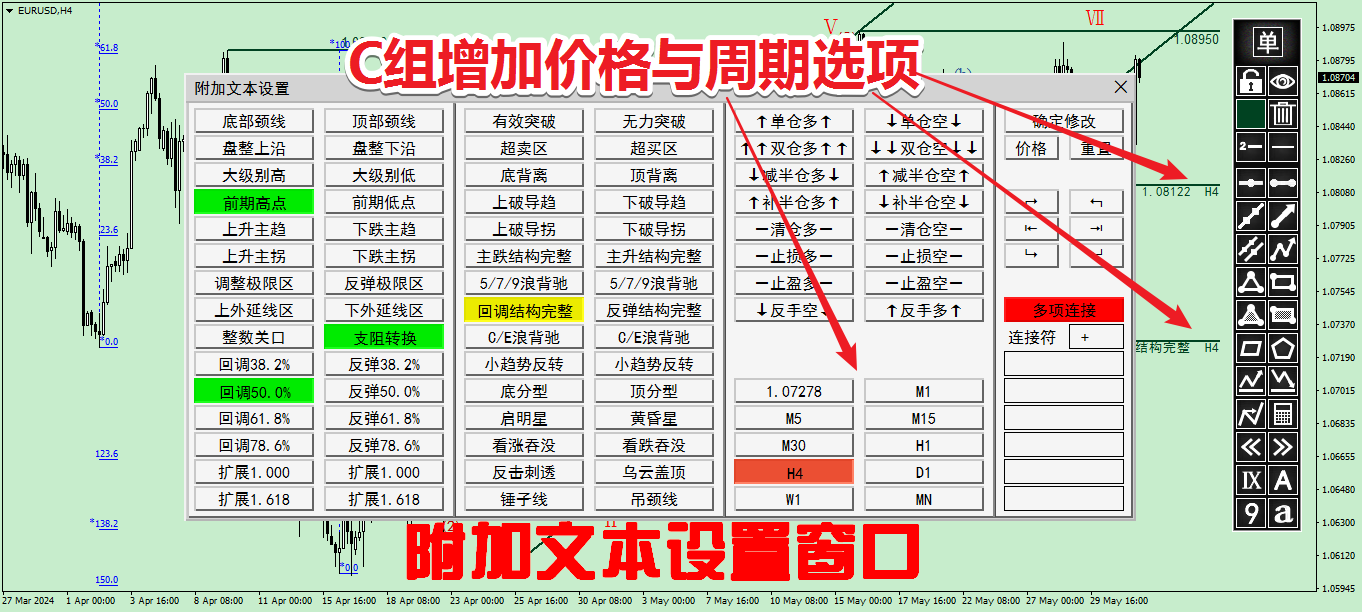
InpShowMarkETabByClickOBJName=TradeInfo_7
InpShowMarkETabByChartClick=true
InpShowMarkETabClickR=30
InpShowMarkETabClickY=0
InpMarkSeriesESpaceString=-
InpMarkSeriesEHead1=Content A|Content B|Content C|Content D|
InpMarkSeriesEHead1SubHead1=A1|A2|A3:
InpMarkSeriesEHead1Sub1=A1mark|A2Mark|A3mark:
InpMarkSeriesEHead1SubHead2=B1|B2|B3:
InpMarkSeriesEHead1Sub2=B1mark|B2mark|B3mark:
InpMarkSeriesEHead1SubHead3=C1|C2|C3:
InpMarkSeriesEHead1Sub3=C1mark|C2mark|C3mark:
InpMarkSeriesEHead1SubHead4=D1|D2|D3:
InpMarkSeriesEHead1Sub4=D1mark|D2mark|D3mark:
InpMarkSeriesEHead2=Content E|Content F|Content G|Content H|
InpMarkSeriesEHead2SubHead1=E1|E2|E3:
InpMarkSeriesEHead2Sub1=E1mark|E2mark|E3mark:
InpMarkSeriesEHead2SubHead2=F1|F2|F3:
InpMarkSeriesEHead2Sub2=F1mark|F2mark|F3mark:
InpMarkSeriesEHead2SubHead3=G1|G2|G3:
InpMarkSeriesEHead2Sub3=G1mark|G2mark|G3mark:
InpMarkSeriesEHead2SubHead4=H1|H2|H3:
InpMarkSeriesEHead2Sub4=H1mark|H2mark|H3mark:
InpMarkSeriesEHead3=Content I|Content J
InpMarkSeriesEHead3SubHead1=I1|I2|I3:
InpMarkSeriesEHead3Sub1=I1mark|I2mark|I3mark:
InpMarkSeriesEHead3SubHead2=J1|J2|J3
InpMarkSeriesEHead3Sub2=J1mark|J2mark|J3mark
InpMarkSeriesEHead3SubHead3=
InpMarkSeriesEHead3Sub3=
InpMarkSeriesEHead3SubHead4=
InpMarkSeriesEHead3Sub4=
InpMarkETabLeft=15
InpMarkETabTop=15
InpMarkEBtnWidth=110
InpMarkEBtnHeight=20
InpMarkEBtnAlign=2
InpFontsizeE=12
InpFontsizeEHead=12
InpBackColorEHeadB=4934475
InpBackColorEHeadW=11842740
TheFontColorEBaseB=16777215
TheFontColorEBaseW=0
InpFontColorE1B=255
InpFontColorE2B=65280
InpFontColorE3B=8421504
InpFontColorE1W=255
InpFontColorE2W=6326018
InpFontColorE3W=8421504
InpKeyWords1_=A
InpKeyWords1r_=Mark
InpKeyWords2_=
InpKeyWords2r_=
InpKeyWords3_=
InpKeyWords3r_=
InpBackColorE1B=180
InpBackColorE2B=1978880
InpBackColorE1W=240
InpBackColorE2W=6326018
InpDivideLine11=*********************************************************************************
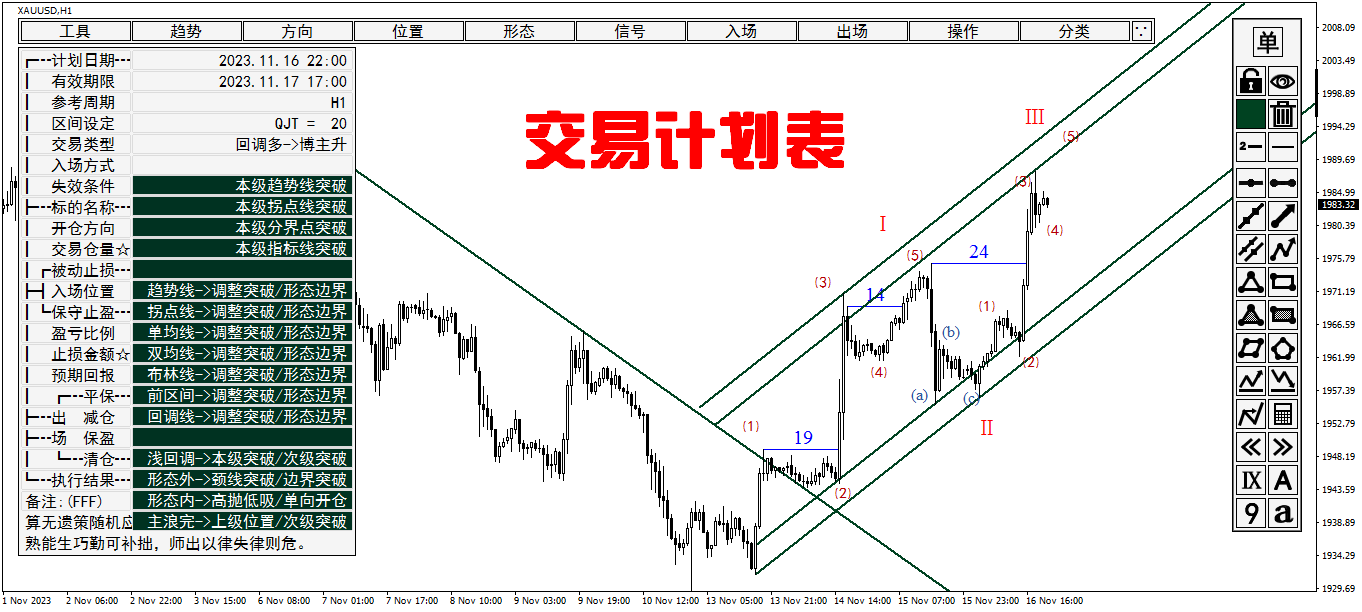
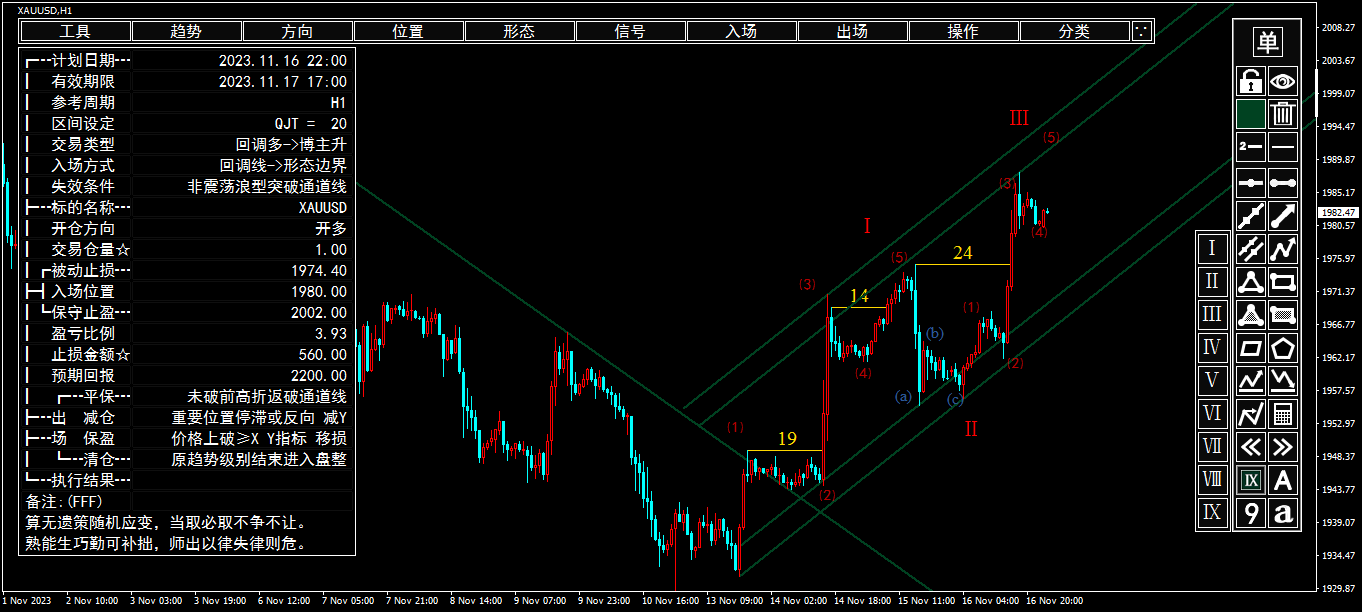
InpTradePlanFrame=0
InpSHPTSheetByClickOBJName=TradeInfo_12
InpClilckRightPBarSHPTSheet=true
InpRightPBarSHPTSheetRate1=0.90000000
InpRightPBarSHPTSheetRate2=1.00000000
InpTradePlanSheetSpaceString=-
InpTradePlanSheet_TF_=M1|M5|M15|M30|H1|H4|D1|W1|MN1|M5 + M1|M15 + M5|H1 + M15|H4 + H1|D1 + H4|W1 + D1|M15 + M5 + M1|H1 + M15 + M5|H4 + H1 + M15|D1 + H4 + H1|W1 + D1 + H4
InpTradePlanSheet_QJT_=QJT = 5|QJT = 10|QJT = 20|QJT = 30|QJT = 40|QJT = 50|QJT = 60|QJT = 70|QJT = 80|QJT = 90|QJT = 100|QJT = 120|QJT = 150
InpTradePlanSheet_TradeTypeA_=
InpTradePlanSheet_TradeTypeB_=
InpTradePlanSheet_EntryModeA_=
InpTradePlanSheet_EntryModeB_=
InpTradePlanSheet_EntryModeC_=
InpTradePlanSheet_FailureCondition_=
InpTradePlanSheet_OpenDirection_=
InpTradePlanSheet_BreakEvenA_=
InpTradePlanSheet_BreakEvenB_=
InpTradePlanSheet_BreakEvenC_=
InpTradePlanSheet_PositionReduceA_=
InpTradePlanSheet_PositionReduceB_=
InpTradePlanSheet_PositionReduceC_=
InpTradePlanSheet_ProfitProtectionA_=
InpTradePlanSheet_ProfitProtectionB_=
InpTradePlanSheet_ProfitProtectionC_=
InpTradePlanSheet_CloseAllA_=
InpTradePlanSheet_CloseAllB_=
InpTradePlanSheet_CloseAllC_=
InpTradePlanSheet_ExecutionResult_=
InpDivideLine12=*********************************************************************************
InpHTLShowPriceLabel=true
InpHTLPriceLabelFontsize=10
InpTrendStretchBars=40
InpHTLInfoTxtSettingTabFontsize=12
InpBringKBarsTopWhenOPInfoTxtTab=true
InpHTLInfoTxtFrame=0
InpHTLInfoStrList1=GroupA_1_1|GroupA_1_2|GroupA_1_3
InpHTLInfoStrList2=GroupA_2_1|GroupA_2_2|GroupA_2_3
InpHTLInfoStrList3=GroupB_1_1|GroupB_1_2|GroupB_1_3
InpHTLInfoStrList4=GroupB_2_1|GroupB_2_2|GroupB_2_3
InpHTLInfoStrList5=GroupC_1_1|GroupC_1_2|GroupC_1_3|%&Spc%|%&Spc%|%&Spc%|%&Spc%|%&Spc%|%&Spc%|%&Spc%|%$|M5|M30|H4|W1
InpHTLInfoStrList6=GroupC_2_1|GroupC_2_2|GroupC_2_3|%&Spc%|%&Spc%|%&Spc%|%&Spc%|%&Spc%|%&Spc%|%&Spc%|M1|M15|H1|D1|MN
InpDivideLine13=*********************************************************************************
InpClilckRightPBarDrawPRng=true
InpRightPBarDrawPRngRate1=0.00000000
InpRightPBarDrawPRngRate2=0.10000000
InpRightPBarDrawPRngAutoChangeTF=true
InpChangeTFByClickRngInfo=true
InpRecColorB=2631720
InpRecColorW=11119017
InpDivideLine14=*********************************************************************************
InpRecAlertTimeLimit=false
InpAlertR0=100.00000000
InpAlertTotalLen=60
InpAlertWavLen=18
InpPlanTradeAlertOnOff=true
InpAlertDefaultPlaySound=true
InpAlertDefaultAlert=true
InpAlertDefaultNotification=false
InpAlertDefaultEMail=false
InpAlertDefaultContinuously=false
InpAlertDefaultTF=15
InpClickPriceAxisSHProperty=false
InpClickPriceAxisRate1=0.75000000
InpClickPriceAxisRate2=0.85000000
InpDivideLine15=*********************************************************************************
InpKeyScrShootSetting=74
InpKeySaveChartPic=79
InpChartPicWithDate=true
InpKeyShowHideTipPic=85
InpKeyShowHideHisPic=89
InpKeyTipPicOnBack=66
InpKeyChangeChartColorRev=188
InpShowCurPriceLine=false
InpKeyShowRecInfo=73
InpKeyStopPlaySound=192
InpKeyMainTabShowHide=81
InpKeyShowHideMarkETab=87
InpKeyChangeMarkETabPosition=0
InpKeySetOBJStyle=0
InpOBJStyleModTabFontSize=12
InpKeyShowPlanSheet=84
InpKeyShowPlanTradeLines=76
InpKeyKbarShowHide=75
InpKeyOBJAlertOnOff=65
InpKeyShowHideAlertLines=77
InpShowHideAlertLinesChangeSelect=false
InpIncreaseWidthShowAlertLines=0
InpShowHideAlertLinesDotSize=7
InpShowHideAlertLinesKbarSpace=2
InpKeyOBJDelete=68
InpKeyOBJShowHide=72
InpKeyOBJLock=83
InpKeyTrendHLock=67
InpKeyOBJDeleteByClick=17
InpOBJDeleteByClickOnlyDTCreated=false
InpKeySwitchHTLStretchRight=32
InpKeyDeleteWaveMark=0
InpBackspaceKey=90
InpApplyTFChange=true
InpLastTFKey=90
InpNextTFKey=88
InpSkipM30=true
InpTFFontName=Impact
InpTFFontSize=180
InpTFFontColor=2175488
InpApplyMainTFChange=true
InpMainTFKey=0
InpMainTF1=1440
InpMainTF2=60
InpKeyChartShiftSize=9
InpShiftValue=15
InpKeyCopyTLine=86
InpKeyHReverseTLine=78
InpKeyHReverseTLine1=50
InpKeyHReverseTLine2=51
InpKeyChangeColor2RedGreen=71
InpKeyChangeColor2RedBlue=82
InpKeyVerticalMove=190
InpKeyQJT=0
InpKeyFibo=70
InpKeyExpansion=69
InpKeyHLine=0
InpKeyTLine2=0
InpKeyTLine=0
InpKeyTLineArr=0
InpKeyChannel=0
InpKeyTLineNArr=0
InpKeyTriangle=0
InpKeyRectangle=0
InpKeyTrianglefill=0
InpKeyRectanglefill=0
InpKeyRectangle2=0
InpKeyPolygon=0
InpKeyBuyPL=0
InpKeySellPL=0
InpVersionDT=1717372800
InpDivideLine16=*********************************************************************************