Conheça o Mercado MQL5 no YouTube, assista aos vídeos tutoriais
Como comprar um robô de negociação ou indicador?
Execute seu EA na
hospedagem virtual
hospedagem virtual
Teste indicadores/robôs de negociação antes de comprá-los
Quer ganhar dinheiro no Mercado?
Como apresentar um produto para o consumidor final?
Indicadores Técnicos para MetaTrader 4 - 9
Get all the moving averages in one indicator. Simple moving average, Exponential moving average, Smoothed moving average, Linear weighted moving average, Double Exponential Moving Average, Triple Exponential Moving Average, T3 Moving Average and MORE. Find in the comments a Free Expert Advisor that uses the XPMA . It will show you how easy to make an EA based on the XPMA (XP MOVING AVERAGE). Settings: Moving Average Type: The Moving Average Type. It can be one of these types: SMA (Simple Moving

When you purchase an indicator, contact me for a price highlighting indicator from me -Heir Wolf TF. This is a very interesting indicator and I am giving it as a bonus! This indicator alone can take your entire trading to the next level. Video on the indicator here And together with the Trade Compass10 indicator, this will become your main trading system, and you will be several steps ahead of other traders. Trade Compass10 is an extremely simple and understandable indicator for a trader
Top and Bottom Scalper
BINARY AND FOREX
The signals indicate strong reversal points (Tops/bottoms)- The indicator gives accurate signals on any currency pairs and instruments. It also has a setting for adjusting the frequency of the signals. It is further strengthened and made robust by the support and resistance zones. There are different qualities of zones as per robustness.
Inputs ZONE SETTINGS; BackLimit - default is 10 000. Check the past bars for formations. First Time Fram

The breakout algorithm is a technique based on price, price features, to shape a breakout strategy. The strategy in this indicator will not be redrawn (none-repaint indicator), it is suitable for short or long term traders In the screenshot is the EURUSD pair, these currency pairs, commodities or stocks, it have similar strength *Non-Repainting (not redrawn) *For Metatrader4 Only *Great For Scalping *Great For Swing Trading *Arrow Entry, Green is Long, Red is Short *Works On Any Timeframe *Work

The Price Action Finder Multi indicator is an indicator of entry points that searches for and displays Price Action system patterns on dozens of trading instruments and on all standard time frames: (m1, m5, m15, m30, H1, H4, D1, Wk, Mn). The indicator places the found patterns in a table at the bottom of the screen. By clicking on the pattern names in the table, you can move to the chart where this pattern is located. Manual (Be sure to read before purchasing) | Version for MT5 Advantages
1. Pa

O LordAutoTrendLine é um indicador para MetaTrader que foi desenvolvido com intuito de analisar linhas de tendências de alta e baixa do mercado financeiro. Linhas de tendências são usadas para calcular junto com uma Fibonnaci por exemplo, a alta e baixa de um par de moedas. No exemplo das imagens H4, podemos ver uma linha cruzando 1790 alta e 1784 baixa, um exemplo, se ir abaixo de 1784 significará venda, e muito com certeza de acordo com a linha, pode chegar a 1790 primeiro sem nenhum muito esf

FALCON ZONES , OPORTUNIDADES EN EL MERCADO PARA COMPORAR O VENDER
Características Destacadas: Identificación de Patrones de Velas: Reconoce una amplia gama de patrones de velas, desde patrones simples hasta formaciones más complejas. Proporciona una visión completa de la psicología del mercado encapsulada en las velas. Alertas Personalizadas: Configura alertas a medida para los patrones de velas que más te interesan o que se alinean con tu estrategia. Recibe notificaciones instantáneas cuando
FREE

Este indicador examina a estrutura de preços de fractais de diferentes períodos para determinar possíveis pontos de reversão no mercado, proporcionando tempo aos traders posicionais que já possuem um modelo de avaliação fundamental ou técnico. Diferentemente de seu irmão mais novo, Reversal Fractals , esse indicador não perde reversões por causa do período selecionado e encontra fractais de reversão em zigue-zague, ignorando as reversões que não possuem impulso suficiente para iniciar um movime

As linhas de tendência são a ferramenta mais essencial de análise técnica na negociação forex. Infelizmente, a maioria dos traders não os desenha corretamente. O indicador Automated Trendlines é uma ferramenta profissional para traders sérios que o ajudam a visualizar o movimento de tendências dos mercados.
Existem dois tipos de Trendlines Bullish Trendlines e Bearish Trendlines.
Na tendência de alta, a linha de tendência Forex é desenhada através dos pontos de oscilação mais baixos do m
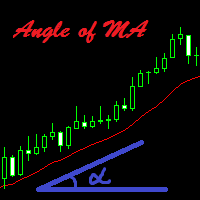
The indicator calculates the inclination angle of the Moving Average and displays the result on the screen. Users can select the start and end points to measure the inclination of the MA. It is also possible to set the angle value, and if the inclination angle exceeds the specified value, the indicator will play a sound alert and display a message on the screen.
Configurations Left_Shift_of_MA=1; - Shift of the MA to calculate the inclination angle (start point) Right_Shift_of_MA=0; - Shift of
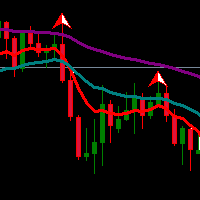
Exponential Moving Average (EMA) is an indicator that often be used by traders. Combination of two or three EMA indicators often applied to determine trend direction. Multiple EMA combined with fractals or oscillator indicator to detect overbought/oversold and divergence point also great to do in trading system.
If you like EMA indicator and want to get better indicator, highly recommended using EMA SuperTrend Strategy Indicator if you want to get better result in here:
https://www.mql5.com/
FREE

YOU CAN NOW DOWNLOAD FREE VERSIONS OF OUR PAID INDICATORS . IT'S OUR WAY OF GIVING BACK TO THE COMMUNITY ! >>> GO HERE TO DOWNLOAD The system is a free open source pine script originally published on TradingView by everget . It was converted to Mt4 by Forex Robot Makers. This system is a popular trend indicator based on ATR ( Average True Range ) , Moving Averages and the Donchian channel .
System BackGround
ATR The average true range is an indicator of the price volatility of an as
FREE
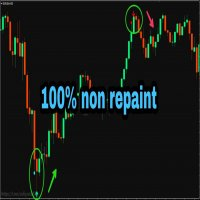
PLEASE NOTE You can customize the settings of K_period value, the oversold and the overbought value is customizable. You can change it as per your requirement. The accuracy will change as per your settings.
100% Non repaint indicator
Pre-alert (get ready) signals
Non-delay indications
24/7 signals
100% No lag
No recalculating The arrows wont repaint even if the signal fails, or you refresh or restart the mt4 Indicator is based on simple crossover strategy of main line and signal line
FREE

Apresentamos o HorizonFX, um oscilador de mercado inovador, projetado com precisão para traders de Forex que buscam uma vantagem competitiva. Desenvolvido a partir de uma fórmula proprietária, o HorizonFX vai além das métricas tradicionais, fornecendo sinais assertivos de compra e venda que ajudam a identificar movimentos de mercado com maior precisão. Características do HorizonFX: Cálculo Único : Utiliza uma combinação exclusiva de variáveis de mercado e matemática avançada para gerar suas linh

This is the only Indicator you need to navigate TIME and PRICE . Here I present to you: ICT Killzone Gem Indicator . This indicator will SAVE YOU TIME marking up the charts so you can FOCUS more on your Trades. You can customize it however you like. There is also a toggle switch where you can toggle on or off a specific part so that you can make your charts clean. Watch the video for a Full Explanation . Leave a Review about your experience with this Indicator : ) Inside the Indicator:
2
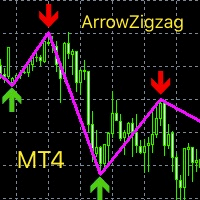
This index is based on the secondary development of zigzag, adding high and low point arrow indication, thickening the line and changing the color. Can be a good display of the current admission trading signals, current long or short. It can be combined with other indicators to determine the trading point, which has great reference value. Compared with the general trend index or oscillation batch standard, the accurate determination is higher from the perspective of historical data research and
FREE
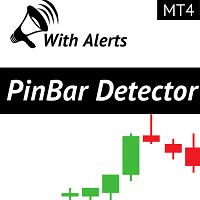
Pin Bar Detector é um indicador que encontra o padrão de ação de preço de Pin Bars no gráfico. Pin Bars é um atalho para "Pinóquio Bars", que é uma alternativa clássica de padrão de barra para castiçais japoneses com sombras superiores ou inferiores altas e corpos muito pequenos como Dragon Fly Doji, Grave Stone Doji, Hammer, Inverted-Hammer, Hanging Man e Shooting Star .
OFERTA POR TEMPO LIMITADO: O Indicador está disponível por apenas 50 $ e vitalício. (Preço original 125$)
Característi
FREE

Introduction Harmonic Patterns are best used to predict potential turning point. Traditionally, Harmonic Pattern was identified manually connecting peaks and troughs points in the chart. Manual harmonic pattern detection is painfully tedious and not suitable for everyone. You are often exposed under subjective pattern identification with manual pattern detection. To avoid these limitations, Harmonic Pattern Plus was designed to automate your harmonic pattern detection process. The functionality

Blahtech Fisher Transform indicator is an oscillator that displays overbought and oversold locations on the chart. The Fisher Transform algorithm transforms prices with any distribution shape into a normal distribution. The end result is a curve with sharp turning points that may help to identify bullish or bearish trends. Fisher Transform values exceeding 1.66 on the daily chart are considered to be good areas for reversal trades. Links [ Install | Update | Training | All Products ]

The ACB Breakout Arrows indicator provides a crucial entry signal in the market by detecting a special breakout pattern. The indicator constantly scans the chart for a settling momentum in one direction and provide the accurate entry signal right before the major move.
Get multi-symbol and multi-timeframe scanner from here - Scanner for ACB Breakout Arrows MT4
Key features Stoploss and Take Profit levels are provided by the indicator. Comes with a MTF Scanner dashboard which tracks the brea

Dark Inversion is an Indicator for intraday trading. This Indicator is based on Counter Trend strategy but use also Volatility. We can enter in good price with this Indicator, in order to follow the inversions on the current instrument. Hey, I made an Expert Advisor based on this indicator, if you are interested: Dark Titan
Key benefits
Easily visible Inversion Lines Intuitive directional arrows Automated adjustment for each timeframe and instrument Easy to use even for beginners Never rep
FREE
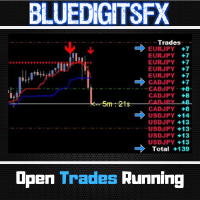
MT5 Version Available Here: https://www.mql5.com/en/market/product/62376
Telegram Channel & Group : https://t.me/bluedigitsfx
V.I.P Group Access: Send Payment Proof of any of our Paid Products to our Inbox
Recommended Broker: https://eb4.app/BDFXOsprey * The Most Sought After Pip Counter for Metatrader ! Features
Will show Currency Symbol in BLUE for Buy positions. Will show Currency Symbol in RED for Sell positions. Will Show pips in BLUE Color for Positive Pips Will Show pips in
FREE

I present an indicator for professionals. ProfitMACD is very similar to classic MACD in appearance and its functions . However, ProfitMACD is based on completely new algorithms (for example, it has only one averaging period) and is more robust, especially on small timeframes, since it filters random price walks. The classic MACD indicator (Moving Average Convergence / Divergence) is a very good indicator following the trend, based on the ratio between two moving averages, namely the EM
BBMA, which stands for Bollinger Bands and Moving Average , is a trading method that is quite popular and widely used not only in the forex market but also in the stock and commodity markets. This strategy is different from another version of BBMA called BBMA Oma Ally, which uses two Moving Averages. In the BBMA strategy, traders use the Bollinger Bands to spot possible changes in direction and the Moving Average to decide when it's a good time to get in on a trade .
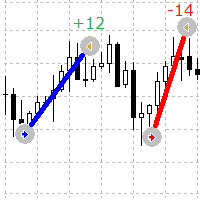
Um indicador simples, mas útil, para ver visualmente os pontos de entrada e saída de pedidos no gráfico
Este indicador mostra os pedidos abertos atuais e os pedidos concluídos no símbolo
Parâmetros do indicador
Lines Buy color - especifica a cor das linhas para ordens de compra Lines Sell color - especifica a cor das linhas para ordens de venda Lines Width - define a largura da linha, funciona para tipos de estilo sólido Lines style - define o estilo das linhas Lines positive profit color
FREE

This indicator allows you to manage your exposure and see how the lot changes. You can choose the optimal lot value for your deposit without opening real positions. And also evaluate new trading instruments. If you trade manually, then risk management will help you avoid unexpected losses. The indicator includes the ability to receive a sound signal when a specified level is reached, as well as send push notifications and a message to the mail.
FREE

This indicator has been created for finding the probable reversal points of the symbol price. A small candlestick reversal pattern is used it its operation in conjunction with a filter of extremums. The indicator is not redrawn! If the extremum filter is disabled, the indicator shows all points that have a pattern. If the extremum filter is enabled, the condition works – if the history Previous bars 1 candles back contains higher candles and they are farther than the Previous bars 2 candle, such
FREE

Ultimate Volatility Scanner (Multi Pair And Multi Time Frame) : ---LIMITED TIME OFFER: NEXT 25 CLIENTS ONLY ---46% OFF REGULAR PRICE AND 2 FREE BONUSES ---SEE BELOW FOR FULL DETAILS Volatility expansion and contraction is a fundamental market principle that will NEVER go away.
And some of the largest institutions in the world invest enormous amounts of capital into various
types of volatility strategies. Not only for profit driven trading strategies, but also for risk control.
VOLATI

The indicator synchronizes eight types of markings on several charts of one trading instrument.
This indicator is convenient to use in conjunction with "Multichart Dashboard" or other similar assistant that allows you to work with several charts at the same time.
"Multichart Dashboard" can be found under the link on my youtube channel.
Settings:
enable vertical line synchronization
enable horizontal line synchronization
enable Trend Line synchronization
enabling Fibonacci Retracement
FREE
Thank you for your interest in "Goldfish Indicator". I have been trading since 2008. I usually trade on Renko chart in reversal pattern with Goldfish Indicator. If you share your vps details with me, I will connect your account (Live/Demo). To get proper results copy my trades for at least 30 days. Minimum Deposit: $1000 Leverage: 100:1 Profit Target: Monthly average profit target is 10% to 20%+/- Draw-down: The average drawdown is 10% to 20% Risk
Warning: Trading financial products on margin
FREE

Necessary for traders: tools and indicators Waves automatically calculate indicators, channel trend trading Perfect trend-wave automatic calculation channel calculation , MT4 Perfect trend-wave automatic calculation channel calculation , MT5 Local Trading copying Easy And Fast Copy , MT4 Easy And Fast Copy , MT5 Local Trading copying For DEMO Easy And Fast Copy , MT4 DEMO Easy And Fast Copy , MT5 DEMO Bandas de Bollinger Avançadas:
1. O trilho Bollinger mudará de cor com a direção "
2. A ex
FREE

Dashboard for Ma Speedometer: https://www.mql5.com/en/market/product/116784
Non standard attitude to the standard moving average indicator. The essence of the indicator is to determine the strength and speed of the price direction by determining the tilt angle of the moving average. A point is taken on the fifteenth MA candle and a point on the last closed MA candle, a straight line is drawn between them, it is movable and on a hemisphere shows an angle of inclination from 90 degrees to -90.
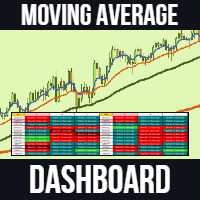
Moving Average Dashboard Pro is an improved and advanced indicator of the free version "Moving Average Crossover Bars ago Dashboard" The moving average dashboard pro gives you a dashboard view of bullish and bearish moving average crossovers. For example, if there was a bullish moving average crossover 5 sessions ago, then you would see 5 bars ago . This indicates that there was a bullish crossover 5 sessions ago. This indicator is useful if you want to catch the trend early on when using moving
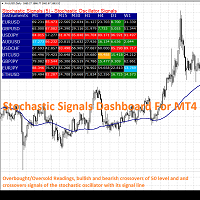
Stochastic Signals is a simple dashboard type indicator that displays the values of the stochastic oscillator on various instruments and time frames chosen by the user. The stochastic is usually used in many trading strategies, especially in countertrend systems when the price reaches overbought/oversold conditions. In addition, this indicator can be configured by the trader to show signals when the stochastic oscillator is in an overbought/oversold condition, when it crosses these levels or whe

BeST_123 Strategy is clearly based on the 123_Pattern which is a frequent Reversal Chart Pattern of a very high Success Ratio . It occurs at the end of trends and swings and it’s a serious indication of high probability for a change in trend. Theoretically an 123_pattern is valid when the price closes beyond the level of #2 local top/bottom, a moment when the indicator draws an Entry Arrow, raises an Alert and a corresponding Position can be opened. The BeST 123_Strategy Indicator is non-repai

The " YK Find Support And Resistance " indicator is a technical analysis tool used to identify key support and resistance levels on a price chart. Its features and functions are as follows:
1. Displays support and resistance levels using arrow lines and colored bands, with resistance in red and support in green.
2. Can be adjusted to calculate and display results from a specified timeframe using the forced_tf variable. If set to 0, it will use the current timeframe of the chart.
3. Uses t
FREE

Market Heartbeat in your hand! Introduction The Market Heartbeat indicator with a special enhanced algorithm (volume, money flow, cycle of market and a secret value) is a very repetitive trend finder with a high success rate . Interestingly, this Winner indicator indicates that the trend has changed its direction or the end of a trend retracement or even appears at the range market. The Market Heartbeat can use in scalping trading or trend trading. It finds immediately with alarm, notification a

Trade History for MT4 This indicator is specially developed for that traders want to display his trades on the charts. Shows history and current deals on the chart. Trades show on the chart with a dotted line, and profit will show realtime. Buy trades are displayed in bull color, Sell trades in bear color.
Tip: The historical order displayed by the indicator is associated with the "Account History", so please set the historical order display in the "Account History" of MT software.
If yo
FREE

The indicator displays price distribution on a horizontal histogram. Horizontal histogram help find out key levels of price so that you can make good decision on setting point of take profit, stop loss... You can improve exist trading strategy or get new trading idea with the histogram of price.
Outstanding features Support multiple time frame : you can choose to work with history data in any time frame you want. It does not depend on current display time frame.
Support weighting by volume a
FREE

Padrões Harmônicos são mais bem utilizados para prever pontos de virada no mercado. Esses padrões oferecem uma alta taxa de vitória e diversas oportunidades de negociação em um único dia de negociação. Nosso indicador identifica os Padrões Harmônicos mais populares com base nos princípios descritos na literatura de Negociação Harmônica. NOTAS IMPORTANTES: O indicador não repinta, não atrasa (detecta um padrão no ponto D) e não REDRAW (o padrão é válido ou cancelado). COMO USAR: Arraste e solte o
FREE

Moving Average Trend Alert is a triple MA indicator that helps traders to identify potential market trends based on 3 MAs alignment and crossover.
Moving Average Trend Alert features: Customizable short-term, medium-term, and long-term MAs. Option to filter signals based on a minimum distance between moving averages to avoid premature MAs alignment. Optional Filter of signals with RSI indicator overbought/oversold levels. Optional Filter of signals with ADX indicator. Popup, email, and phone n
FREE

The indicator produces signals according to the methodology VSA (Volume Spread Analysis) - the analysis of trade volume together with the size and form of candlesticks. The signals are displayed at closing of bars on the main chart in the form of arrows. The arrows are not redrawn.
Input Parameters DisplayAlert - enable alerts, true on default; Pointer - arrow type (three types), 2 on default; Factor_distance - distance rate for arrows, 0.7 on default. Recommended timeframe - М15. Currency pai

Renko Star é um indicador do tipo seta mt4 projetado para negociar gráficos renko, este indicador possui um painel de backtesting que informa ao trader informações úteis, como taxa de vitória e pontos ganhos, também fornece tp e sl na multiplicação atr x, este indicador fornece seu sinal na barra aberta ou intrabarra e possui uma marca amarela que marcará o preço exato onde o sinal foi dado, a forma de utilizar este indicador é abrindo uma compra ou venda de acordo com a seta dada pelo indicado
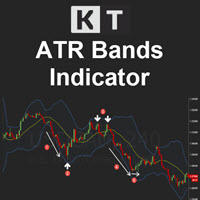
KT ATR Bands draws the volatility envelops and bands using a combination of Average True Range and Moving average. They are typically used to identify the potential reversal points and the periods of high and low volatility.
Features
Multi-Timeframe Ability: For example, you can have the atr bands from the daily timeframe on the H1 timeframe. Smart Alerts: You can turn on/off alerts for each band separately. Also, you can choose a minimum time interval between each alert to stop unnecessary,

An indicator based on candlestick patterns
To catch short-term and long-term trends
If it gives a signal in the direction of the trend, it is long term
And if it gives a signal in the opposite direction of the trend, it is short term
Too many signals
Can be used in all symbols
Can be used in all time frames
Attributes: Too many signals Can be used in all symbols Can be used in all time frames Simple settings Simple and fast usage With author lifetime support
Settings: Candle back: Th

Two Period RSI + Alerts compares long-term and short-term RSI lines, and plots a fill between them for improved visualization. Fill is colored differently according to an uptrend (short period RSI above long period RSI) or a downtrend (short period RSI below long period RSI). Short-term RSI crossing long-term RSI adds a more robust trend confirmation signal than using single period RSI alone. This is a tool to help visualize and confirm RSI trends. We hope you enjoy!
Alerts Email, message, and

This indicator provides tick volume delta analysis on M1 timeframe. It monitors up and down ticks and sums them up as separate volumes for buys and sells, as well as their delta volumes, and volume clusters on price scale within a specified number of bars. This indicator complements VolumeDelta , which uses similar algorithms but does not process ticks and therefore cannot work on M1. VolumeDelta can show its signals on entire history because it reads M1 volumes for calculations on higher timefr
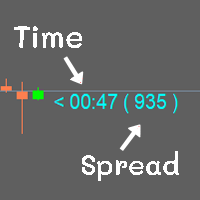
Show the time of candlesticks and spread. All data will be displayed in a rod. Can change color Can fix the size as needed
MT4 : Link https://www.mql5.com/en/market/product/102742 MT5 : Link https://www.mql5.com/en/market/product/102834
Most free code on various websites I didn't write it myself. I only do a little bit.
If you like it, please give 5 stars with it. Thank you.
FREE

Important!! ZO Trend MTF can't work on MN and W1 timeframe. /*--------------------------------------------------------------------------------------------------------------------------------------------------------------------------------------------- ZO TREND : https://www.mql5.com/en/market/product/49138 ZO Trend MTF an indicator used to search for entry point. With the session candle algorithm on many timeframe, ZO Trend creates an area for traders find good Entry Point. ZO SYSTEM BASIC SET

GT Trend é um indicador de tendência especialmente projetado para negociação em gráficos M1 e M5 . O indicador é ideal para traders que preferem negociações intradiárias. Você pode usar este indicador como base para o seu sistema de negociação ou como uma solução de negociação independente. O indicador é fácil de usar. Você só precisa seguir os sinais. Também fornecerei indicadores adicionais para todos os usuários deste indicador gratuitamente, o que ajudará a usar esse método da maneira mais e

CyberZingFx Volume Indicator is designed to help traders find market reversals with ease. This powerful tool uses a unique strategy that combines both volume and historical price to provide accurate signals for potential market reversals. The indicator displays volume BUY and SELL power values on the right side of the chart for both BUY and SELL. With customizable settings, you can set alerts at different levels to suit your trading style. The most recent alert value is displayed as Alert High,
FREE
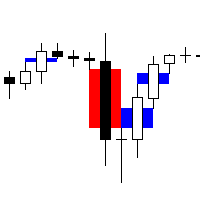
Fair Value Gap Scanner 4 is a sophisticated MetaTrader 5 indicator designed to detect fair value gaps (FVGs) in price action and display them as rectangles directly on the chart. This powerful tool empowers traders by providing visual representations of FVGs, enabling them to identify potential trading opportunities with ease and precision. With customizable parameters for color, width, and style, traders can tailor the indicator's appearance to suit their preferences and trading strategies. Key
FREE
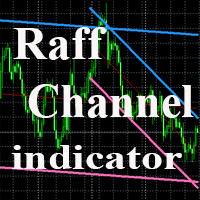
The indicator plots a trend channel using the technique by Gilbert Raff. The channel axis is a first-order regression. The upper and lower lines show the maximum distance the Close line had moved away from the axis line. Therefore, the upper and lower lines can be considered as resistance and support lines, respectively. A similar version of the indicator for the MT5 terminal
As a rule, most movements of the price occur within a channel, going beyond the support or resistance line only for a s
FREE

MACD divergence indicator finds divergences between price chart and MACD indicator and informs you with alerts (popup, mobile notification or email). Its main use is to find trend reversals in the chart. Always use the divergence indicators with other technical assets like support resistance zones, candlestick patterns and price action to have a higher possibility to find trend reversals. Three confirmation type for MACD divergences: MACD line cross zero level Price returns to previous H/L Creat
FREE

Este indicador multi-quadro de tempo e multi-símbolo alerta sobre mudanças de cor suavizadas de Heiken Ashi. Como um bônus, ele também pode verificar as mudanças de tendência (cor) da média móvel do casco. Combinado com suas próprias regras e técnicas, este indicador permitirá que você crie (ou aprimore) seu próprio sistema de negociação poderoso. Recursos
Pode monitorar todos os símbolos visíveis na janela Market Watch ao mesmo tempo. Aplique o indicador a apenas um gráfico e monitore instanta

** All Symbols x All Time frames scan just by pressing scanner button ** *** Contact me after the purchase to send you instructions and add you in "Harmonic Scanner group" for sharing or seeing experiences with other users. Introduction Harmonic Patterns are best used to predict turning point. Harmonic Patterns give you high win rate and high opportunities for trade in during one day. This indicator detects the best and successful patterns base on Harmonic Trading books . The Harmonic Patterns S

Apresentando o Indicador ON Trade Numerology Mirror: Revelando Padrões Ocultos de Reversão através da Numerologia Descubra uma nova dimensão na análise técnica com o Indicador ON Trade Numerology Mirror. Essa ferramenta inovadora utiliza a antiga sabedoria da numerologia para identificar níveis-chave de reversão de preços em seus gráficos. Ao reorganizar os números em posições espelhadas, esse indicador revela padrões ocultos que têm o potencial de sinalizar reversões significativas de preços, p

Apollo Pips é um indicador de reversão de tendência altamente preciso para negociar qualquer par de moedas. Ele foi originalmente desenvolvido para negociar XAUUSD, mas a prática mostrou que o indicador pode ser usado com sucesso em outros pares. Período de tempo recomendado H1. O indicador faz um alerta somente quando o sinal é confirmado. Portanto, se você viu um alerta, poderá usar com segurança o sinal recebido. O indicador NÃO REDESENHA seus sinais! A seta pode piscar até que o sinal seja r

Full Stochastic - is Stochastic Oscillator which displays all three essential lines: %K Slow K %D Standard Stochastic Oscillators displays only Slow K and %D.
Why it is important to analyze all three lines in SO? Standard SO users must choose if they want to use fast or slow SO. In case of fast SO traders set the slowing parameter typically to 1 or 2, or if they want to use slow SO, they set the slowing parameter usually to 3 or more. With Full Stochastic you can have both!
Full Stochastic P
FREE

O Apollo Price Action System é um indicador totalmente baseado no princípio Price Action. O indicador dá um sinal para comprar ou vender assim que as condições para entrar no mercado forem formadas de acordo com a estratégia do indicador. O indicador pode ser usado como um sistema de negociação básico ou como um complemento ao seu próprio sistema de negociação. Este indicador é muito fácil de usar. Solo tienes que seguir las señales. O indicador mostra linhas de tendência no gráfico, como pontos

Gold Pro MT4 is a trend indicator designed specifically for gold and can also be used on any symbol. The indicator does not redraw and does not lag.
Free Dashboard : monitor All pairs and timeframes here: https://www.mql5.com/en/market/product/60431 SETTINGS Factor 1: use to calculate different methods of drawing indicator line Factor 2: use to calculate different methods of drawing indicator line AlertByPopup - true/false popup alerts. AlertBySound - true/fals
The standard KDJ indicator is presented by KING.Ai. This indicator were built base on the the theory of KDJ . KDJ is a very effective and useful strategy to trade especially in swing trading. Method to apply (please also refer to the graphic): 80/20 rule: Price from bottom to top 20 to 80. And price from top to bottom 80 to 20. Both is enter market signal. Indicator period: The indicator is made by period 9,3,3 KING.Ai Forex trader believe that such strategy must complement with other indicato
FREE

O indicador identifica quando ocorre uma divergência entre o preço e um indicador ou oscilador. Identifica divergências ocultas ou regulares (clássicas) de alta e baixa. Combinado com suas próprias regras e técnicas, este indicador permitirá que você crie (ou aprimore) seu próprio sistema poderoso. Recursos
Pode detectar divergências para os seguintes indicadores / osciladores: MACD, OsMA (média móvel do oscilador), Stochastics, RSI, CCI, RVI, Awesome (AO), ADX, ATR, OBV, MFI, Momentum e
FREE

TDI Multi Timeframe Scanner: This Dashboard indicator uses the TDI (Trader's Dynamic Index) Indicator to find best trades. Extra indicators and detailed description is here: https://abiroid.com/product/tdi-scanner-dashboard
Checks for: - SharkFin Pattern Free indicator for SharkFin: https://www.mql5.com/en/market/product/42405/ - TDI Trend: Strong/Weak Trend Up/Down - TDI Signal: Strong/Medium/Weak Signal for Buy/Sell - Consolidation - Overbought/Oversold - Volatility Bands - Previous Day/Week

Dashboard uses Ichimoku Strategy to find best trades. Get extra Indicators/Template: And read more about detailed Product Description and usage here: https://www.mql5.com/en/blogs/post/747457
Please note: I won’t be able to add new settings. It already has 72 settings Some people are using it with their EAs. And iCustom function can only take Max 64 settings. So, I cannot let it grow any further.
I’ll definitely be maintaining the code and solving issues. Don’t worry Please check all

[ MT5 Version ] Backtesting Simulator Are you tired of spending months on demo or live accounts to test your trading strategies? The Backtesting Simulator is the ultimate tool designed to elevate your backtesting experience to new heights. Utilizing Metatrader historical symbol information, it offers an unparalleled simulation of real market conditions. Take control of your testing speed, test ideas quickly or at a slower pace, and witness remarkable improvements in your testing performance. For
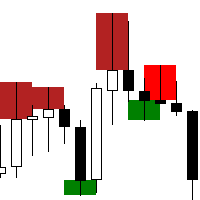
The "Rejection Block" MetaTrader 4 Indicator is a powerful tool designed to assist traders in identifying and visualizing rejection candlestick patterns, commonly referred to as rejection blocks. These patterns play a crucial role in market analysis as they often signify potential reversals or continuations in price movements. Key Features: Rejection Block Detection: The indicator meticulously scans price data to identify instances of rejection candlestick patterns. These patterns typically feat
FREE

This dynamic indicator will identify when Fast Moving Averages (EMA, SMA, or LW) cross Slow Moving Average lines on any timeframe and with any symbol.
When the moving averages cross and price close above or below the crossing, the User will receive an alert via pop-up, push, or email.
Choose any two Moving Averages to cross to receive an alert and the Indicator will also paint the Moving Average Lines and Arrows.
You can choose Exponential Moving Averages (EMA). Simple Moving Averages (SMA

Exclusive Bollinger is a professional indicator based on the popular Bollinger Bands indicator and provided with an advanced algorithm. Unlike the standard Bollinger , my Exclusive Bollinger provides better signals and is equipped with flexible settings allowing traders to adjust this indicator to their trading style. In the indicator, you can set up alerts (alert, email, push), so that you won't miss a single trading signal. Exclusive Bollinger for the MetaTrader 5 terminal : https://www.mql5

O indicador mostra sinais baseados no oscilador RSI terminal no gráfico. É possível filtrar sinais repetidos.
Aqui, o oscilador é usado para procurar um sinal reverso. É recomendado como um ponto de entrada em estratégias de swing e negociação a partir de níveis.
Um painel multi-moeda está disponível. Com ele, você pode alternar facilmente entre os gráficos. Nas discussões de produtos, você pode sugerir um algoritmo no qual pode incorporar um painel.
Parametro.
Configurações Principais.
FREE
O Mercado MetaTrader é a única loja onde você pode baixar um robô demonstração de negociação gratuitamente para testes e otimização usando dados históricos.
Leia a visão geral e opiniões de outros clientes sobre os aplicativos, faça o download para o seu terminal e teste um robô de negociação antes de comprá-lo. Apenas no Mercado MetaTrader você pode testar um aplicativo de forma absolutamente gratuita.
Você está perdendo oportunidades de negociação:
- Aplicativos de negociação gratuitos
- 8 000+ sinais para cópia
- Notícias econômicas para análise dos mercados financeiros
Registro
Login
Se você não tem uma conta, por favor registre-se
Para login e uso do site MQL5.com, você deve ativar o uso de cookies.
Ative esta opção no seu navegador, caso contrário você não poderá fazer login.