
Guia prático do MQL5: Desenvolvimento de um indicador de símbolos múltiplos no MQL5

Introdução
Neste artigo, vamos considerar o desenvolvimento de um indicador de volatilidade de símbolos múltiplos. O desenvolvimento de indicadores de símbolos múltiplos pode apresentar algumas dificuldades para os desenvolvedores novatos do MQL5, as quais este artigo ajuda a esclarecer. As principais questões que surgem no curso do desenvolvimento de um indicador de símbolos múltiplos têm a ver com sincronização de dados de outros símbolos em relação ao símbolo atual, a falta de alguns dados de indicadores e a identificação de início de barras 'reais' de um determinado período de tempo. Todas essas questões serão atentamente consideradas no artigo.
Obteremos valores do indicador de Taxa de média real (ATR) já calculada para cada símbolo baseado no identificador. Para fins ilustrativos, haverá seis símbolos cujos nomes podem ser definidos nos parâmetros externos do indicador. Os nomes inseridos serão verificados para estarem corretos. Se um determinado símbolo especificado nos parâmetros não estiver disponível na lista geral, nenhum cálculo será feito para ele. Todos os símbolos disponíveis serão adicionados à janela Market Watch, a menos que já estejam disponíveis lá.
No artigo anterior intitulado "Guia prático do MQL5: Controles da sub-janela indicadora - barra de rolagem" já falamos sobre a tela na qual você pode imprimir texto e até mesmo desenhar. Desta vez, não vamos desenhar na tela, mas vamos usá-la para exibir mensagens sobre os processos atuais do programa para que o usuário saiba o que está acontecendo em um determinado espaço do tempo.
Desenvolvimento do Indicador
Vamos iniciar o desenvolvimento do programa. Usando o Assistente do MQL5, crie um modelo de identificador personalizado. Após algumas modificações, você deve obter o código-fonte, como mostrado abaixo:
//+------------------------------------------------------------------+
//|                                               MultiSymbolATR.mq5 |
//|                        Copyright 2010, MetaQuotes Software Corp. |
//|                                              http://www.mql5.com |
//+------------------------------------------------------------------+
//--- Indicator properties
#property copyright "Copyright 2010, MetaQuotes Software Corp."
#property link      "http://www.mql5.com"
#property version   "1.00"
#property indicator_separate_window // Indicator is in a separate subwindow
#property indicator_minimum 0       // Minimum value of the indicator
#property indicator_buffers 6       // Number of buffers for indicator calculation
#property indicator_plots   6       // Number of plotting series
//+------------------------------------------------------------------+
//| Custom indicator initialization function                         |
//+------------------------------------------------------------------+
int OnInit()
  {
//--- Initialization completed successfully
   return(INIT_SUCCEEDED);
  }
//+------------------------------------------------------------------+
//| Deinitialization                                                 |
//+------------------------------------------------------------------+
void OnDeinit(const int reason)
  {
  }
//+------------------------------------------------------------------+
//| Custom indicator iteration function                              |
//+------------------------------------------------------------------+
int OnCalculate(const int      rates_total,     // Size of input time series
                const int      prev_calculated, // Bars processed at the previous call
                const datetime &time[],         // Opening time
                const double   &open[],         // Open prices
                const double   &high[],         // High prices
                const double   &low[],          // Low prices
                const double   &close[],        // Close prices
                const long     &tick_volume[],  // Tick volumes
                const long     &volume[],       // Real volumes
                const int      &spread[])       // Spread
  {
//--- Return the size of the data array of the current symbol
   return(rates_total);
  }
//+------------------------------------------------------------------+
//| Timer function                                                   |
//+------------------------------------------------------------------+
void OnTimer()
  {
  }
//+------------------------------------------------------------------+
Para implementar a nossa ideia, vamos encher ainda mais este modelo com o que for necessário. A necessidade de um temporizador será explicada mais tarde no artigo. Vamos adicionar as constantes no início, logo após as propriedades específicas do indicador:
//--- Constants
#define RESET           0 // Returning the indicator recalculation command to the terminal
#define LEVELS_COUNT    6 // Number of levels
#define SYMBOLS_COUNT   6 // Number of symbols
A constante LEVELS_COUNT contém o valor do número de níveis representados por objetos gráficos do tipo "linha horizontal" (OBJ_HLINE). Os valores desses níveis podem ser especificados nos parâmetros externos do indicador.
Vamos incluir no projeto um arquivo com a classe para trabalhar com os gráficos personalizados:
//--- Include the class for working with the canvas
#include <Canvas\Canvas.mqh>
Nos parâmetros externos, especificaremos o período de nivelamento pela média iATR, nomes dos símbolos cuja volatilidade deve ser exibida e os valores de nível horizontal. Os símbolos são numerados começando a partir de 2, pois o primeiro símbolo é considerado ser aquele cujo o gráfico, o indicador está anexado.
//--- External parameters
input  int              IndicatorPeriod=14;       // Averaging period
sinput string dlm01=""; //- - - - - - - - - - - - - - - - - - - - - - - - - - -
input  string           Symbol02       ="GBPUSD"; // Symbol 2
input  string           Symbol03       ="AUDUSD"; // Symbol 3
input  string           Symbol04       ="NZDUSD"; // Symbol 4
input  string           Symbol05       ="USDCAD"; // Symbol 5
input  string           Symbol06       ="USDCHF"; // Symbol 6
sinput string dlm02=""; //- - - - - - - - - - - - - - - - - - - - - - - - - - -
input  int              Level01        =10;       // Level 1
input  int              Level02        =50;       // Level 2
input  int              Level03        =100;      // Level 3
input  int              Level04        =200;      // Level 4
input  int              Level05        =400;      // Level 5
input  int              Level06        =600;      // Level 6
Mais adiante no código devemos criar todas as variáveis e matrizes globais para trabalharmos mais tarde. Todas elas são fornecidas no código abaixo, com comentários detalhados:
//--- Global variables and arrays
CCanvas           canvas;                 // Loading the class
//--- Variables/arrays for copying data from OnCalculate()
int               OC_rates_total     =0;  // Size of input time series
int               OC_prev_calculated =0;  // Bars processed at the previous call
datetime          OC_time[];              // Opening time
double            OC_open[];              // Open prices
double            OC_high[];              // High prices
double            OC_low[];               // Low prices
double            OC_close[];             // Close prices
long              OC_tick_volume[];       // Tick volumes
long              OC_volume[];            // Real volumes
int               OC_spread[];            // Spread
//--- Structure of buffers for drawing indicator values
struct buffers {double data[];};
buffers           atr_buffers[SYMBOLS_COUNT];
//--- Structure of time arrays for data preparation
struct temp_time {datetime time[];};
temp_time         tmp_symbol_time[SYMBOLS_COUNT];
//--- Structure of arrays of the ATR indicator values for data preparation
struct temp_atr {double value[];};
temp_atr          tmp_atr_values[SYMBOLS_COUNT];
//--- For the purpose of storing and checking the time of the first bar in the terminal
datetime          series_first_date[SYMBOLS_COUNT];
datetime          series_first_date_last[SYMBOLS_COUNT];
//--- Time of the bar from which we will start drawing
datetime          limit_time[SYMBOLS_COUNT];
//--- Indicator levels
int               indicator_levels[LEVELS_COUNT];
//--- Symbol names
string            symbol_names[SYMBOLS_COUNT];
//--- Symbol handles
int               symbol_handles[SYMBOLS_COUNT];
//--- Colors of indicator lines
color             line_colors[SYMBOLS_COUNT]={clrRed,clrDodgerBlue,clrLimeGreen,clrGold,clrAqua,clrMagenta};
//--- String representing the lack of the symbol
string            empty_symbol="EMPTY";
//--- Indicator subwindow properties
int               subwindow_number        =WRONG_VALUE;              // Subwindow number
int               chart_width             =0;                        // Chart width
int               subwindow_height        =0;                        // Subwindow height
int               last_chart_width        =0;                        // Last saved chart width
int               last_subwindow_height   =0;                        // Last saved subwindow height
int               subwindow_center_x      =0;                        // Horizontal center of the subwindow
int               subwindow_center_y      =0;                        // Vertical center of the subwindow
string            subwindow_shortname     ="MS_ATR";                 // Short name of the indicator
string            prefix                  =subwindow_shortname+"_";  // Prefix for objects
//--- Canvas properties
string            canvas_name             =prefix+"canvas";          // Canvas name
color             canvas_background       =clrBlack;                 // Canvas background color
uchar             canvas_opacity          =190;                      // Opacity
int               font_size               =16;                       // Font size
string            font_name               ="Calibri";                // Font
ENUM_COLOR_FORMAT clr_format              =COLOR_FORMAT_ARGB_RAW;    // Color components should be correctly set by the user
//--- Canvas messages
string            msg_invalid_handle      ="Invalid indicator handle! Please wait...";
string            msg_prepare_data        ="Preparing data! Please wait...";
string            msg_not_synchronized    ="Unsynchronized data! Please wait...";
string            msg_load_data           ="";
string            msg_sync_update         ="";
string            msg_last                ="";
//--- Maximum number of bars specified in the terminal settings
int               terminal_max_bars=0;
Ao carregar o indicador ao gráfico, a função OnInit() realizará as seguintes ações:
- definir as propriedades do indicador;
- determinar matrizes para desenhar plotagem em série;
- inicializar matrizes;
- adicionar símbolos especificados nos parâmetros externos à janela Market Watch;
- verificar a exatidão de parâmetros e fazer a primeira tentativa em obter identificadores de indicadores.
Todas essas ações serão tratadas de uma forma mais conveniente, se dispostas em funções distintas. Como resultado, o código-fonte da função OnInit() se tornará muito fácil de se entender, como mostrado abaixo:
//+------------------------------------------------------------------+
//| Custom indicator initialization function                         |
//+------------------------------------------------------------------+
int OnInit()
  {
//--- Check input parameters for correctness
   if(!CheckInputParameters())
      return(INIT_PARAMETERS_INCORRECT);
//--- Set the timer at 1-second intervals
   EventSetTimer(1);
//--- Set the font to be displayed on the canvas
   canvas.FontSet(font_name,font_size,FW_NORMAL);
//--- Initialization of arrays
   InitArrays();
//--- Initialize the array of symbols
   InitSymbolNames();
//--- Initialize the array of levels
   InitLevels();
//--- Get indicator handles
   GetIndicatorHandles();
//--- Set indicator properties
   SetIndicatorProperties();
//--- Get the number of bars specified in the terminal settings
   terminal_max_bars=TerminalInfoInteger(TERMINAL_MAXBARS);
//--- Clear the comment
   Comment("");
//--- Refresh the chart
   ChartRedraw();
//--- Initialization completed successfully
   return(INIT_SUCCEEDED);
  }
Vamos dar uma olhada nas funções personalizadas usadas no código acima. Na função CheckInputParameters() vamos verificar os parâmetros externos para exatidão. No nosso caso, temos apenas que verificar um parâmetro - período indicador ATR. Ajustei o valor de restrição de 500. Ou seja, se você definir o valor do período superior ao valor especificado, o indicador terminará sua operação, e imprimirá a mensagem sobre o motivo do término do programa ao registro e ao comentário do gráfico. O código de função CheckInputParameters() é fornecido abaixo.
//+------------------------------------------------------------------+
//| Checking input parameters for correctness                        |
//+------------------------------------------------------------------+
bool CheckInputParameters()
  {
   if(IndicatorPeriod>500)
     {
      Comment("Decrease the indicator period! Indicator Period: ",IndicatorPeriod,"; Limit: 500;");
      printf("Decrease the indicator period! Indicator Period: %d; Limit: %d;",IndicatorPeriod,500);
      return(false);
     }
//---
   return(true);
  }
Em seguida, passamos para três funções de inicialização de matriz: InitArrays(), InitSymbolNames() e InitLevels(). Seus respectivos códigos-fonte são fornecidos abaixo:
//+------------------------------------------------------------------+
//| First initialization of arrays                                   |
//+------------------------------------------------------------------+
void InitArrays()
  {
   ArrayInitialize(limit_time,NULL);
   ArrayInitialize(series_first_date,NULL);
   ArrayInitialize(series_first_date_last,NULL);
   ArrayInitialize(symbol_handles,INVALID_HANDLE);
//---
   for(int s=0; s<SYMBOLS_COUNT; s++)
      ArrayInitialize(atr_buffers[s].data,EMPTY_VALUE);
  }
//+------------------------------------------------------------------+
//| Initializing array of symbols                                    |
//+------------------------------------------------------------------+
void InitSymbolNames()
  {
   symbol_names[0]=AddSymbolToMarketWatch(_Symbol);
   symbol_names[1]=AddSymbolToMarketWatch(Symbol02);
   symbol_names[2]=AddSymbolToMarketWatch(Symbol03);
   symbol_names[3]=AddSymbolToMarketWatch(Symbol04);
   symbol_names[4]=AddSymbolToMarketWatch(Symbol05);
   symbol_names[5]=AddSymbolToMarketWatch(Symbol06);
  }
//+------------------------------------------------------------------+
//| Initializing array of levels                                     |
//+------------------------------------------------------------------+
void InitLevels()
  {
   indicator_levels[0]=Level01;
   indicator_levels[1]=Level02;
   indicator_levels[2]=Level03;
   indicator_levels[3]=Level04;
   indicator_levels[4]=Level05;
   indicator_levels[5]=Level06;
  }
Na função InitSymbolNames(), usamos uma outra função personalizada - AddSymbolToMarketWatch(). Ela recebe o nome símbolo e se este símbolo estiver disponível na lista geral será adicionado à janela Market Watch e a função retornará à sequência com o nome símbolo. Se este símbolo não estiver disponível, a função retornará à sequência "EMPTY" (vazia) e nenhuma ação será realizada para este elemento na matriz de símbolos ao executar as verificações em outras funções.
//+------------------------------------------------------------------+
//| Adding the specified symbol to the Market Watch window           |
//+------------------------------------------------------------------+
string AddSymbolToMarketWatch(string symbol)
  {
   int      total=0; // Number of symbols
   string   name=""; // Symbol name
//--- If an empty string is passed, return the empty string
   if(symbol=="")
      return(empty_symbol);
//--- Total symbols on the server
   total=SymbolsTotal(false);
//--- Iterate over the entire list of symbols
   for(int i=0;i<total;i++)
     {
      //--- Symbol name on the server
      name=SymbolName(i,false);
      //--- If this symbol is available,
      if(name==symbol)
        {
         //--- add it to the Market Watch window and
         SymbolSelect(name,true);
         //--- return its name
         return(name);
        }
     }
//--- If this symbol is not available, return the string representing the lack of the symbol
   return(empty_symbol);
  }
GetIndicatorHandles() é uma outra função chamada na inicialização do indicador. Ela tenta obter os identificadores de indicador ATR para cada símbolo especificado. Se o identificador não foi obtido por algum símbolo, a função retornará falsa, mas isto não será processado de qualquer forma em OnInit(), pois, a disponibilidade do identificador será verificada em outras partes do programa.
//+------------------------------------------------------------------+
//| Getting indicator handles                                        |
//+------------------------------------------------------------------+
bool GetIndicatorHandles()
  {
//--- An indication of all handles being valid
   bool valid_handles=true;
//--- Iterate over all symbols in a loop and ...
   for(int s=0; s<SYMBOLS_COUNT; s++)
     {
      //--- If the symbol is available
      if(symbol_names[s]!=empty_symbol)
        {
         // And if the handle of the current symbol is invalid
         if(symbol_handles[s]==INVALID_HANDLE)
           {
            //--- Get it
            symbol_handles[s]=iATR(symbol_names[s],Period(),IndicatorPeriod);
            //--- If the handle could not be obtained, try again next time
            if(symbol_handles[s]==INVALID_HANDLE)
               valid_handles=false;
           }
        }
     }
//--- Print the relevant message if the handle for one of the symbols could not be obtained
   if(!valid_handles)
     {
      msg_last=msg_invalid_handle;
      ShowCanvasMessage(msg_invalid_handle);
     }
//---
   return(valid_handles);
  }
A função ShowCanvasMessage() será revista um pouco mais tarde em conjunto com outras funções para trabalhar com a tela.
As propriedades do indicador são definidas na função SetIndicatorProperties(). Visto que as propriedades de cada série de plotagem são semelhantes, é mais conveniente definí-las usando ciclos:
//+------------------------------------------------------------------+
//| Setting indicator properties                                     |
//+------------------------------------------------------------------+
void SetIndicatorProperties()
  {
//--- Set the short name
   IndicatorSetString(INDICATOR_SHORTNAME,subwindow_shortname);
//--- Set the number of decimal places
   IndicatorSetInteger(INDICATOR_DIGITS,_Digits);
//--- Define buffers for drawing
   for(int s=0; s<SYMBOLS_COUNT; s++)
      SetIndexBuffer(s,atr_buffers[s].data,INDICATOR_DATA);
//--- Set labels for the current symbol
   for(int s=0; s<SYMBOLS_COUNT; s++)
      PlotIndexSetString(s,PLOT_LABEL,"ATR ("+IntegerToString(s)+", "+symbol_names[s]+")");
//--- Set the plotting type: lines
   for(int s=0; s<SYMBOLS_COUNT; s++)
      PlotIndexSetInteger(s,PLOT_DRAW_TYPE,DRAW_LINE);
//--- Set the line width
   for(int s=0; s<SYMBOLS_COUNT; s++)
      PlotIndexSetInteger(s,PLOT_LINE_WIDTH,1);
//--- Set the line color
   for(int s=0; s<SYMBOLS_COUNT; s++)
      PlotIndexSetInteger(s,PLOT_LINE_COLOR,line_colors[s]);
//--- Empty value for plotting where nothing will be drawn
   for(int s=0; s<SYMBOLS_COUNT; s++)
      PlotIndexSetDouble(s,PLOT_EMPTY_VALUE,EMPTY_VALUE);
  }
Após a inicialização bem sucedida do programa, é preciso fazer a primeira chamada da função OnCalculate(). O valor da variável prev_calculated é zero na primeira chamada da função. Ela também é zerada pelo terminal quando um histórico mais profundo for carregado ou as lacunas no histórico forem preenchidas. Em tais casos, os buffers indicadores são completamente recalculados. Se este valor de parâmetro for diferente de zero, por exemplo, o resultado devolvido previamente pela mesma função, a qual é o tamanho da série de tempo de entrada, ele é suficiente apenas para atualizar os últimos valores dos buffers.
Nem sempre você consegue fazer todos os cálculos corretamente na primeira tentativa. Neste caso, a fim de retornar, utilizaremos a constante RESET que contém o valor de zero. Na próxima chamada de OnCalculate() (por exemplo, no próximo tick), o parâmetro prev_calculated conterá o valor zero, o que significa que precisaremos fazer mais uma tentativa de fazer todos os cálculos necessários antes de exibir a série de plotagem do indicador no gráfico.
Mas o gráfico permanecerá vazio quando o mercado estiver fechado e não houver nenhum novo tick ou após cálculos mal sucedidos. Neste caso, você pode tentar uma forma simples de dar um comando para fazer uma outra tentativa - alterar manualmente o prazo de tempo no gráfico. Mas usaremos uma abordagem diferente. É por isso que no início adicionamos o temporizador, a função OnTimer(), ao nosso modelo de programa e definimos o intervalo de tempo de 1 segundo na função OnInit().
A cada segundo o temporizador verificará se a função OnCalculate() tornou-se zero. Para isso, escreveremos uma função CopyDataOnCalculate() que copiará todos os parâmetros de OnCalculate() às variáveis globais com nomes e matrizes correspondentes com o prefixo OC_.
//+------------------------------------------------------------------+
//| Copying data from OnCalculate                                    |
//+------------------------------------------------------------------+
void CopyDataOnCalculate(const int      rates_total,
                         const int      prev_calculated,
                         const datetime &time[],
                         const double   &open[],
                         const double   &high[],
                         const double   &low[],
                         const double   &close[],
                         const long     &tick_volume[],
                         const long     &volume[],
                         const int      &spread[])
  {
   OC_rates_total=rates_total;
   OC_prev_calculated=prev_calculated;
   ArrayCopy(OC_time,time);
   ArrayCopy(OC_open,open);
   ArrayCopy(OC_high,high);
   ArrayCopy(OC_low,low);
   ArrayCopy(OC_close,close);
   ArrayCopy(OC_tick_volume,tick_volume);
   ArrayCopy(OC_volume,volume);
   ArrayCopy(OC_spread,spread);
  }
Esta função deve ser chamada no início do corpo da função OnCalculate(). Além disso, no início, também devemos acrescentar uma outra função personalizada, ResizeCalculatedArrays(),que definirá o tamanho às matrizes para a preparação dos dados antes de colocá-las em buffers indicadores. O tamanho destas matrizes deve ser igual ao tamanho da série de tempo de entrada.
//+------------------------------------------------------------------+
//| Resizing the size of arrays to the size of the main array        |
//+------------------------------------------------------------------+
void ResizeCalculatedArrays()
  {
   for(int s=0; s<SYMBOLS_COUNT; s++)
     {
      ArrayResize(tmp_symbol_time[s].time,OC_rates_total);
      ArrayResize(tmp_atr_values[s].value,OC_rates_total);
     }
  }
Além disso, vamos criar uma função ZeroCalculatedArrays() que inicializa matrizes para a preparação de dados a zero antes de enviá-los ao gráfico.
//+------------------------------------------------------------------+
//| Zeroing out arrays for data preparation                          |
//+------------------------------------------------------------------+
void ZeroCalculatedArrays()
  {
   for(int s=0; s<SYMBOLS_COUNT; s++)
     {
      ArrayInitialize(tmp_symbol_time[s].time,NULL);
      ArrayInitialize(tmp_atr_values[s].value,EMPTY_VALUE);
     }
  }
Será necessária a mesma função para preliminarmente zerar os buffers indicadores. Vamos chamá-la de ZeroIndicatorBuffers().
//+------------------------------------------------------------------+
//| Zeroing out indicator buffers                                    |
//+------------------------------------------------------------------+
void ZeroIndicatorBuffers()
  {
   for(int s=0; s<SYMBOLS_COUNT; s++)
      ArrayInitialize(atr_buffers[s].data,EMPTY_VALUE);
  }
O código atual da função OnCalculate() será como mostrado abaixo. Eu também forneci comentários para as principais operações a serem preenchidas mais tarde (comentários e pontos ocultos).
//+------------------------------------------------------------------+
//| Custom indicator iteration function                              |
//+------------------------------------------------------------------+
int OnCalculate(const int      rates_total,     // Size of input time series
                const int      prev_calculated, // Bars processed at the previous call
                const datetime &time[],         // Opening time
                const double   &open[],         // Open prices
                const double   &high[],         // High prices
                const double   &low[],          // Low prices
                const double   &close[],        // Close prices
                const long     &tick_volume[],  // Tick volumes
                const long     &volume[],       // Real volumes
                const int      &spread[])       // Spread
  {
//--- For the purpose of determining the bar from which the calculation shall be made
   int limit=0;
//--- Make a copy of the OnCalculate() parameters
   CopyDataOnCalculate(rates_total,prev_calculated,
                       time,open,high,low,close,
                       tick_volume,volume,spread);
//--- Set the size to arrays for data preparation
   ResizeCalculatedArrays();
//--- If this is the first calculation or if a deeper history has been loaded or gaps in the history have been filled
   if(prev_calculated==0)
     {
      //--- Zero out arrays for data preparation
      ZeroCalculatedArrays();
      //--- Zero out indicator buffers
      ZeroIndicatorBuffers();
      //--- Other checks
      // ...
      //--- If you reached this point, it means that OnCalculate() will return non-zero value and this needs to be saved
      OC_prev_calculated=rates_total;
     }
//--- If only the last values need to be recalculated
   else
      limit=prev_calculated-1;

//--- Prepare data for drawing
// ...
//--- Fill arrays with data for drawing
// ...

//--- Return the size of the data array of the current symbol
   return(rates_total);
  }
Atualmente, o código de função OnTimer() é como se segue:
//+------------------------------------------------------------------+
//| Timer function                                                   |
//+------------------------------------------------------------------+
void OnTimer()
  {
//--- If for some reason calculations have not been completed or
//    a deeper history has been loaded or
//    gaps in the history have been filled,
//    then make another attempt without waiting for the new tick
   if(OC_prev_calculated==0)
     {
      OnCalculate(OC_rates_total,OC_prev_calculated,
                  OC_time,OC_open,OC_high,OC_low,OC_close,
                  OC_tick_volume,OC_volume,OC_spread);
     }
  }
Agora, vamos considerar outras funções que serão utilizadas quando a variável prev_calculated for igual a zero. Estas funções irão:
- carregar e gerar a quantidade necessária de dados (barras);
- verificar a disponibilidade de todos os identificadores;
- verificar a presteza da quantidade necessária de dados;
- sincronizar os dados com o servidor;
- determinar barras a partir do qual a série de plotagem representada.
Além disso, identificaremos a primeira barra 'real' para cada símbolo. Este termo conciso foi criado para torná-lo mais conveniente mais tarde. Aqui está o que ela significa. Todos os prazos de tempo no MetaTrader 5 são construídos a partir de dados em minuto. Mas se, por exemplo, os dados diários no servidor estiverem disponíveis a partir de 1993, considerando que os dados em minuto só estão disponíveis a partir de 2000, então, se selecionarmos, por exemplo, o prazo de tempo horário do gráfico, as barras serão construídas a partir da data em que os dados em minuto tornarem-se disponíveis, por exemplo, a partir do ano de 2000. Tudo anterior a 2000 ou será representado por dados diários ou pelos dados mais próximos ao período de tempo atual. Portanto, para evitar confusão, você não deve exibir dados de indicadores para dados que não estejam relacionados com o período de tempo atual. Esta é a razão pela qual nós vamos identificar a primeira barra 'real' do prazo de tempo atual e marcá-la com uma linha vertical da mesma cor que o buffer indicador do símbolo.
A identificação das barras "reais" também é importante no desenvolvimento de Expert Advisors porque se os parâmetros são otimizados para um determinado período de tempo, os dados de outros períodos de tempo seriam, nesse caso, inadequados.
Antes de executar as verificações acima, vamos adicionar a tela à sub-janela indicadora. Então, primeiro devemos escrever todas as funções que precisamos para gerenciar a tela. Antes de adicionar a tela à sub-janela, precisamos determinar o seu tamanho, bem como as coordenadas com base nas quais as mensagens de texto serão exibidas na tela. Para isso, vamos escrever uma função GetSubwindowGeometry():
//+------------------------------------------------------------------+
//| Getting geometry of the indicator subwindow                      |
//+------------------------------------------------------------------+
void GetSubwindowGeometry()
  {
//--- Get the indicator subwindow number
   subwindow_number=ChartWindowFind(0,subwindow_shortname);
//--- Get the subwindow width and height
   chart_width=(int)ChartGetInteger(0,CHART_WIDTH_IN_PIXELS);
   subwindow_height=(int)ChartGetInteger(0,CHART_HEIGHT_IN_PIXELS,subwindow_number);
//--- Calculate the center of the subwindow
   subwindow_center_x=chart_width/2;
   subwindow_center_y=subwindow_height/2;
  }
Quando as propriedades da sub-janela forem obtidas, você pode adicionar a tela. O seu fundo será 100% transparente (opacidade igual a 0), somente se tornando visível ao carregar e gerar dados para que o usuário saiba o que está acontecendo atualmente. Quando visível, a opacidade de fundo será igual a 190. Você pode definir o valor de opacidade em qualquer valor entre 0 e 255. Para mais informações, por favor, consultar a descrição da função ColorToARGB() disponível abaixo de Help (Ajuda).
Para utilizar a tela, vamos escrever uma função SetCanvas().
//+------------------------------------------------------------------+
//| Setting canvas                                                   |
//+------------------------------------------------------------------+
void SetCanvas()
  {
//--- If there is no canvas, set it
   if(ObjectFind(0,canvas_name)<0)
     {
      //--- Create the canvas
      canvas.CreateBitmapLabel(0,subwindow_number,canvas_name,0,0,chart_width,subwindow_height,clr_format);
      //--- Make the canvas completely transparent
      canvas.Erase(ColorToARGB(canvas_background,0));
      //--- Redraw the canvas
      canvas.Update();
     }
  }
Precisaremos também de uma função que verifica se a sub-janela indicadora foi redimensionada. Se for o caso, o tamanho da tela será ajustado automaticamente para o novo tamanho da sub-janela. Vamos chamar essa função OnSubwindowChange():
//+------------------------------------------------------------------+
//| Checking the subwindow size                                      |
//+------------------------------------------------------------------+
void OnSubwindowChange()
  {
//--- Get subwindow properties
   GetSubwindowGeometry();
//--- If the subwindow size has not changed, exit
   if(!SubwindowSizeChanged())
      return;
//--- If the subwindow height is less than one pixel or if the center has been calculated incorrectly, exit
   if(subwindow_height<1 || subwindow_center_y<1)
      return;
//--- Set the new canvas size
   ResizeCanvas();
//--- Show the last message
   ShowCanvasMessage(msg_last);
  }
As funções destacadas no código acima podem ser exploradas abaixo. Por favor, observe os tipos de verificações que são executadas antes de redimensionar a sub-janela. Se qualquer propriedade acaba por ser incorreta, a função para a sua operação.
O código da função SubwindowSizeChanged() é como se segue:
//+------------------------------------------------------------------+
//| Checking if the subwindow has been resized                       |
//+------------------------------------------------------------------+
bool SubwindowSizeChanged()
  {
//--- If the subwindow size has not changed, exit
   if(last_chart_width==chart_width && last_subwindow_height==subwindow_height)
      return(false);
//--- If the size has changed, save it
   else
     {
      last_chart_width=chart_width;
      last_subwindow_height=subwindow_height;
     }
//---
   return(true);
  }
O código de função ResizeCanvas() é como se segue:
//+------------------------------------------------------------------+
//| Resizing canvas                                                  |
//+------------------------------------------------------------------+
void ResizeCanvas()
  {
//--- If the canvas has already been added to the indicator subwindow, set the new size
   if(ObjectFind(0,canvas_name)==subwindow_number)
      canvas.Resize(chart_width,subwindow_height);
  }
E, finalmente, abaixo está o código de função ShowCanvasMessage() que também usamos antes ao obtermos identificadores indicadores:
//+------------------------------------------------------------------+
//| Displaying message on the canvas                                 |
//+------------------------------------------------------------------+
void ShowCanvasMessage(string message_text)
  {
   GetSubwindowGeometry();
//--- If the canvas has already been added to the indicator subwindow
   if(ObjectFind(0,canvas_name)==subwindow_number)
     {
      //--- If the string passed is not empty and correct coordinates have been obtained, display the message
      if(message_text!="" && subwindow_center_x>0 && subwindow_center_y>0)
        {
         canvas.Erase(ColorToARGB(canvas_background,canvas_opacity));
         canvas.TextOut(subwindow_center_x,subwindow_center_y,message_text,ColorToARGB(clrRed),TA_CENTER|TA_VCENTER);
         canvas.Update();
        }
     }
  }
A tela será apagada com efeito de desaparecer. Para implementá-lo, pouco antes de apagar a tela, precisamos mudar gradualmente a opacidade do valor atual de zero em um ciclo, atualizando a tela a cada iteração.
O código de função DeleteCanvas() é como se segue:
//+------------------------------------------------------------------+
//| Deleting canvas                                                  |
//+------------------------------------------------------------------+
void DeleteCanvas()
  {
//--- Delete the canvas if it exists
   if(ObjectFind(0,canvas_name)>0)
     {
      //--- Before deleting, implement the disappearing effect
      for(int i=canvas_opacity; i>0; i-=5)
        {
         canvas.Erase(ColorToARGB(canvas_background,(uchar)i));
         canvas.Update();
        }
      //--- Delete the graphical resource
      canvas.Destroy();
     }
  }
Em seguida, vamos dar uma olhada nas funções necessárias para a verificação da propensão dos dados antes de colocá-los em buffers indicadores e de exibir no gráfico. Vamos começar com a função LoadAndFormData(): Vamos utilizá-lo para comparar o tamanho da matriz do símbolo atual com os dados disponíveis para outros símbolos. Se necessário, os dados são carregados do servidor. O código da função é fornecido com comentários detalhados para sua consideração.
//+------------------------------------------------------------------+
//| Loading and generating the necessary/available amount of data    |
//+------------------------------------------------------------------+
void LoadAndFormData()
  {
   int bars_count=100; // Number of loaded bars
//---
   for(int s=0; s<SYMBOLS_COUNT; s++)
     {
      int      attempts          =0;    // Counter of data copying attempts
      int      array_size        =0;    // Array size
      datetime firstdate_server  =NULL; // Time of the first bar on the server
      datetime firstdate_terminal=NULL; // Time of the first bar in the terminal base
      //--- Get the first date by the symbol/time frame in the terminal base
      SeriesInfoInteger(symbol_names[s],Period(),SERIES_FIRSTDATE,firstdate_terminal);
      //--- Get the first date of the symbol/time frame on the server
      SeriesInfoInteger(symbol_names[s],Period(),SERIES_SERVER_FIRSTDATE,firstdate_server);
      //--- Print the message
      msg_last=msg_load_data="Loading and generating data: "+
               symbol_names[s]+"("+(string)(s+1)+"/"+(string)SYMBOLS_COUNT+") ... ";
      ShowCanvasMessage(msg_load_data);
      //--- Load/generate data.
      //    If the array size is smaller than the maximum number of bars in the terminal, and if
      //    the number of bars between the first date of the series in the terminal and the first date of the series on the server is more than specified
      while(array_size<OC_rates_total &&
            firstdate_terminal-firstdate_server>PeriodSeconds()*bars_count)
        {
         datetime copied_time[];
         //--- Get the first date by the symbol/time frame in the terminal base
         SeriesInfoInteger(symbol_names[s],Period(),SERIES_FIRSTDATE,firstdate_terminal);
         //--- Load/copy the specified number of bars
         if(CopyTime(symbol_names[s],Period(),0,array_size+bars_count,copied_time)!=-1)
           {
            //--- If the time of the first bar in the array, excluding the number of the bars being loaded, is earlier
            //    than the time of the first bar in the chart, terminate the loop
            if(copied_time[0]-PeriodSeconds()*bars_count<OC_time[0])
               break;
            //--- If the array size hasn't increased, increase the counter
            if(ArraySize(copied_time)==array_size)
               attempts++;
            //--- Otherwise get the current size of the array
            else
               array_size=ArraySize(copied_time);
            //--- If the array size hasn't increased over 100 attempts, terminate the loop
            if(attempts==100)
              {
               attempts=0;
               break;
              }
           }
         //--- Check the subwindow size once every 2000 bars
         //    and if the size has changed, adjust the canvas size to it
         if(!(array_size%2000))
            OnSubwindowChange();
        }
     }
  }
Após a tentativa de carregar a quantidade necessária de dados, verificamos mais uma vez os identificadores indicadores. Para isso, usamos utilizamos a função GetIndicatorHandles() considerada acima.
Uma vez que os cabos tenham sido verificados, o programa verifica a disponibilidade de dados e valores de indicador dos símbolos específicos para cada símbolo usando a função CheckAvailableData(). Abaixo, você pode dar uma olhada mais de perto em como isso é feito:
//+------------------------------------------------------------------+
//| Checking the amount of available data for all symbols            |
//+------------------------------------------------------------------+
bool CheckAvailableData()
  {
   for(int s=0; s<SYMBOLS_COUNT; s++)
     {
      //--- If this symbol is available
      if(symbol_names[s]!=empty_symbol)
        {
         double   data[]; // Array for checking the amount of indicator data
         datetime time[]; // Array for checking the number of bars
         int      calculated_values =0;    // Amount of indicator data
         int      available_bars    =0;    // Number of bars of the current period
         datetime firstdate_terminal=NULL; // First date of the current time frame data available in the terminal
         //--- Get the number of calculated values of the indicator
         calculated_values=BarsCalculated(symbol_handles[s]);
         //--- Get the first date of the current time frame data in the terminal
         firstdate_terminal=(datetime)SeriesInfoInteger(symbol_names[s],Period(),SERIES_TERMINAL_FIRSTDATE);
         //--- Get the number of available bars from the date specified
         available_bars=Bars(symbol_names[s],Period(),firstdate_terminal,TimeCurrent());
         //--- Check the readiness of bar data: 5 attempts to get values
         for(int i=0; i<5; i++)
           {
            //--- Copy the specified amount of data
            if(CopyTime(symbol_names[s],Period(),0,available_bars,time)!=-1)
              {
               //--- If the required amount has been copied, terminate the loop
               if(ArraySize(time)>=available_bars)
                  break;
              }
           }
         //--- Check the readiness of indicator data: 5 attempts to get values
         for(int i=0; i<5; i++)
           {
            //--- Copy the specified amount of data
            if(CopyBuffer(symbol_handles[s],0,0,calculated_values,data)!=-1)
              {
               //--- If the required amount has been copied, terminate the loop
               if(ArraySize(data)>=calculated_values)
                  break;
              }
           }
         //--- If the amount of data copied is not sufficient, one more attempt is required
         if(ArraySize(time)<available_bars || ArraySize(data)<calculated_values)
           {
            msg_last=msg_prepare_data;
            ShowCanvasMessage(msg_prepare_data);
            OC_prev_calculated=0;
            return(false);
           }
        }
     }
//---
   return(true);
  }
A função CheckAvailableData() não permitirá fazer outros cálculos até que os dados para todos os símbolos estejam prontos. A operação de todas as funções de verificação seguem um padrão semelhante.
A próxima função é necessária para monitorar o evento de carregar um histórico mais profundo de cotações. Vamos chamá-la de CheckEventLoadHistory(). Se uma quantidade maior de dados for carregada, o indicador deve ser totalmente recalculado. O código-fonte desta função é fornecido abaixo:
//+------------------------------------------------------------------+
//| Checking the event of loading a deeper history                   |
//+------------------------------------------------------------------+
bool CheckLoadedHistory()
  {
   bool loaded=false;
//---
   for(int s=0; s<SYMBOLS_COUNT; s++)
     {
      //--- If this symbol is available
      if(symbol_names[s]!=empty_symbol)
        {
         //--- If the series need to be updated
         if(OC_prev_calculated==0)
           {
            //--- Get the first date by the symbol/time frame
            series_first_date[s]=(datetime)SeriesInfoInteger(symbol_names[s],Period(),SERIES_FIRSTDATE);
            //--- If this is the first time (no value is available), then
            if(series_first_date_last[s]==NULL)
               //--- Store the first date by the symbol/time frame for further comparison
               //    in order to determine if a deeper history has been loaded
               series_first_date_last[s]=series_first_date[s];
           }
         else
           {
            //--- Get the first date by the symbol/time frame
            series_first_date[s]=(datetime)SeriesInfoInteger(symbol_names[s],Period(),SERIES_FIRSTDATE);
            //--- If the dates are different, i.e. the date in the memory is later than the one we have just obtained,
            //     this means that a deeper history has been loaded
            if(series_first_date_last[s]>series_first_date[s])
              {
               //--- Print the relevant message to the log
               Print("(",symbol_names[s],",",TimeframeToString(Period()),
                     ") > A deeper history has been loaded/generated: ",
                     series_first_date_last[s]," > ",series_first_date[s]);
               //--- Store the date
               series_first_date_last[s]=series_first_date[s];
               loaded=true;
              }
           }
        }
     }
//--- If a deeper history has been loaded/generated, then
//    send the command to refresh the plotting series of the indicator
   if(loaded)
      return(false);
//---
   return(true);
  }
Vamos escrever outra função para a verificação de sincronização entre os dados no terminal e no servidor. Esta verificação só será executada se a conexão com o servidor estiver estabelecida. O código de função CheckSymbolIsSynchronized() é fornecido abaixo.
//+------------------------------------------------------------------+
//| Checking synchronization by symbol/time frame                    |
//+------------------------------------------------------------------+
bool CheckSymbolIsSynchronized()
  {
//--- If the connection to the server is established, check the data synchronization
   if(TerminalInfoInteger(TERMINAL_CONNECTED))
     {
      for(int s=0; s<SYMBOLS_COUNT; s++)
        {
         //--- If the symbol is available
         if(symbol_names[s]!=empty_symbol)
           {
            //--- If the data are not synchronized, print the relevant message and try again
            if(!SeriesInfoInteger(symbol_names[s],Period(),SERIES_SYNCHRONIZED))
              {
               msg_last=msg_not_synchronized;
               ShowCanvasMessage(msg_not_synchronized);
               return(false);
              }
           }
        }
     }
//---
   return(true);
  }
Ou seja, a função para a conversão do período de tempo em uma sequência será tomada dos artigos anteriores da série "Guia prático do MQL5":
//+------------------------------------------------------------------+
//| Converting time frame to a string                                |
//+------------------------------------------------------------------+
string TimeframeToString(ENUM_TIMEFRAMES timeframe)
  {
   string str="";
//--- If the value passed is incorrect, take the current chart time frame
   if(timeframe==WRONG_VALUE || timeframe== NULL)
      timeframe= Period();
   switch(timeframe)
     {
      case PERIOD_M1  : str="M1";  break;
      case PERIOD_M2  : str="M2";  break;
      case PERIOD_M3  : str="M3";  break;
      case PERIOD_M4  : str="M4";  break;
      case PERIOD_M5  : str="M5";  break;
      case PERIOD_M6  : str="M6";  break;
      case PERIOD_M10 : str="M10"; break;
      case PERIOD_M12 : str="M12"; break;
      case PERIOD_M15 : str="M15"; break;
      case PERIOD_M20 : str="M20"; break;
      case PERIOD_M30 : str="M30"; break;
      case PERIOD_H1  : str="H1";  break;
      case PERIOD_H2  : str="H2";  break;
      case PERIOD_H3  : str="H3";  break;
      case PERIOD_H4  : str="H4";  break;
      case PERIOD_H6  : str="H6";  break;
      case PERIOD_H8  : str="H8";  break;
      case PERIOD_H12 : str="H12"; break;
      case PERIOD_D1  : str="D1";  break;
      case PERIOD_W1  : str="W1";  break;
      case PERIOD_MN1 : str="MN1"; break;
     }
//---
   return(str);
  }
E, finalmente, precisamos identificar e salvar a primeira barra real para cada símbolo, marcando-a no gráfico com uma linha vertical. Para fazer isso, vamos escrever uma função DetermineFirstTrueBar() e uma função auxiliar GetFirstTrueBarTime() que retorna a hora da primeira barra real.
//+-----------------------------------------------------------------------+
//| Determining the time of the first true bar for the purpose of drawing |
//+-----------------------------------------------------------------------+
bool DetermineFirstTrueBar()
  {
   for(int s=0; s<SYMBOLS_COUNT; s++)
     {
      datetime time[];           // Bar time array
      int      available_bars=0; // Number of bars
      //--- If this symbol is not available, move to the next one
      if(symbol_names[s]==empty_symbol)
         continue;
      //--- Get the total number of bars for the symbol
      available_bars=Bars(symbol_names[s],Period());
      //--- Copy the bar time array. If this action failed, try again.
      if(CopyTime(symbol_names[s],Period(),0,available_bars,time)<available_bars)
         return(false);
      //--- Get the time of the first true bar corresponding to the current time frame
      limit_time[s]=GetFirstTrueBarTime(time);
      //--- Place a vertical line on the true bar
      CreateVerticalLine(0,0,limit_time[s],prefix+symbol_names[s]+": begin time series",
                          2,STYLE_SOLID,line_colors[s],false,TimeToString(limit_time[s]),"\n");
     }
//---
   return(true);
  }
//+-----------------------------------------------------------------------+
//| Returning the time of the first true bar of the current time frame    |
//+-----------------------------------------------------------------------+
datetime GetFirstTrueBarTime(datetime &time[])
  {
   datetime true_period =NULL; // Time of the first true bar
   int      array_size  =0;    // Array size
//--- Get the array size
   array_size=ArraySize(time);
   ArraySetAsSeries(time,false);
//--- Check each bar one by one
   for(int i=1; i<array_size; i++)
     {
      //--- If the bar corresponds to the current time frame
      if(time[i]-time[i-1]==PeriodSeconds())
        {
         //--- Save it and terminate the loop
         true_period=time[i];
         break;
        }
     }
//--- Return the time of the first true bar
   return(true_period);
  }
O tempo da primeira barra real é marcado no gráfico com uma linha vertical usando a função CreateVerticalLine():
//+------------------------------------------------------------------+
//| Creating a vertical line at the specified time point             |
//+------------------------------------------------------------------+
void CreateVerticalLine(long            chart_id,           // chart id
                        int             window_number,      // window number
                        datetime        time,               // time
                        string          object_name,        // object name
                        int             line_width,         // line width
                        ENUM_LINE_STYLE line_style,         // line style
                        color           line_color,         // line color
                        bool            selectable,         // cannot select the object if FALSE
                        string          description_text,   // text of the description
                        string          tooltip)            // no tooltip if "\n"
  {
//--- If the object has been created successfully
   if(ObjectCreate(chart_id,object_name,OBJ_VLINE,window_number,time,0))
     {
      //--- set its properties
      ObjectSetInteger(chart_id,object_name,OBJPROP_TIME,time);
      ObjectSetInteger(chart_id,object_name,OBJPROP_SELECTABLE,selectable);
      ObjectSetInteger(chart_id,object_name,OBJPROP_STYLE,line_style);
      ObjectSetInteger(chart_id,object_name,OBJPROP_WIDTH,line_width);
      ObjectSetInteger(chart_id,object_name,OBJPROP_COLOR,line_color);
      ObjectSetString(chart_id,object_name,OBJPROP_TEXT,description_text);
      ObjectSetString(chart_id,object_name,OBJPROP_TOOLTIP,tooltip);
     }
  }
As funções de verificação estão prontas. Como resultado, a parte do código de função OnCalculate() quando a variável prev_calculated for igual a zero, será agora conforme mostrado abaixo:
//--- If this is the first calculation or if a deeper history has been loaded or gaps in the history have been filled
   if(prev_calculated==0)
     {
      //--- Zero out arrays for data preparation
      ZeroCalculatedArrays();
      //--- Zero out indicator buffers
      ZeroIndicatorBuffers();
      //--- Get subwindow properties
      GetSubwindowGeometry();
      //--- Add the canvas
      SetCanvas();
      //--- Load and generate the necessary/available amount of data
      LoadAndFormData();
      //--- If there is an invalid handle, try to get it again
      if(!GetIndicatorHandles())
         return(RESET);
      //--- Check the amount of data available for all symbols
      if(!CheckAvailableData())
         return(RESET);
      //--- Check if a deeper history has been loaded
      if(!CheckLoadedHistory())
         return(RESET);
      //--- Check synchronization by symbol/time frame at the current moment
      if(!CheckSymbolIsSynchronized())
         return(RESET);
      //--- For each symbol, determine the bar from which we should start drawing
      if(!DetermineFirstTrueBar())
         return(RESET);
      //--- If you reached this point, it means that OnCalculate() will return non-zero value and this needs to be saved
      OC_prev_calculated=rates_total;
     }
Agora, toda vez que uma determinada verificação falhar, o programa voltará um passo para fazer outra tentativa no próximo tick ou evento temporizador. No temporizador, devemos também executar a verificação para carregar um histórico mais profundo fora da função OnCalculate():
//+------------------------------------------------------------------+
//| Timer function                                                   |
//+------------------------------------------------------------------+
void OnTimer()
  {
//--- If a deeper history has been loaded
   if(!CheckLoadedHistory())
      OC_prev_calculated=0;
//--- If for some reason calculations have not been completed or
//    a deeper history has been loaded or
//    gaps in the history have been filled,
//    then make another attempt without waiting for the new tick
   if(OC_prev_calculated==0)
     {
      OnCalculate(OC_rates_total,OC_prev_calculated,
                  OC_time,OC_open,OC_high,OC_low,OC_close,
                  OC_tick_volume,OC_volume,OC_spread);
     }
  }
Agora precisamos apenas escrever mais dois ciclos principais para serem colocados na função OnCalculate():
- O primeiro ciclo preparará os dados com base no princípio de "receber o valor de todos os meios" para evitar lacunas em série de indicador. A ideia por trás disso é simples: um determinado número de tentativas serão feitas em caso de falha para obter o valor. Neste ciclo, os valores de tempo dos símbolos e valores de indicador de volatilidade (ATR) serão salvos em matrizes separadas.
- No segundo ciclo principal, ao preencher buffers indicadores, matrizes de tempo de outros símbolos serão necessárias para a comparação com o tempo do símbolo atual e sincronização de todas a série de plotagem.
O código do primeiro ciclo é fornecido abaixo:
//--- Prepare data for drawing
   for(int s=0; s<SYMBOLS_COUNT; s++)
     {
      //--- If the symbol is available
      if(symbol_names[s]!=empty_symbol)
        {
         double percent=0.0; // For the purpose of calculating the progress percentage
         msg_last=msg_sync_update="Preparing data ("+IntegerToString(rates_total)+" bars) : "+
                      symbol_names[s]+"("+(string)(s+1)+"/"+(string)(SYMBOLS_COUNT)+") - 00% ... ";
         //--- Print the message
         ShowCanvasMessage(msg_sync_update);
         //--- Control every value of the array
         for(int i=limit; i<rates_total; i++)
           {
            PrepareData(i,s,time);
            //--- Refresh the message once every 1000 bars
            if(i%1000==0)
              {
               //--- Progress percentage
               ProgressPercentage(i,s,percent);
               //--- Print the message
               ShowCanvasMessage(msg_sync_update);
              }
            //--- Check the subwindow size once every 2000 bars
            //    and if the size has changed, adjust the canvas size to it
            if(i%2000==0)
               OnSubwindowChange();
           }
        }
     }
A principal função de copiar e salvar os valores, PrepareData(), está destacada no código acima. Existe também uma função nova, que ainda não tenha sido considerada - ProgressPercentage(). Ela calcula o percentual de progresso da operação atual para que o usuário saiba quanto tempo isso vai durar.
O código da função PrepareData() é o seguinte:
//+------------------------------------------------------------------+
//| Preparing data before drawing                                    |
//+------------------------------------------------------------------+
void PrepareData(int bar_index,int symbol_number,datetime const &time[])
  {
   int attempts=100; // Number of copying attempts
//--- Time of the bar of the specified symbol and time frame
   datetime symbol_time[];
//--- Array for copying indicator values
   double atr_values[];
//--- If within the area of the current time frame bars
   if(time[bar_index]>=limit_time[symbol_number])
     {
      //--- Copy the time
      for(int i=0; i<attempts; i++)
        {
         if(CopyTime(symbol_names[symbol_number],0,time[bar_index],1,symbol_time)==1)
           {
            tmp_symbol_time[symbol_number].time[bar_index]=symbol_time[0];
            break;
           }
        }
      //--- Copy the indicator value
      for(int i=0; i<attempts; i++)
        {
         if(CopyBuffer(symbol_handles[symbol_number],0,time[bar_index],1,atr_values)==1)
           {
            tmp_atr_values[symbol_number].value[bar_index]=atr_values[0];
            break;
           }
        }
     }
//--- If outside the area of the current time frame bars, set an empty value
   else
      tmp_atr_values[symbol_number].value[bar_index]=EMPTY_VALUE;
  }
O código da função ProgressPercentage() é o seguinte:
//+------------------------------------------------------------------+
//| Calculating progress percentage                                  |
//+------------------------------------------------------------------+
void ProgressPercentage(int bar_index,int symbol_number,double &percent)
  {
   string message_text="";
   percent=(double(bar_index)/OC_rates_total)*100;
//---
   if(percent<=9.99)
      message_text="0"+DoubleToString(percent,0);
   else if(percent<99)
      message_text=DoubleToString(percent,0);
   else
      message_text="100";
//---
   msg_last=msg_sync_update="Preparing data ("+(string)OC_rates_total+" bars) : "+
            symbol_names[symbol_number]+
            "("+(string)(symbol_number+1)+"/"+(string)SYMBOLS_COUNT+") - "+message_text+"% ... ";
  }
Os buffers indicadores são preenchido no segundo ciclo principal da função OnCalculate():
//--- Fill indicator buffers
   for(int s=0; s<SYMBOLS_COUNT; s++)
     {
      //--- If the specified symbol does not exist, zero out the buffer
      if(symbol_names[s]==empty_symbol)
         ArrayInitialize(atr_buffers[s].data,EMPTY_VALUE);
      else
        {
         //--- Generate a message
         msg_last=msg_sync_update="Updating indicator data: "+
                      symbol_names[s]+"("+(string)(s+1)+"/"+(string)SYMBOLS_COUNT+") ... ";
         //--- Print the message
         ShowCanvasMessage(msg_sync_update);
         //--- Fill indicator buffers with values
         for(int i=limit; i<rates_total; i++)
           {
            FillIndicatorBuffers(i,s,time);
            //--- Check the subwindow size once every 2000 bars
            //    and if the size has changed, adjust the canvas size to it
            if(i%2000==0)
               OnSubwindowChange();
           }
        }
     }
A sequência destacada no código acima contém a função FillIndicatorBuffers(). Este é o lugar onde as operações finais são realizadas antes de exibir a série de plotagem do indicador no gráfico:
//+------------------------------------------------------------------+
//| Filling indicator buffers                                        |
//+------------------------------------------------------------------+
void FillIndicatorBuffers(int bar_index,int symbol_number,datetime const &time[])
  {
//--- For the purpose of checking the obtained indicator value
   bool check_value=false;
//--- Counter of the current time frame bars
   static int bars_count=0;
//--- Zero out the counter of the current time frame bars at the beginning of the symbol's time series
   if(bar_index==0)
      bars_count=0;
//--- If within the area of current time frame bars and the counter is smaller
//    than the specified indicator period, increase the counter
   if(bars_count<IndicatorPeriod && time[bar_index]>=limit_time[symbol_number])
      bars_count++;
//--- If within the indicator area and the time of the current symbol coincides with the time of the specified symbol
   if(bars_count>=IndicatorPeriod &&
      time[bar_index]==tmp_symbol_time[symbol_number].time[bar_index])
     {
      //--- If the value obtained is not empty
      if(tmp_atr_values[symbol_number].value[bar_index]!=EMPTY_VALUE)
        {
         check_value=true;
         atr_buffers[symbol_number].data[bar_index]=tmp_atr_values[symbol_number].value[bar_index];
        }
     }
//--- Set an empty value in case of failure to set a higher value
   if(!check_value)
      atr_buffers[symbol_number].data[bar_index]=EMPTY_VALUE;
  }
No final da função OnCalculate() precisamos apagar a tela, definir níveis, zerar variáveis de mensagens e atualizar o gráfico. Finalmente, o tamanho da matriz rates_total será retornado, após o qual apenas o último valor será recalculado a cada instante ou a cada evento temporizador ou tick subsequente em OnCalculate().
Estas são as sequências de código para serem inseridas entre o segundo ciclo principal e o valor retornado pela função:
//--- Delete the canvas
   DeleteCanvas();
//--- Set indicator levels
   SetIndicatorLevels();
//--- Zero out variables
   msg_last="";
   msg_sync_update="";
//--- Refresh the chart
   ChartRedraw();
O código da função SetIndicatorLevels() para definir os níveis horizontais é o seguinte:
//+------------------------------------------------------------------------+
//| Setting indicator levels                                               |
//+------------------------------------------------------------------------+
void SetIndicatorLevels()
  {
//--- Get the indicator subwindow number
   subwindow_number=ChartWindowFind(0,subwindow_shortname);
//--- Set levels
   for(int i=0; i<LEVELS_COUNT; i++)
      CreateHorizontalLine(0,subwindow_number,
                            prefix+"level_0"+(string)(i+1)+"",
                            CorrectValueBySymbolDigits(indicator_levels[i]*_Point),
                            1,STYLE_DOT,clrLightSteelBlue,false,false,false,"\n");
  }
//+------------------------------------------------------------------------+
//| Adjusting the value based on the number of digits in the price (double)|
//+------------------------------------------------------------------------+
double CorrectValueBySymbolDigits(double value)
  {
   return(_Digits==3 || _Digits==5) ? value*=10 : value;
  }
O código da função CreateHorizontalLine() para definir um nível horizontal, com as propriedades especificadas é como se segue:
//+------------------------------------------------------------------+
//| Creating a horizontal line at the price level specified          |
//+------------------------------------------------------------------+
void CreateHorizontalLine(long            chart_id,      // chart id
                          int             window_number, // window number
                          string          object_name,   // object name
                          double          price,         // price level
                          int             line_width,    // line width
                          ENUM_LINE_STYLE line_style,    // line style
                          color           line_color,    // line color
                          bool            selectable,    // cannot select the object if FALSE
                          bool            selected,      // line is selected
                          bool            back,          // background position
                          string          tooltip)       // no tooltip if "\n"
  {
//--- If the object has been created successfully
   if(ObjectCreate(chart_id,object_name,OBJ_HLINE,window_number,0,price))
     {
      //--- set its properties
      ObjectSetInteger(chart_id,object_name,OBJPROP_SELECTABLE,selectable);
      ObjectSetInteger(chart_id,object_name,OBJPROP_SELECTED,selected);
      ObjectSetInteger(chart_id,object_name,OBJPROP_BACK,back);
      ObjectSetInteger(chart_id,object_name,OBJPROP_STYLE,line_style);
      ObjectSetInteger(chart_id,object_name,OBJPROP_WIDTH,line_width);
      ObjectSetInteger(chart_id,object_name,OBJPROP_COLOR,line_color);
      ObjectSetString(chart_id,object_name,OBJPROP_TOOLTIP,tooltip);
     }
  }
Funções para excluir objetos gráficos:
//+------------------------------------------------------------------+
//| Deleting levels                                                  |
//+------------------------------------------------------------------+
void DeleteLevels()
  {
   for(int i=0; i<LEVELS_COUNT; i++)
      DeleteObjectByName(prefix+"level_0"+(string)(i+1)+"");
  }
//+------------------------------------------------------------------+
//| Deleting vertical lines of the beginning of the series           |
//+------------------------------------------------------------------+
void DeleteVerticalLines()
  {
   for(int s=0; s<SYMBOLS_COUNT; s++)
      DeleteObjectByName(prefix+symbol_names[s]+": begin time series");
  }
//+------------------------------------------------------------------+
//| Deleting the object by name                                      |
//+------------------------------------------------------------------+
void DeleteObjectByName(string object_name)
  {
//--- If such object exists
   if(ObjectFind(0,object_name)>=0)
     {
      //--- If an error occurred when deleting, print the relevant message
      if(!ObjectDelete(0,object_name))
         Print("Error ("+IntegerToString(GetLastError())+") when deleting the object!");
     }
  }
O código a seguir deve ser adicionado à função OnDeinit():
Agora tudo está pronto e pode ser totalmente testado. O número máximo de barras na janela pode ser configurado na aba Gráficos das configurações do terminal. A rapidez com que o indicador estará pronto para ser executado está condicionada ao número de barras na janela.

Fig. 1. Ajuste do número máximo de barras nas configurações do terminal
Ao carregar o indicador ao gráfico, você pode ver o progresso da preparação de dados para todos os símbolos:

Fig. 2. As mensagem na tela durante a preparação de dados
Abaixo você pode ver a tela que exibe o indicador em um prazo de tempo de 20 minutos:

Fig. 3. Indicador ATR de símbolos múltiplos em um prazo de tempo de 20 minutos
O início das barras "reais" é marcado no gráfico com as linhas verticais. A imagem abaixo mostra que as barras reais para NZDUSD (linha amarela) começam a partir de 2000 (servidor MetaQuotes-Demo), enquanto para todos os outros pares de moedas de barras reais aparecem no início de 1999, razão pela qual apenas uma linha é exibida (todos elas estão na mesma data). Também podemos notar que os separadores de tempo têm um intervalo menor anterior a 1999 e se você analisar o tempo das barras, você será capaz de ver que estas são barras diárias.
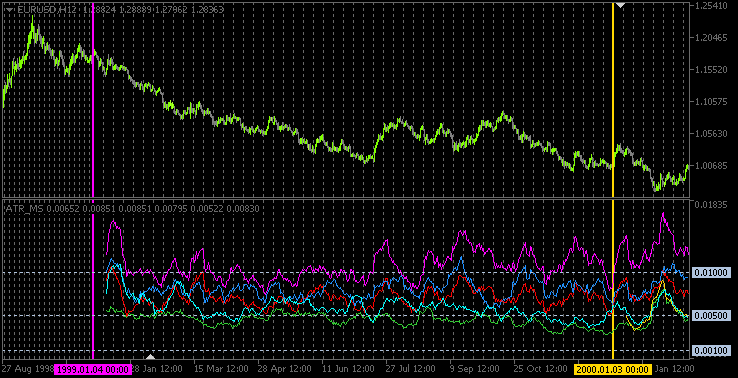
Fig. 4. As linhas verticais marcam o início de barras reais para cada símbolo
Conclusão
Este artigo pode ser terminado aqui. O código-fonte descrito está anexo ao artigo e está disponível para download. Em um dos artigos futuros, vamos tentar implementar um sistema de negociação que analisa a volatilidade e ver o que aparece a partir dela.
Traduzido do russo pela MetaQuotes Ltd.
Artigo original: https://www.mql5.com/ru/articles/752
 Criando um Expert Advisor multissistema e multimoeda
- Aplicativos de negociação gratuitos
- 8 000+ sinais para cópia
- Notícias econômicas para análise dos mercados financeiros
Você concorda com a política do site e com os termos de uso