
MQL5 Cookbook: Sviluppo di un indicatore di volatilità multi-simbolo in MQL5

Introduzione
In questo articolo, considereremo lo sviluppo di un indicatore di volatilità multi-simbolo. Lo sviluppo di indicatori multi-simbolo può presentare alcune difficoltà per gli sviluppatori MQL5 alle prime armi che questo articolo aiuta a chiarire. Le principali questioni che sorgono nel corso dello sviluppo di un indicatore multi-simbolo hanno a che fare con la sincronizzazione dei dati di altri simboli rispetto al simbolo corrente, con la mancanza di alcuni dati indicatori e con l'identificazione dell'inizio di barre "vere" di un determinato intervallo di tempo. Tutti questi problemi saranno attentamente considerati nell'articolo.
Otterremo i valori dell'indicatore ATR (Average True Range) già calcolati per ciascun simbolo in base alla maniglia. A scopo illustrativo, ci saranno sei simboli i cui nomi possono essere impostati nei parametri esterni dell'indicatore. I nomi inseriti verranno controllati per essere corretti. Se un determinato simbolo specificato nei parametri non è disponibile nell'elenco generale, non verranno effettuati calcoli per esso. Tutti i simboli disponibili verranno aggiunti alla finestra Market Watch, a meno che non siano già disponibili lì.
Nel precedente articolo intitolato "MQL5 Cookbook: Indicator Subwindow Controls - Scrollbar" abbiamo già parlato della tela su cui è possibile stampare testo e persino disegnare. Questa volta, non disegneremo sulla tela, ma la useremo per visualizzare messaggi sui processi del programma corrente per far sapere all'utente cosa sta succedendo in un determinato momento.
Sviluppo dell'indicatore
Iniziamo lo sviluppo del programma. Utilizzando la procedura guidata MQL5, creare un modello di indicatore personalizzato. Dopo alcune modifiche, dovresti ottenere il codice sorgente come mostrato di seguito:
//+------------------------------------------------------------------+
//|                                               MultiSymbolATR.mq5 |
//|                        Copyright 2010, MetaQuotes Software Corp. |
//|                                              http://www.mql5.com |
//+------------------------------------------------------------------+
//--- Indicator properties
#property copyright "Copyright 2010, MetaQuotes Software Corp."
#property link      "http://www.mql5.com"
#property version   "1.00"
#property indicator_separate_window // Indicator is in a separate subwindow
#property indicator_minimum 0       // Minimum value of the indicator
#property indicator_buffers 6       // Number of buffers for indicator calculation
#property indicator_plots   6       // Number of plotting series
//+------------------------------------------------------------------+
//| Custom indicator initialization function                         |
//+------------------------------------------------------------------+
int OnInit()
  {
//--- Initialization completed successfully
   return(INIT_SUCCEEDED);
  }
//+------------------------------------------------------------------+
//| Deinitialization                                                 |
//+------------------------------------------------------------------+
void OnDeinit(const int reason)
  {
  }
//+------------------------------------------------------------------+
//| Custom indicator iteration function                              |
//+------------------------------------------------------------------+
int OnCalculate(const int      rates_total,     // Size of input time series
                const int      prev_calculated, // Bars processed at the previous call
                const datetime &time[],         // Opening time
                const double   &open[],         // Open prices
                const double   &high[],         // High prices
                const double   &low[],          // Low prices
                const double   &close[],        // Close prices
                const long     &tick_volume[],  // Tick volumes
                const long     &volume[],       // Real volumes
                const int      &spread[])       // Spread
  {
//--- Return the size of the data array of the current symbol
   return(rates_total);
  }
//+------------------------------------------------------------------+
//| Timer function                                                   |
//+------------------------------------------------------------------+
void OnTimer()
  {
  }
//+------------------------------------------------------------------+
Per implementare la nostra idea, riempiremo ulteriormente questo modello con tutto ciò che è richiesto. La necessità di un timer sarà spiegata più avanti nell'articolo. Aggiungiamo costanti all'inizio, subito dopo le proprietà specifiche dell'indicatore:
//--- Constants
#define RESET           0 // Returning the indicator recalculation command to the terminal
#define LEVELS_COUNT    6 // Number of levels
#define SYMBOLS_COUNT   6 // Number of symbols
La costante LEVELS_COUNT contiene il valore del numero di livelli rappresentati da oggetti grafici di tipo "Linea orizzontale" (orizzontaleOBJ_HLINE). I valori di questi livelli possono essere specificati nei parametri esterni dell'indicatore.
Includiamo nel progetto un file con la classe per lavorare con la grafica personalizzata:
//--- Include the class for working with the canvas
#include <Canvas\Canvas.mqh>
Nei parametri esterni, specificheremo il periodo di media iATR i nomi dei simboli di cui deve essere visualizzata la volatilità e i valori di livello orizzontale. I simboli sono numerato a partire da 2 in quanto il primo simbolo è considerato quello al cui grafico è attaccato l'indicatore.
//--- External parameters
input  int              IndicatorPeriod=14;       // Averaging period
sinput string dlm01=""; //- - - - - - - - - - - - - - - - - - - - - - - - - - -
input  string           Symbol02       ="GBPUSD"; // Symbol 2
input  string           Symbol03       ="AUDUSD"; // Symbol 3
input  string           Symbol04       ="NZDUSD"; // Symbol 4
input  string           Symbol05       ="USDCAD"; // Symbol 5
input  string           Symbol06       ="USDCHF"; // Symbol 6
sinput string dlm02=""; //- - - - - - - - - - - - - - - - - - - - - - - - - - -
input  int              Level01        =10;       // Level 1
input  int              Level02        =50;       // Level 2
input  int              Level03        =100;      // Level 3
input  int              Level04        =200;      // Level 4
input  int              Level05        =400;      // Level 5
input  int              Level06        =600;      // Level 6
Più avanti nel codice dovremmo creare tutte le variabili e gli array globali con cui lavorare in seguito. Tutti sono forniti nel codice sottostante con commenti dettagliati:
//--- Global variables and arrays
CCanvas           canvas;                 // Loading the class
//--- Variables/arrays for copying data from OnCalculate()
int               OC_rates_total     =0;  // Size of input time series
int               OC_prev_calculated =0;  // Bars processed at the previous call
datetime          OC_time[];              // Opening time
double            OC_open[];              // Open prices
double            OC_high[];              // High prices
double            OC_low[];               // Low prices
double            OC_close[];             // Close prices
long              OC_tick_volume[];       // Tick volumes
long              OC_volume[];            // Real volumes
int               OC_spread[];            // Spread
//--- Structure of buffers for drawing indicator values
struct buffers {double data[];};
buffers           atr_buffers[SYMBOLS_COUNT];
//--- Structure of time arrays for data preparation
struct temp_time {datetime time[];};
temp_time         tmp_symbol_time[SYMBOLS_COUNT];
//--- Structure of arrays of the ATR indicator values for data preparation
struct temp_atr {double value[];};
temp_atr          tmp_atr_values[SYMBOLS_COUNT];
//--- For the purpose of storing and checking the time of the first bar in the terminal
datetime          series_first_date[SYMBOLS_COUNT];
datetime          series_first_date_last[SYMBOLS_COUNT];
//--- Time of the bar from which we will start drawing
datetime          limit_time[SYMBOLS_COUNT];
//--- Indicator levels
int               indicator_levels[LEVELS_COUNT];
//--- Symbol names
string            symbol_names[SYMBOLS_COUNT];
//--- Symbol handles
int               symbol_handles[SYMBOLS_COUNT];
//--- Colors of indicator lines
color             line_colors[SYMBOLS_COUNT]={clrRed,clrDodgerBlue,clrLimeGreen,clrGold,clrAqua,clrMagenta};
//--- String representing the lack of the symbol
string            empty_symbol="EMPTY";
//--- Indicator subwindow properties
int               subwindow_number        =WRONG_VALUE;              // Subwindow number
int               chart_width             =0;                        // Chart width
int               subwindow_height        =0;                        // Subwindow height
int               last_chart_width        =0;                        // Last saved chart width
int               last_subwindow_height   =0;                        // Last saved subwindow height
int               subwindow_center_x      =0;                        // Horizontal center of the subwindow
int               subwindow_center_y      =0;                        // Vertical center of the subwindow
string            subwindow_shortname     ="MS_ATR";                 // Short name of the indicator
string            prefix                  =subwindow_shortname+"_";  // Prefix for objects
//--- Canvas properties
string            canvas_name             =prefix+"canvas";          // Canvas name
color             canvas_background       =clrBlack;                 // Canvas background color
uchar             canvas_opacity          =190;                      // Opacity
int               font_size               =16;                       // Font size
string            font_name               ="Calibri";                // Font
ENUM_COLOR_FORMAT clr_format              =COLOR_FORMAT_ARGB_RAW;    // Color components should be correctly set by the user
//--- Canvas messages
string            msg_invalid_handle      ="Invalid indicator handle! Please wait...";
string            msg_prepare_data        ="Preparing data! Please wait...";
string            msg_not_synchronized    ="Unsynchronized data! Please wait...";
string            msg_load_data           ="";
string            msg_sync_update         ="";
string            msg_last                ="";
//--- Maximum number of bars specified in the terminal settings
int               terminal_max_bars=0;
Quando si carica l'indicatore sul grafico, OnInit() eseguirà le seguenti azioni:
- Proprietà comuni degli indicatori
- determinazione delle matrici per disegnare serie di plottaggio;
- inizializzazione degli array;
- aggiunta di simboli specificati nei parametri esterni alla finestra Market Watch;
- verificare la correttezza dei parametri e fare il primo tentativo di ottenere le maniglie degli indicatori.
Tutte queste azioni saranno trattate in modo più conveniente se disposte in funzioni separate. Di conseguenza, le funzioni di gestione degli eventi: il codice sorgente della funzione OnInit() diventerà molto facile da capire come mostrato di seguito:
//+------------------------------------------------------------------+
//| Custom indicator initialization function                         |
//+------------------------------------------------------------------+
int OnInit()
  {
//--- Check input parameters for correctness
   if(!CheckInputParameters())
      return(INIT_PARAMETERS_INCORRECT);
//--- Set the timer at 1-second intervals
   EventSetTimer(1);
//--- Set the font to be displayed on the canvas
   canvas.FontSet(font_name,font_size,FW_NORMAL);
//--- Initialization of arrays
   InitArrays();
//--- Initialize the array of symbols
   InitSymbolNames();
//--- Initialize the array of levels
   InitLevels();
//--- Get indicator handles
   GetIndicatorHandles();
//--- Set indicator properties
   SetIndicatorProperties();
//--- Get the number of bars specified in the terminal settings
   terminal_max_bars=TerminalInfoInteger(TERMINAL_MAXBARS);
//--- Clear the comment
   Comment("");
//--- Refresh the chart
   ChartRedraw();
//--- Initialization completed successfully
   return(INIT_SUCCEEDED);
  }
Diamo un'occhiata più da vicino alle funzioni personalizzate utilizzate nel codice sopra. Nella funzione CheckInputParameters() controlliamo la correttezza dei parametri esterni. Nel nostro caso, controlliamo solo un parametro: il periodo dell'indicatore ATR. Ho impostato il valore di restrizione di 500. Cioè, se si imposta il valore del periodo superiore al valore specificato, l'indicatore cesserà il suo funzionamento e stamperà il messaggio sul motivo della cessazione del programma nel registro e nel commento del grafico. Il codice di funzione CheckInputParameters() è fornito di seguito.
//+------------------------------------------------------------------+
//| Checking input parameters for correctness                        |
//+------------------------------------------------------------------+
bool CheckInputParameters()
  {
   if(IndicatorPeriod>500)
     {
      Comment("Decrease the indicator period! Indicator Period: ",IndicatorPeriod,"; Limit: 500;");
      printf("Decrease the indicator period! Indicator Period: %d; Limit: %d;",IndicatorPeriod,500);
      return(false);
     }
//---
   return(true);
  }
Quindi passiamo a tre funzioni di inizializzazione dell'array: InitArrays(), InitSymbolNames() e InitLevels(). I rispettivi codici sorgente sono forniti di seguito:
//+------------------------------------------------------------------+
//| First initialization of arrays                                   |
//+------------------------------------------------------------------+
void InitArrays()
  {
   ArrayInitialize(limit_time,NULL);
   ArrayInitialize(series_first_date,NULL);
   ArrayInitialize(series_first_date_last,NULL);
   ArrayInitialize(symbol_handles,INVALID_HANDLE);
//---
   for(int s=0; s<SYMBOLS_COUNT; s++)
      ArrayInitialize(atr_buffers[s].data,EMPTY_VALUE);
  }
//+------------------------------------------------------------------+
//| Initializing array of symbols                                    |
//+------------------------------------------------------------------+
void InitSymbolNames()
  {
   symbol_names[0]=AddSymbolToMarketWatch(_Symbol);
   symbol_names[1]=AddSymbolToMarketWatch(Symbol02);
   symbol_names[2]=AddSymbolToMarketWatch(Symbol03);
   symbol_names[3]=AddSymbolToMarketWatch(Symbol04);
   symbol_names[4]=AddSymbolToMarketWatch(Symbol05);
   symbol_names[5]=AddSymbolToMarketWatch(Symbol06);
  }
//+------------------------------------------------------------------+
//| Initializing array of levels                                     |
//+------------------------------------------------------------------+
void InitLevels()
  {
   indicator_levels[0]=Level01;
   indicator_levels[1]=Level02;
   indicator_levels[2]=Level03;
   indicator_levels[3]=Level04;
   indicator_levels[4]=Level05;
   indicator_levels[5]=Level06;
  }
Nella funzione InitSymbolNames(), utilizziamo un'altra funzione personalizzata - AddSymbolToMarketWatch(). Riceve il nome del simbolo e se questo simbolo è disponibile nell'elenco generale, verrà aggiunto alla finestra Market Watch e la funzione restituirà la stringa con il nome del simbolo. Se tale simbolo non è disponibile, la funzione restituirà la stringa "EMPTY" e non verrà eseguita alcuna azione per questo elemento nella matrice di simboli durante l'esecuzione di controlli in altre funzioni.
//+------------------------------------------------------------------+
//| Adding the specified symbol to the Market Watch window           |
//+------------------------------------------------------------------+
string AddSymbolToMarketWatch(string symbol)
  {
   int      total=0; // Number of symbols
   string   name=""; // Symbol name
//--- If an empty string is passed, return the empty string
   if(symbol=="")
      return(empty_symbol);
//--- Total symbols on the server
   total=SymbolsTotal(false);
//--- Iterate over the entire list of symbols
   for(int i=0;i<total;i++)
     {
      //--- Symbol name on the server
      name=SymbolName(i,false);
      //--- If this symbol is available,
      if(name==symbol)
        {
         //--- add it to the Market Watch window and
         SymbolSelect(name,true);
         //--- return its name
         return(name);
        }
     }
//--- If this symbol is not available, return the string representing the lack of the symbol
   return(empty_symbol);
  }
GetIndicatorHandles() è un'altra funzione chiamata all'inizializzazione dell'indicatore. Tenta di ottenere le maniglie dell'indicatore ATR per ogni simbolo specificato. Se l'handle non è stato ottenuto per qualche simbolo, la funzione restituirà false ma questo non verrà elaborato in alcun modo nelle OnInitOnInit() poiché la disponibilità dell'handle verrà verificata in altre parti del programma.
//+------------------------------------------------------------------+
//| Getting indicator handles                                        |
//+------------------------------------------------------------------+
bool GetIndicatorHandles()
  {
//--- An indication of all handles being valid
   bool valid_handles=true;
//--- Iterate over all symbols in a loop and ...
   for(int s=0; s<SYMBOLS_COUNT; s++)
     {
      //--- If the symbol is available
      if(symbol_names[s]!=empty_symbol)
        {
         // And if the handle of the current symbol is invalid
         if(symbol_handles[s]==INVALID_HANDLE)
           {
            //--- Get it
            symbol_handles[s]=iATR(symbol_names[s],Period(),IndicatorPeriod);
            //--- If the handle could not be obtained, try again next time
            if(symbol_handles[s]==INVALID_HANDLE)
               valid_handles=false;
           }
        }
     }
//--- Print the relevant message if the handle for one of the symbols could not be obtained
   if(!valid_handles)
     {
      msg_last=msg_invalid_handle;
      ShowCanvasMessage(msg_invalid_handle);
     }
//---
   return(valid_handles);
  }
La funzione ShowCanvasMessage() verrà rivista un po 'più tardi insieme ad altre funzioni per lavorare con il canvas.
Le proprietà dell'indicatore sono impostate nella funzione SetIndicatorProperties(). Poiché le proprietà per ogni serie di plottaggio sono simili, è più conveniente impostarle usando i loop:
//+------------------------------------------------------------------+
//| Setting indicator properties                                     |
//+------------------------------------------------------------------+
void SetIndicatorProperties()
  {
//--- Set the short name
   IndicatorSetString(INDICATOR_SHORTNAME,subwindow_shortname);
//--- Set the number of decimal places
   IndicatorSetInteger(INDICATOR_DIGITS,_Digits);
//--- Define buffers for drawing
   for(int s=0; s<SYMBOLS_COUNT; s++)
      SetIndexBuffer(s,atr_buffers[s].data,INDICATOR_DATA);
//--- Set labels for the current symbol
   for(int s=0; s<SYMBOLS_COUNT; s++)
      PlotIndexSetString(s,PLOT_LABEL,"ATR ("+IntegerToString(s)+", "+symbol_names[s]+")");
//--- Set the plotting type: lines
   for(int s=0; s<SYMBOLS_COUNT; s++)
      PlotIndexSetInteger(s,PLOT_DRAW_TYPE,DRAW_LINE);
//--- Set the line width
   for(int s=0; s<SYMBOLS_COUNT; s++)
      PlotIndexSetInteger(s,PLOT_LINE_WIDTH,1);
//--- Set the line color
   for(int s=0; s<SYMBOLS_COUNT; s++)
      PlotIndexSetInteger(s,PLOT_LINE_COLOR,line_colors[s]);
//--- Empty value for plotting where nothing will be drawn
   for(int s=0; s<SYMBOLS_COUNT; s++)
      PlotIndexSetDouble(s,PLOT_EMPTY_VALUE,EMPTY_VALUE);
  }
Dopo aver inizializzato correttamente il programma, dobbiamo effettuare la prima chiamata delle funzioni di OnCalculate() funzione. Il valore della variabile prev_calculated è zero alla prima chiamata di funzione. Viene anche azzerato dal terminale quando viene caricata una storia più profonda o vengono riempite lacune nella cronologia. In questi casi, i buffer degli indicatori vengono completamente ricalcolati. Se questo valore del parametro è diverso da zero, cioè il risultato precedentemente restituito dalla stessa funzione, che è la dimensione delle serie temporali di input, è sufficiente aggiornare solo gli ultimi valori dei buffer.
Potresti non riuscire sempre a fare tutti i calcoli correttamente al primo tentativo. In questo caso, per restituire useremo la costante RESET che contiene valore zero. Alla successiva chiamata delle funzioni di OnCalculate() (ad esempio al segno di spunta successivo), il parametro prev_calculated conterrà valore zero, il che significa che dovremo fare un altro tentativo per eseguire tutti i calcoli necessari prima di visualizzare la serie di plottaggio dell'indicatore nel grafico.
Ma il grafico rimarrà vuoto quando il mercato è chiuso e non ci sono nuovi tick o a seguito di calcoli infruttuosi. In questo caso, puoi provare un modo semplice per dare un comando per fare un altro tentativo, modificando manualmente l'intervallo di tempo del grafico. Ma useremo un approccio diverso. Questo è il motivo per cui all'inizio abbiamo aggiunto il timer, le OnTimer() funzione, al nostro modello di programma e impostato l'intervallo di tempo di 1 secondo nelle funzioni di gestione degli OnInit() funzione.
Ogni secondo il timer controllerà se la OnCalculate() ha restituito zero. A tale scopo, scriveremo una funzione CopyDataOnCalculate() che copierà tutti i parametri dalle OnCalculate() alle variabili globali con nomi e matrici corrispondenti con il prefisso OC_ .
//+------------------------------------------------------------------+
//| Copying data from OnCalculate                                    |
//+------------------------------------------------------------------+
void CopyDataOnCalculate(const int      rates_total,
                         const int      prev_calculated,
                         const datetime &time[],
                         const double   &open[],
                         const double   &high[],
                         const double   &low[],
                         const double   &close[],
                         const long     &tick_volume[],
                         const long     &volume[],
                         const int      &spread[])
  {
   OC_rates_total=rates_total;
   OC_prev_calculated=prev_calculated;
   ArrayCopy(OC_time,time);
   ArrayCopy(OC_open,open);
   ArrayCopy(OC_high,high);
   ArrayCopy(OC_low,low);
   ArrayCopy(OC_close,close);
   ArrayCopy(OC_tick_volume,tick_volume);
   ArrayCopy(OC_volume,volume);
   ArrayCopy(OC_spread,spread);
  }
Questa funzione deve essere chiamata all'inizio delle funzioni di OnCalculate() corpo della funzione. Inoltre, all'inizio dovremmo anche aggiungere un'altra funzione personalizzata, ResizeCalculatedArrays(), che imposterà la dimensione sugli array per la preparazione dei dati prima di inserirli nei buffer degli indicatori. La dimensione di queste matrici deve essere uguale alla dimensione delle serie temporali di input.
//+------------------------------------------------------------------+
//| Resizing the size of arrays to the size of the main array        |
//+------------------------------------------------------------------+
void ResizeCalculatedArrays()
  {
   for(int s=0; s<SYMBOLS_COUNT; s++)
     {
      ArrayResize(tmp_symbol_time[s].time,OC_rates_total);
      ArrayResize(tmp_atr_values[s].value,OC_rates_total);
     }
  }
Inoltre, verrà creata una funzione ZeroCalculatedArrays() che inizializza le matrici per la preparazione dei dati a zero prima di inviarle al grafico.
//+------------------------------------------------------------------+
//| Zeroing out arrays for data preparation                          |
//+------------------------------------------------------------------+
void ZeroCalculatedArrays()
  {
   for(int s=0; s<SYMBOLS_COUNT; s++)
     {
      ArrayInitialize(tmp_symbol_time[s].time,NULL);
      ArrayInitialize(tmp_atr_values[s].value,EMPTY_VALUE);
     }
  }
La stessa funzione sarà richiesta per i buffer preliminari degli indicatori di zero out. Chiamiamolo ZeroIndicatorBuffers().
//+------------------------------------------------------------------+
//| Zeroing out indicator buffers                                    |
//+------------------------------------------------------------------+
void ZeroIndicatorBuffers()
  {
   for(int s=0; s<SYMBOLS_COUNT; s++)
      ArrayInitialize(atr_buffers[s].data,EMPTY_VALUE);
  }
Il codice corrente delle funzioni di OnCalculate() sarà come mostrato di seguito. Ho anche fornito commenti per le principali operazioni da compilare in seguito (commenti e punti sotto).
//+------------------------------------------------------------------+
//| Custom indicator iteration function                              |
//+------------------------------------------------------------------+
int OnCalculate(const int      rates_total,     // Size of input time series
                const int      prev_calculated, // Bars processed at the previous call
                const datetime &time[],         // Opening time
                const double   &open[],         // Open prices
                const double   &high[],         // High prices
                const double   &low[],          // Low prices
                const double   &close[],        // Close prices
                const long     &tick_volume[],  // Tick volumes
                const long     &volume[],       // Real volumes
                const int      &spread[])       // Spread
  {
//--- For the purpose of determining the bar from which the calculation shall be made
   int limit=0;
//--- Make a copy of the OnCalculate() parameters
   CopyDataOnCalculate(rates_total,prev_calculated,
                       time,open,high,low,close,
                       tick_volume,volume,spread);
//--- Set the size to arrays for data preparation
   ResizeCalculatedArrays();
//--- If this is the first calculation or if a deeper history has been loaded or gaps in the history have been filled
   if(prev_calculated==0)
     {
      //--- Zero out arrays for data preparation
      ZeroCalculatedArrays();
      //--- Zero out indicator buffers
      ZeroIndicatorBuffers();
      //--- Other checks
      // ...
      //--- If you reached this point, it means that OnCalculate() will return non-zero value and this needs to be saved
      OC_prev_calculated=rates_total;
     }
//--- If only the last values need to be recalculated
   else
      limit=prev_calculated-1;

//--- Prepare data for drawing
// ...
//--- Fill arrays with data for drawing
// ...

//--- Return the size of the data array of the current symbol
   return(rates_total);
  }
Attualmente, il codice della funzione OnTimer() è il seguente:
//+------------------------------------------------------------------+
//| Timer function                                                   |
//+------------------------------------------------------------------+
void OnTimer()
  {
//--- If for some reason calculations have not been completed or
//    a deeper history has been loaded or
//    gaps in the history have been filled,
//    then make another attempt without waiting for the new tick
   if(OC_prev_calculated==0)
     {
      OnCalculate(OC_rates_total,OC_prev_calculated,
                  OC_time,OC_open,OC_high,OC_low,OC_close,
                  OC_tick_volume,OC_volume,OC_spread);
     }
  }
Ora, consideriamo altre funzioni che verranno utilizzate quando la variabile prev_calculated è uguale a zero. Queste funzioni:
- caricheranno e genereranno la quantità necessaria di dati (barre);
- verificheranno la disponibilità di tutte le maniglie;
- verificheranno la prontezza della quantità richiesta di dati;
- sincronizzeranno i dati con il server;
- determineranno le barre da cui verranno disegnate le serie di plottaggio.
Inoltre, identificheremo la prima barra "vera" per ogni simbolo. Questo termine conciso è stato coniato per renderlo più conveniente in seguito. Ecco cosa significa. Tutti gli intervalli di tempo in MetaTrader 5 sono costruiti da dati minuti. Ma se, ad esempio, i dati giornalieri sul server sono disponibili dal 1993, mentre i dati dei minuti sono disponibili solo dal 2000, allora se selezioniamo, ad esempio, l'intervallo di tempo del grafico orario, le barre verranno costruite a partire dalla data in cui i dati dei minuti diventano disponibili, cioè dall'anno 2000. Tutto ciò che è precedente al 2000 sarà rappresentato da dati giornalieri o dai dati più vicini all'intervallo di tempo corrente. Pertanto, per evitare confusione, non è consigliabile visualizzare i dati degli indicatori per i dati non correlati all'intervallo di tempo corrente. Questo è il motivo per cui identificheremo la prima barra "vera" dell'intervallo di tempo corrente e la segneremo con una linea verticale dello stesso colore di quella del buffer dell'indicatore del simbolo.
L'identificazione delle barre "vere" è importante anche quando si sviluppano Expert Advisor perché se i parametri sono ottimizzati per un certo periodo di tempo, i dati di altri intervalli di tempo sarebbero in tal caso inappropriati.
Prima di eseguire i controlli di cui sopra, aggiungeremo il canvas alla sottofinestra dell'indicatore. Quindi prima dovremmo scrivere tutte le funzioni di cui avremo bisogno per gestire la tela. Prima di aggiungere l'area di lavoro alla sottofinefine, è necessario determinarne le dimensioni e le coordinate in base alle quali verranno visualizzati i messaggi di testo sulla finestra. A tale scopo, scriviamo una funzione GetSubwindowGeometry():
//+------------------------------------------------------------------+
//| Getting geometry of the indicator subwindow                      |
//+------------------------------------------------------------------+
void GetSubwindowGeometry()
  {
//--- Get the indicator subwindow number
   subwindow_number=ChartWindowFind(0,subwindow_shortname);
//--- Get the subwindow width and height
   chart_width=(int)ChartGetInteger(0,CHART_WIDTH_IN_PIXELS);
   subwindow_height=(int)ChartGetInteger(0,CHART_HEIGHT_IN_PIXELS,subwindow_number);
//--- Calculate the center of the subwindow
   subwindow_center_x=chart_width/2;
   subwindow_center_y=subwindow_height/2;
  }
Quando si ottengono le proprietà della sottofinefine, è possibile aggiungere l'area di disegno. Il suo sfondo sarà trasparente al 100%(opacità pari a 0), diventando visibile solo durante il caricamento e la generazione di dati per far sapere all'utente cosa sta succedendo attualmente. Quando visibile, l'opacità dello sfondo sarà uguale a 190. È possibile impostare il valore di opacità in un punto compreso tra 0 e 255. Per ulteriori informazioni, fare riferimento alla descrizione della funzione ColorToARGB() disponibile nella Guida .
Per impostare l'area di disegno, scriviamo una funzione SetCanvas():
//+------------------------------------------------------------------+
//| Setting canvas                                                   |
//+------------------------------------------------------------------+
void SetCanvas()
  {
//--- If there is no canvas, set it
   if(ObjectFind(0,canvas_name)<0)
     {
      //--- Create the canvas
      canvas.CreateBitmapLabel(0,subwindow_number,canvas_name,0,0,chart_width,subwindow_height,clr_format);
      //--- Make the canvas completely transparent
      canvas.Erase(ColorToARGB(canvas_background,0));
      //--- Redraw the canvas
      canvas.Update();
     }
  }
Avremo anche bisogno di una funzione che controlli se la sottofinestra dell'indicatore è stata ridimensionata. In tal caso, le dimensioni dell'area di lavoro verranno automaticamente regolate in base alle nuove dimensioni della sottofinela. Chiamiamo questa funzione OnSubwindowChange():
//+------------------------------------------------------------------+
//| Checking the subwindow size                                      |
//+------------------------------------------------------------------+
void OnSubwindowChange()
  {
//--- Get subwindow properties
   GetSubwindowGeometry();
//--- If the subwindow size has not changed, exit
   if(!SubwindowSizeChanged())
      return;
//--- If the subwindow height is less than one pixel or if the center has been calculated incorrectly, exit
   if(subwindow_height<1 || subwindow_center_y<1)
      return;
//--- Set the new canvas size
   ResizeCanvas();
//--- Show the last message
   ShowCanvasMessage(msg_last);
  }
Le funzioni evidenziate nel codice precedente possono essere esplorate di seguito. Si prega di notare i tipi di controlli che vengono eseguiti prima di ridimensionare la sottofinestra. Se una proprietà risulta errata, la funzione interrompe il suo funzionamento.
Il codice della funzione SubwindowSizeChanged() è il seguente:
//+------------------------------------------------------------------+
//| Checking if the subwindow has been resized                       |
//+------------------------------------------------------------------+
bool SubwindowSizeChanged()
  {
//--- If the subwindow size has not changed, exit
   if(last_chart_width==chart_width && last_subwindow_height==subwindow_height)
      return(false);
//--- If the size has changed, save it
   else
     {
      last_chart_width=chart_width;
      last_subwindow_height=subwindow_height;
     }
//---
   return(true);
  }
Il codice della funzione ResizeCanvas() è il seguente:
//+------------------------------------------------------------------+
//| Resizing canvas                                                  |
//+------------------------------------------------------------------+
void ResizeCanvas()
  {
//--- If the canvas has already been added to the indicator subwindow, set the new size
   if(ObjectFind(0,canvas_name)==subwindow_number)
      canvas.Resize(chart_width,subwindow_height);
  }
E infine, di seguito è riportato il codice della funzione ShowCanvasMessage () che abbiamo anche usato in precedenza quando abbiamo ottenuto le maniglie degli indicatori:
//+------------------------------------------------------------------+
//| Displaying message on the canvas                                 |
//+------------------------------------------------------------------+
void ShowCanvasMessage(string message_text)
  {
   GetSubwindowGeometry();
//--- If the canvas has already been added to the indicator subwindow
   if(ObjectFind(0,canvas_name)==subwindow_number)
     {
      //--- If the string passed is not empty and correct coordinates have been obtained, display the message
      if(message_text!="" && subwindow_center_x>0 && subwindow_center_y>0)
        {
         canvas.Erase(ColorToARGB(canvas_background,canvas_opacity));
         canvas.TextOut(subwindow_center_x,subwindow_center_y,message_text,ColorToARGB(clrRed),TA_CENTER|TA_VCENTER);
         canvas.Update();
        }
     }
  }
La tela verrà eliminata con effetto di scomparsa. Per implementarlo, prima di eliminare il canvas, dobbiamo modificare gradualmente l'opacità dal valore corrente a zero in un ciclo, aggiornando al contempo il canvas ad ogni iterazione.
Il codice della funzione DeleteCanvas() è il seguente:
//+------------------------------------------------------------------+
//| Deleting canvas                                                  |
//+------------------------------------------------------------------+
void DeleteCanvas()
  {
//--- Delete the canvas if it exists
   if(ObjectFind(0,canvas_name)>0)
     {
      //--- Before deleting, implement the disappearing effect
      for(int i=canvas_opacity; i>0; i-=5)
        {
         canvas.Erase(ColorToARGB(canvas_background,(uchar)i));
         canvas.Update();
        }
      //--- Delete the graphical resource
      canvas.Destroy();
     }
  }
Successivamente, diamo un'occhiata alle funzioni necessarie per verificare la prontezza dei dati prima di inserirli in buffer di indicatori e visualizzarli sul grafico. Iniziamo con la funzione LoadAndFormData(). Lo usiamo per confrontare la dimensione dell'array di simboli corrente con i dati disponibili per altri simboli. Se necessario, i dati vengono caricati dal server. Il codice funzione viene fornito con commenti dettagliati per la vostra considerazione.
//+------------------------------------------------------------------+
//| Loading and generating the necessary/available amount of data    |
//+------------------------------------------------------------------+
void LoadAndFormData()
  {
   int bars_count=100; // Number of loaded bars
//---
   for(int s=0; s<SYMBOLS_COUNT; s++)
     {
      int      attempts          =0;    // Counter of data copying attempts
      int      array_size        =0;    // Array size
      datetime firstdate_server  =NULL; // Time of the first bar on the server
      datetime firstdate_terminal=NULL; // Time of the first bar in the terminal base
      //--- Get the first date by the symbol/time frame in the terminal base
      SeriesInfoInteger(symbol_names[s],Period(),SERIES_FIRSTDATE,firstdate_terminal);
      //--- Get the first date of the symbol/time frame on the server
      SeriesInfoInteger(symbol_names[s],Period(),SERIES_SERVER_FIRSTDATE,firstdate_server);
      //--- Print the message
      msg_last=msg_load_data="Loading and generating data: "+
               symbol_names[s]+"("+(string)(s+1)+"/"+(string)SYMBOLS_COUNT+") ... ";
      ShowCanvasMessage(msg_load_data);
      //--- Load/generate data.
      //    If the array size is smaller than the maximum number of bars in the terminal, and if
      //    the number of bars between the first date of the series in the terminal and the first date of the series on the server is more than specified
      while(array_size<OC_rates_total &&
            firstdate_terminal-firstdate_server>PeriodSeconds()*bars_count)
        {
         datetime copied_time[];
         //--- Get the first date by the symbol/time frame in the terminal base
         SeriesInfoInteger(symbol_names[s],Period(),SERIES_FIRSTDATE,firstdate_terminal);
         //--- Load/copy the specified number of bars
         if(CopyTime(symbol_names[s],Period(),0,array_size+bars_count,copied_time)!=-1)
           {
            //--- If the time of the first bar in the array, excluding the number of the bars being loaded, is earlier
            //    than the time of the first bar in the chart, terminate the loop
            if(copied_time[0]-PeriodSeconds()*bars_count<OC_time[0])
               break;
            //--- If the array size hasn't increased, increase the counter
            if(ArraySize(copied_time)==array_size)
               attempts++;
            //--- Otherwise get the current size of the array
            else
               array_size=ArraySize(copied_time);
            //--- If the array size hasn't increased over 100 attempts, terminate the loop
            if(attempts==100)
              {
               attempts=0;
               break;
              }
           }
         //--- Check the subwindow size once every 2000 bars
         //    and if the size has changed, adjust the canvas size to it
         if(!(array_size%2000))
            OnSubwindowChange();
        }
     }
  }
Dopo il tentativo di caricare la quantità richiesta di dati, controlliamo ancora una volta le maniglie degli indicatori. A tale scopo, utilizziamo la funzione GetIndicatorHandles() considerata sopra.
Una volta che le maniglie sono state controllate, il programma verifica la disponibilità dei dati dei simboli specificati e dei valori degli indicatori per ciascun simbolo utilizzando la funzione CheckAvailableData(). Di seguito puoi dare un'occhiata più da vicino a come viene fatto:
//+------------------------------------------------------------------+
//| Checking the amount of available data for all symbols            |
//+------------------------------------------------------------------+
bool CheckAvailableData()
  {
   for(int s=0; s<SYMBOLS_COUNT; s++)
     {
      //--- If this symbol is available
      if(symbol_names[s]!=empty_symbol)
        {
         double   data[]; // Array for checking the amount of indicator data
         datetime time[]; // Array for checking the number of bars
         int      calculated_values =0;    // Amount of indicator data
         int      available_bars    =0;    // Number of bars of the current period
         datetime firstdate_terminal=NULL; // First date of the current time frame data available in the terminal
         //--- Get the number of calculated values of the indicator
         calculated_values=BarsCalculated(symbol_handles[s]);
         //--- Get the first date of the current time frame data in the terminal
         firstdate_terminal=(datetime)SeriesInfoInteger(symbol_names[s],Period(),SERIES_TERMINAL_FIRSTDATE);
         //--- Get the number of available bars from the date specified
         available_bars=Bars(symbol_names[s],Period(),firstdate_terminal,TimeCurrent());
         //--- Check the readiness of bar data: 5 attempts to get values
         for(int i=0; i<5; i++)
           {
            //--- Copy the specified amount of data
            if(CopyTime(symbol_names[s],Period(),0,available_bars,time)!=-1)
              {
               //--- If the required amount has been copied, terminate the loop
               if(ArraySize(time)>=available_bars)
                  break;
              }
           }
         //--- Check the readiness of indicator data: 5 attempts to get values
         for(int i=0; i<5; i++)
           {
            //--- Copy the specified amount of data
            if(CopyBuffer(symbol_handles[s],0,0,calculated_values,data)!=-1)
              {
               //--- If the required amount has been copied, terminate the loop
               if(ArraySize(data)>=calculated_values)
                  break;
              }
           }
         //--- If the amount of data copied is not sufficient, one more attempt is required
         if(ArraySize(time)<available_bars || ArraySize(data)<calculated_values)
           {
            msg_last=msg_prepare_data;
            ShowCanvasMessage(msg_prepare_data);
            OC_prev_calculated=0;
            return(false);
           }
        }
     }
//---
   return(true);
  }
La funzione CheckAvailableData() non consentirà di effettuare ulteriori calcoli fino a quando i dati per tutti i simboli non saranno pronti. Il funzionamento di tutte le funzioni di controllo segue uno schema simile.
La funzione successiva è necessaria per monitorare l'evento di caricamento di una cronologia più approfondita delle citazioni. Chiamiamolo CheckEventLoadHistory(). Se viene caricata una maggiore quantità di dati, l'indicatore deve essere completamente ricalcolato. Il codice sorgente di questa funzione è fornito di seguito:
//+------------------------------------------------------------------+
//| Checking the event of loading a deeper history                   |
//+------------------------------------------------------------------+
bool CheckLoadedHistory()
  {
   bool loaded=false;
//---
   for(int s=0; s<SYMBOLS_COUNT; s++)
     {
      //--- If this symbol is available
      if(symbol_names[s]!=empty_symbol)
        {
         //--- If the series need to be updated
         if(OC_prev_calculated==0)
           {
            //--- Get the first date by the symbol/time frame
            series_first_date[s]=(datetime)SeriesInfoInteger(symbol_names[s],Period(),SERIES_FIRSTDATE);
            //--- If this is the first time (no value is available), then
            if(series_first_date_last[s]==NULL)
               //--- Store the first date by the symbol/time frame for further comparison
               //    in order to determine if a deeper history has been loaded
               series_first_date_last[s]=series_first_date[s];
           }
         else
           {
            //--- Get the first date by the symbol/time frame
            series_first_date[s]=(datetime)SeriesInfoInteger(symbol_names[s],Period(),SERIES_FIRSTDATE);
            //--- If the dates are different, i.e. the date in the memory is later than the one we have just obtained,
            //     this means that a deeper history has been loaded
            if(series_first_date_last[s]>series_first_date[s])
              {
               //--- Print the relevant message to the log
               Print("(",symbol_names[s],",",TimeframeToString(Period()),
                     ") > A deeper history has been loaded/generated: ",
                     series_first_date_last[s]," > ",series_first_date[s]);
               //--- Store the date
               series_first_date_last[s]=series_first_date[s];
               loaded=true;
              }
           }
        }
     }
//--- If a deeper history has been loaded/generated, then
//    send the command to refresh the plotting series of the indicator
   if(loaded)
      return(false);
//---
   return(true);
  }
Scriviamo un'altra funzione per verificare la sincronizzazione tra i dati nel terminale e sul server. Questo controllo verrà eseguito solo se viene stabilita la connessione al server. Il codice della funzione CheckSymbolIsSynchronized() è fornito di seguito:
//+------------------------------------------------------------------+
//| Checking synchronization by symbol/time frame                    |
//+------------------------------------------------------------------+
bool CheckSymbolIsSynchronized()
  {
//--- If the connection to the server is established, check the data synchronization
   if(TerminalInfoInteger(TERMINAL_CONNECTED))
     {
      for(int s=0; s<SYMBOLS_COUNT; s++)
        {
         //--- If the symbol is available
         if(symbol_names[s]!=empty_symbol)
           {
            //--- If the data are not synchronized, print the relevant message and try again
            if(!SeriesInfoInteger(symbol_names[s],Period(),SERIES_SYNCHRONIZED))
              {
               msg_last=msg_not_synchronized;
               ShowCanvasMessage(msg_not_synchronized);
               return(false);
              }
           }
        }
     }
//---
   return(true);
  }
La funzione per la conversione dell'intervallo di tempo in una stringa sarà presa da articoli precedenti della serie "MQL5 Cookbook":
//+------------------------------------------------------------------+
//| Converting time frame to a string                                |
//+------------------------------------------------------------------+
string TimeframeToString(ENUM_TIMEFRAMES timeframe)
  {
   string str="";
//--- If the value passed is incorrect, take the current chart time frame
   if(timeframe==WRONG_VALUE || timeframe== NULL)
      timeframe= Period();
   switch(timeframe)
     {
      case PERIOD_M1  : str="M1";  break;
      case PERIOD_M2  : str="M2";  break;
      case PERIOD_M3  : str="M3";  break;
      case PERIOD_M4  : str="M4";  break;
      case PERIOD_M5  : str="M5";  break;
      case PERIOD_M6  : str="M6";  break;
      case PERIOD_M10 : str="M10"; break;
      case PERIOD_M12 : str="M12"; break;
      case PERIOD_M15 : str="M15"; break;
      case PERIOD_M20 : str="M20"; break;
      case PERIOD_M30 : str="M30"; break;
      case PERIOD_H1  : str="H1";  break;
      case PERIOD_H2  : str="H2";  break;
      case PERIOD_H3  : str="H3";  break;
      case PERIOD_H4  : str="H4";  break;
      case PERIOD_H6  : str="H6";  break;
      case PERIOD_H8  : str="H8";  break;
      case PERIOD_H12 : str="H12"; break;
      case PERIOD_D1  : str="D1";  break;
      case PERIOD_W1  : str="W1";  break;
      case PERIOD_MN1 : str="MN1"; break;
     }
//---
   return(str);
  }
Infine, dobbiamo identificare e salvare la prima vera barra per ogni simbolo contrassegnandola nel grafico con una linea verticale. Per fare ciò, scriviamo una funzione DetermineFirstTrueBar() e una funzione ausiliaria GetFirstTrueBarTime() che restituisce l'ora della prima barra true.
//+-----------------------------------------------------------------------+
//| Determining the time of the first true bar for the purpose of drawing |
//+-----------------------------------------------------------------------+
bool DetermineFirstTrueBar()
  {
   for(int s=0; s<SYMBOLS_COUNT; s++)
     {
      datetime time[];           // Bar time array
      int      available_bars=0; // Number of bars
      //--- If this symbol is not available, move to the next one
      if(symbol_names[s]==empty_symbol)
         continue;
      //--- Get the total number of bars for the symbol
      available_bars=Bars(symbol_names[s],Period());
      //--- Copy the bar time array. If this action failed, try again.
      if(CopyTime(symbol_names[s],Period(),0,available_bars,time)<available_bars)
         return(false);
      //--- Get the time of the first true bar corresponding to the current time frame
      limit_time[s]=GetFirstTrueBarTime(time);
      //--- Place a vertical line on the true bar
      CreateVerticalLine(0,0,limit_time[s],prefix+symbol_names[s]+": begin time series",
                          2,STYLE_SOLID,line_colors[s],false,TimeToString(limit_time[s]),"\n");
     }
//---
   return(true);
  }
//+-----------------------------------------------------------------------+
//| Returning the time of the first true bar of the current time frame    |
//+-----------------------------------------------------------------------+
datetime GetFirstTrueBarTime(datetime &time[])
  {
   datetime true_period =NULL; // Time of the first true bar
   int      array_size  =0;    // Array size
//--- Get the array size
   array_size=ArraySize(time);
   ArraySetAsSeries(time,false);
//--- Check each bar one by one
   for(int i=1; i<array_size; i++)
     {
      //--- If the bar corresponds to the current time frame
      if(time[i]-time[i-1]==PeriodSeconds())
        {
         //--- Save it and terminate the loop
         true_period=time[i];
         break;
        }
     }
//--- Return the time of the first true bar
   return(true_period);
  }
L'ora della prima barra reale è contrassegnata nel grafico con una linea verticale utilizzando la funzione CreateVerticalLine():
//+------------------------------------------------------------------+
//| Creating a vertical line at the specified time point             |
//+------------------------------------------------------------------+
void CreateVerticalLine(long            chart_id,           // chart id
                        int             window_number,      // window number
                        datetime        time,               // time
                        string          object_name,        // object name
                        int             line_width,         // line width
                        ENUM_LINE_STYLE line_style,         // line style
                        color           line_color,         // line color
                        bool            selectable,         // cannot select the object if FALSE
                        string          description_text,   // text of the description
                        string          tooltip)            // no tooltip if "\n"
  {
//--- If the object has been created successfully
   if(ObjectCreate(chart_id,object_name,OBJ_VLINE,window_number,time,0))
     {
      //--- set its properties
      ObjectSetInteger(chart_id,object_name,OBJPROP_TIME,time);
      ObjectSetInteger(chart_id,object_name,OBJPROP_SELECTABLE,selectable);
      ObjectSetInteger(chart_id,object_name,OBJPROP_STYLE,line_style);
      ObjectSetInteger(chart_id,object_name,OBJPROP_WIDTH,line_width);
      ObjectSetInteger(chart_id,object_name,OBJPROP_COLOR,line_color);
      ObjectSetString(chart_id,object_name,OBJPROP_TEXT,description_text);
      ObjectSetString(chart_id,object_name,OBJPROP_TOOLTIP,tooltip);
     }
  }
Le funzioni di controllo sono pronte. Di conseguenza, la parte delle OnCalculate() quando la variabile prev_calculated è uguale a zero verrà ora visualizzata come illustrato di seguito:
//--- If this is the first calculation or if a deeper history has been loaded or gaps in the history have been filled
   if(prev_calculated==0)
     {
      //--- Zero out arrays for data preparation
      ZeroCalculatedArrays();
      //--- Zero out indicator buffers
      ZeroIndicatorBuffers();
      //--- Get subwindow properties
      GetSubwindowGeometry();
      //--- Add the canvas
      SetCanvas();
      //--- Load and generate the necessary/available amount of data
      LoadAndFormData();
      //--- If there is an invalid handle, try to get it again
      if(!GetIndicatorHandles())
         return(RESET);
      //--- Check the amount of data available for all symbols
      if(!CheckAvailableData())
         return(RESET);
      //--- Check if a deeper history has been loaded
      if(!CheckLoadedHistory())
         return(RESET);
      //--- Check synchronization by symbol/time frame at the current moment
      if(!CheckSymbolIsSynchronized())
         return(RESET);
      //--- For each symbol, determine the bar from which we should start drawing
      if(!DetermineFirstTrueBar())
         return(RESET);
      //--- If you reached this point, it means that OnCalculate() will return non-zero value and this needs to be saved
      OC_prev_calculated=rates_total;
     }
Ora, ogni volta che un certo controllo fallisce, il programma farà un passo indietro per fare un altro tentativo al prossimo segno di spunta o evento timer. Nel timer, dovremmo anche eseguire il controllo per caricare una cronologia più approfondita al di fuori delle funzioni di OnCalculateOnCalculate() funzione:
//+------------------------------------------------------------------+
//| Timer function                                                   |
//+------------------------------------------------------------------+
void OnTimer()
  {
//--- If a deeper history has been loaded
   if(!CheckLoadedHistory())
      OC_prev_calculated=0;
//--- If for some reason calculations have not been completed or
//    a deeper history has been loaded or
//    gaps in the history have been filled,
//    then make another attempt without waiting for the new tick
   if(OC_prev_calculated==0)
     {
      OnCalculate(OC_rates_total,OC_prev_calculated,
                  OC_time,OC_open,OC_high,OC_low,OC_close,
                  OC_tick_volume,OC_volume,OC_spread);
     }
  }
Ora abbiamo solo bisogno di scrivere due loop principali da inserire nelle funzioni di gestione degli OnCalculate() funzione:
- Il primo ciclo preparerà i dati in base al principio di "ottenere il valore a tutti i costi" per evitare lacune nelle serie di indicatori. L'idea alla base è semplice: un determinato numero di tentativi verrà effettuato in caso di mancato ottenimento del valore. In questo ciclo, i valori temporali dei simboli e dei valori dell'indicatore di volatilità (ATR) verranno salvati in matrici separate.
- Nel secondo ciclo principale, quando si riempiono i buffer degli indicatori, saranno necessarie matrici temporali di altri simboli per il confronto con l'ora del simbolo corrente e la sincronizzazione di tutte le serie di plottaggio.
Il codice del primo ciclo è fornito di seguito:
//--- Prepare data for drawing
   for(int s=0; s<SYMBOLS_COUNT; s++)
     {
      //--- If the symbol is available
      if(symbol_names[s]!=empty_symbol)
        {
         double percent=0.0; // For the purpose of calculating the progress percentage
         msg_last=msg_sync_update="Preparing data ("+IntegerToString(rates_total)+" bars) : "+
                      symbol_names[s]+"("+(string)(s+1)+"/"+(string)(SYMBOLS_COUNT)+") - 00% ... ";
         //--- Print the message
         ShowCanvasMessage(msg_sync_update);
         //--- Control every value of the array
         for(int i=limit; i<rates_total; i++)
           {
            PrepareData(i,s,time);
            //--- Refresh the message once every 1000 bars
            if(i%1000==0)
              {
               //--- Progress percentage
               ProgressPercentage(i,s,percent);
               //--- Print the message
               ShowCanvasMessage(msg_sync_update);
              }
            //--- Check the subwindow size once every 2000 bars
            //    and if the size has changed, adjust the canvas size to it
            if(i%2000==0)
               OnSubwindowChange();
           }
        }
     }
La funzione principale per la copia e il salvataggio dei valori, PrepareData(), è evidenziata nel codice precedente. C'è anche una nuova funzione che non è stata ancora presa in considerazione - ProgressPercentage(). Calcola la percentuale di avanzamento dell'operazione corrente per far sapere all'utente quanto durerà.
Il codice della funzione PrepareData() è il seguente:
//+------------------------------------------------------------------+
//| Preparing data before drawing                                    |
//+------------------------------------------------------------------+
void PrepareData(int bar_index,int symbol_number,datetime const &time[])
  {
   int attempts=100; // Number of copying attempts
//--- Time of the bar of the specified symbol and time frame
   datetime symbol_time[];
//--- Array for copying indicator values
   double atr_values[];
//--- If within the area of the current time frame bars
   if(time[bar_index]>=limit_time[symbol_number])
     {
      //--- Copy the time
      for(int i=0; i<attempts; i++)
        {
         if(CopyTime(symbol_names[symbol_number],0,time[bar_index],1,symbol_time)==1)
           {
            tmp_symbol_time[symbol_number].time[bar_index]=symbol_time[0];
            break;
           }
        }
      //--- Copy the indicator value
      for(int i=0; i<attempts; i++)
        {
         if(CopyBuffer(symbol_handles[symbol_number],0,time[bar_index],1,atr_values)==1)
           {
            tmp_atr_values[symbol_number].value[bar_index]=atr_values[0];
            break;
           }
        }
     }
//--- If outside the area of the current time frame bars, set an empty value
   else
      tmp_atr_values[symbol_number].value[bar_index]=EMPTY_VALUE;
  }
Il codice della funzione ProgressPercentage() è il seguente:
//+------------------------------------------------------------------+
//| Calculating progress percentage                                  |
//+------------------------------------------------------------------+
void ProgressPercentage(int bar_index,int symbol_number,double &percent)
  {
   string message_text="";
   percent=(double(bar_index)/OC_rates_total)*100;
//---
   if(percent<=9.99)
      message_text="0"+DoubleToString(percent,0);
   else if(percent<99)
      message_text=DoubleToString(percent,0);
   else
      message_text="100";
//---
   msg_last=msg_sync_update="Preparing data ("+(string)OC_rates_total+" bars) : "+
            symbol_names[symbol_number]+
            "("+(string)(symbol_number+1)+"/"+(string)SYMBOLS_COUNT+") - "+message_text+"% ... ";
  }
I buffer degli indicatori vengono compilati nel secondo ciclo principale delle funzioni di oncalcola() funzione:
//--- Fill indicator buffers
   for(int s=0; s<SYMBOLS_COUNT; s++)
     {
      //--- If the specified symbol does not exist, zero out the buffer
      if(symbol_names[s]==empty_symbol)
         ArrayInitialize(atr_buffers[s].data,EMPTY_VALUE);
      else
        {
         //--- Generate a message
         msg_last=msg_sync_update="Updating indicator data: "+
                      symbol_names[s]+"("+(string)(s+1)+"/"+(string)SYMBOLS_COUNT+") ... ";
         //--- Print the message
         ShowCanvasMessage(msg_sync_update);
         //--- Fill indicator buffers with values
         for(int i=limit; i<rates_total; i++)
           {
            FillIndicatorBuffers(i,s,time);
            //--- Check the subwindow size once every 2000 bars
            //    and if the size has changed, adjust the canvas size to it
            if(i%2000==0)
               OnSubwindowChange();
           }
        }
     }
La stringa evidenziata nel codice precedente contiene la funzione FillIndicatorBuffers(). È qui che vengono eseguite le operazioni finali prima di visualizzare le serie di plottaggio dell'indicatore nel grafico:
//+------------------------------------------------------------------+
//| Filling indicator buffers                                        |
//+------------------------------------------------------------------+
void FillIndicatorBuffers(int bar_index,int symbol_number,datetime const &time[])
  {
//--- For the purpose of checking the obtained indicator value
   bool check_value=false;
//--- Counter of the current time frame bars
   static int bars_count=0;
//--- Zero out the counter of the current time frame bars at the beginning of the symbol's time series
   if(bar_index==0)
      bars_count=0;
//--- If within the area of current time frame bars and the counter is smaller
//    than the specified indicator period, increase the counter
   if(bars_count<IndicatorPeriod && time[bar_index]>=limit_time[symbol_number])
      bars_count++;
//--- If within the indicator area and the time of the current symbol coincides with the time of the specified symbol
   if(bars_count>=IndicatorPeriod &&
      time[bar_index]==tmp_symbol_time[symbol_number].time[bar_index])
     {
      //--- If the value obtained is not empty
      if(tmp_atr_values[symbol_number].value[bar_index]!=EMPTY_VALUE)
        {
         check_value=true;
         atr_buffers[symbol_number].data[bar_index]=tmp_atr_values[symbol_number].value[bar_index];
        }
     }
//--- Set an empty value in case of failure to set a higher value
   if(!check_value)
      atr_buffers[symbol_number].data[bar_index]=EMPTY_VALUE;
  }
Al termine delle funzioni di OnCalculate() funzione, dobbiamo eliminare il canvas, impostare i livelli, azzerare le variabili dei messaggi e aggiornare il grafico. Infine, verrà restituita la dimensione della matrice rates_total, a seguito della quale verrà ricalcolato solo l'ultimo valore ad ogni successivo tick o evento timer in OnCalculate().
Queste sono le stringhe di codice da inserire tra il secondo loop principale e il valore restituito dalla funzione:
//--- Delete the canvas
   DeleteCanvas();
//--- Set indicator levels
   SetIndicatorLevels();
//--- Zero out variables
   msg_last="";
   msg_sync_update="";
//--- Refresh the chart
   ChartRedraw();
Il codice della funzione SetIndicatorLevels() per l'impostazione dei livelli orizzontali è il seguente:
//+------------------------------------------------------------------------+
//| Setting indicator levels                                               |
//+------------------------------------------------------------------------+
void SetIndicatorLevels()
  {
//--- Get the indicator subwindow number
   subwindow_number=ChartWindowFind(0,subwindow_shortname);
//--- Set levels
   for(int i=0; i<LEVELS_COUNT; i++)
      CreateHorizontalLine(0,subwindow_number,
                            prefix+"level_0"+(string)(i+1)+"",
                            CorrectValueBySymbolDigits(indicator_levels[i]*_Point),
                            1,STYLE_DOT,clrLightSteelBlue,false,false,false,"\n");
  }
//+------------------------------------------------------------------------+
//| Adjusting the value based on the number of digits in the price (double)|
//+------------------------------------------------------------------------+
double CorrectValueBySymbolDigits(double value)
  {
   return(_Digits==3 || _Digits==5) ? value*=10 : value;
  }
Il codice della funzione CreateHorizontalLine() per l'impostazione di un livello orizzontale con le proprietà specificate è il seguente:
//+------------------------------------------------------------------+
//| Creating a horizontal line at the price level specified          |
//+------------------------------------------------------------------+
void CreateHorizontalLine(long            chart_id,      // chart id
                          int             window_number, // window number
                          string          object_name,   // object name
                          double          price,         // price level
                          int             line_width,    // line width
                          ENUM_LINE_STYLE line_style,    // line style
                          color           line_color,    // line color
                          bool            selectable,    // cannot select the object if FALSE
                          bool            selected,      // line is selected
                          bool            back,          // background position
                          string          tooltip)       // no tooltip if "\n"
  {
//--- If the object has been created successfully
   if(ObjectCreate(chart_id,object_name,OBJ_HLINE,window_number,0,price))
     {
      //--- set its properties
      ObjectSetInteger(chart_id,object_name,OBJPROP_SELECTABLE,selectable);
      ObjectSetInteger(chart_id,object_name,OBJPROP_SELECTED,selected);
      ObjectSetInteger(chart_id,object_name,OBJPROP_BACK,back);
      ObjectSetInteger(chart_id,object_name,OBJPROP_STYLE,line_style);
      ObjectSetInteger(chart_id,object_name,OBJPROP_WIDTH,line_width);
      ObjectSetInteger(chart_id,object_name,OBJPROP_COLOR,line_color);
      ObjectSetString(chart_id,object_name,OBJPROP_TOOLTIP,tooltip);
     }
  }
Funzioni per l'eliminazione di oggetti grafici:
//+------------------------------------------------------------------+
//| Deleting levels                                                  |
//+------------------------------------------------------------------+
void DeleteLevels()
  {
   for(int i=0; i<LEVELS_COUNT; i++)
      DeleteObjectByName(prefix+"level_0"+(string)(i+1)+"");
  }
//+------------------------------------------------------------------+
//| Deleting vertical lines of the beginning of the series           |
//+------------------------------------------------------------------+
void DeleteVerticalLines()
  {
   for(int s=0; s<SYMBOLS_COUNT; s++)
      DeleteObjectByName(prefix+symbol_names[s]+": begin time series");
  }
//+------------------------------------------------------------------+
//| Deleting the object by name                                      |
//+------------------------------------------------------------------+
void DeleteObjectByName(string object_name)
  {
//--- If such object exists
   if(ObjectFind(0,object_name)>=0)
     {
      //--- If an error occurred when deleting, print the relevant message
      if(!ObjectDelete(0,object_name))
         Print("Error ("+IntegerToString(GetLastError())+") when deleting the object!");
     }
  }
Il codice seguente deve essere aggiunto alle OnDeinit() function:
Ora tutto è pronto e può essere testato a fondo. Il numero massimo di barre nella finestra può essere impostato nella scheda Grafici delle impostazioni del terminale. La velocità con cui l'indicatore sarà pronto per l'esecuzione dipende dal numero di barre nella finestra.

Fig. 1. Impostazione del numero massimo di barre nelle impostazioni del terminale
Quando si carica l'indicatore sul grafico, è possibile vedere l'avanzamento della preparazione dei dati per tutti i simboli:

Fig. 2. Messaggio nell'area di disegno durante la preparazione dei dati
Di seguito puoi vedere lo screenshot che mostra l'indicatore in un intervallo di tempo di 20 minuti:

Fig. 3. Indicatore ATR multi-simbolo su un intervallo di tempo di 20 minuti
L'inizio delle barre "true" è contrassegnato nel grafico con le linee verticali. Lo screenshot qui sotto mostra che le barre vere per NZDUSD (linea gialla) iniziano dal 2000 (server MetaQuotes-Demo), mentre per tutte le altre coppie di valute le barre vere appaiono all'inizio del 1999, motivo per cui viene visualizzata solo una riga (tutte sono nella stessa data). Possiamo anche notare che i separatori di periodo hanno un intervallo più piccolo prima del 1999 e se analizzi il tempo delle barre, sarai in grado di vedere che si tratta di barre giornaliere.
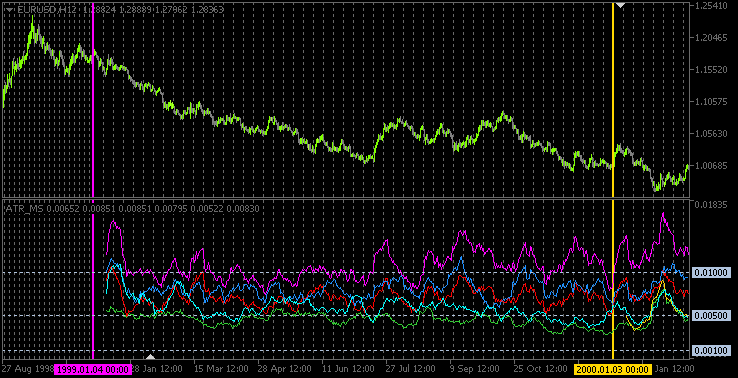
Fig. 4. Le linee verticali segnano l'inizio delle barre vere per ogni simbolo
Conclusione
L'articolo può essere finito qui. Il codice sorgente descritto è allegato all'articolo ed è disponibile per il download. In uno dei prossimi articoli, cercheremo di implementare un sistema di trading che analizzi la volatilità e veda cosa ne esce.
Tradotto dal russo da MetaQuotes Ltd.
Articolo originale: https://www.mql5.com/ru/articles/752
 Creazione di un Multi-Currency Multi-System Expert Advisor
- App di trading gratuite
- Oltre 8.000 segnali per il copy trading
- Notizie economiche per esplorare i mercati finanziari
Accetti la politica del sito e le condizioni d’uso