• 미리보기
  • 리뷰
  • 코멘트

Higher Timeframe TDEV

Aligning higher time frames for trading

One of the main concepts behind the beginner strategy is multiple time frame analysis – using a higher time frame to determine the overall market direction and executing trades on a lower time frame.

By determining the overall direction on a higher time frame and trading in that direction, you make sure that you trade in the direction of the overall trend – this increases your chances of profitable trades. In the beginner strategy, you use the 30 minute chart as the higher time frame, however, you can go a step further and also use the 4 hour time frame to assess an even larger picture.

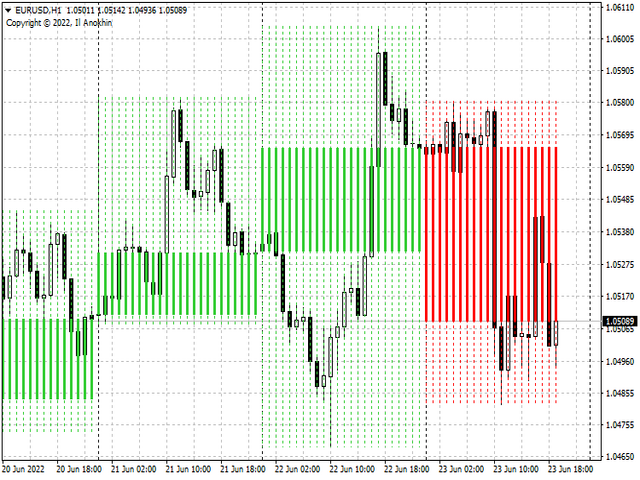
The following shows how to determine if the 4 hour chart and the 30 minute chart show the same market direction.

To align two higher time frames, you start at the highest time frame and then work down. So first switch to the 4 hour time frame and use the same rules as determining the market direction on the 30 minute chart.

You look for the last break of an up fractal and the last break of a down fractal. If the last fractal break was of an up fractal, then the direction is up on the 4 hour chart. Similarly, if the last break was of a down fractal, then the market direction is down on the 4 hour chart.

You can see this demonstrated on the chart below. The last break of a fractal was an up fractal and so the direction on the four hour chart is up.


추천 제품
TSScreenCrossMovAvg
Salvatore Labriola
indicator for trading with the strategy with two moving averages. Intelligent algorithm for scalper and intraday traders. Multi time frame and multi currency panel.   The benefits you get :   Easy to use panel that alerts you to crossings of moving averages, as per strategy, on each currency. Possibility to choose your favorite crosses. Possibility to choose to activate only the preferred time frames. Never redesigns, does not retreat, never recalculates. Works on forex and CFD, timeframe from M
PTW NON REPAINT TRADING SYSTEM + HISTOGRAM Non-Repainting ,   Non-Redrawing   and   Non-Lagging  Trading System. Does the following: - Gives Accurate Entry and Exit Points - Scalping, Day and Swing Trading  - 95% Accuracy  - Targets, where to take profits. - Shows Trends, Support and resistance levels - Works on All Brokers - Works on All Currencies, CFDs and Stocks - It does not place trades for you, it only shows you what trades to place. - It works on All Timeframes - It is for Trend or ra
**바이너리 스마트 시스템 소개: 귀하의 궁극적인 트레이딩 파트너** 바이너리 스마트 시스템은 단순히 인디케이터가 아닙니다. 이는 정교한 트레이딩 도구로, 다양한 시장에서 핀포인트 정확도와 적시의 신호를 제공하여 트레이더에게 성공을 이끌어주는 데 주안점을 둔 것입니다. 혁신적인 알고리즘과 다양한 기술적 지표의 철저한 컬렉션을 기반으로 구축된 이 시스템은 트레이딩 성공을 얻기 위한 열쇠입니다. **인디케이터 구성 요소:** 1. **이동 평균 비율 (MAP):** 이 구성 요소는 다양한 이동 평균의 가중 평균을 계산하여 추세 식별을 위한 강력한 기준을 형성합니다. MAP은 시장 상황에 동적으로 적응하여 현재 추세 방향을 파악하는 정보를 제공합니다. 2. **상품 채널 지수 (CCI):** 평균 가격으로부터의 편차를 분석함으로써 CCI는 과매수 및 과매도 조건을 판단합니다. 바이너리 스마트 시스템의 CCI 통합은 잠재적인 반전 지점을 식별하는 종합적인 접근을 보장합니다.
This Indicator is use the ZigZag to calculate the Upper and  Lower Bound and the uptrend and the downtrned. Red for downtrend, Green for uptrend and Yellow is for the horizontal trend this horizontal trend also bookmarked the upper limited and the lower limited the the price swings.  Or in simple the Support and the Resistance level. However, You may use the Heikin Ashi to confirm the trend of the buy sell signal above. I cannot guarantee the win rate, Nevertheless, you must study well the timef
Candlestick Patterns Scanner MT4
KEENBASE SOFTWARE SOLUTIONS
KT Candlestick Patterns Scanner is a Multi-Symbol and Multi-Timeframe scanner that fetches and shows various candlestick patterns on 28 currency pairs and 9 time-frames concurrently . The scanner finds the candlestick patterns by loading the KT Candlestick Patterns indicator as a resource in the background. Features The scanner can find the candlestick patterns on 252* combinations of symbols and time-frames from a single chart. Open the signal's chart loaded with a predefined template with
TSScreenBowTie
Salvatore Labriola
Expert for trading with the BowTie strategy. Intelligent algorithm for scalper and intraday traders. Multi time frame and multi currency panel.   The benefits you get: Easy-to-use panel that alerts you to crossings of moving averages, like strategy, on each currency. Possibility to choose your favorite crosses. Possibility to choose to activate only the preferred time frames. Never redesigns, does not retreat, never recalculates. Works on forex and CFD, timeframe from M5 to D1. Integrated pop-up
Reversal Trend
Claus Dietrich
Arrows appear after Reversal-Pattern and when the confirmation-candle reaches its value, it won't disappear (no repaint). but with fix settings no additional settings necessary Entry : immediately after arrow Stop loss : a few pips above the high of the arrow - candle / below the low of the arrow - candle Take Profit : at least the next candle / move to break even after candle closed / trail the SL works on : Major Forex-pairs / M15 and higher time-frames The Value of the  confirmation-candle =>
Renko Star
Abdulkarim Karazon
Renko Star는 렌코 차트를 거래하도록 설계된 mt4 화살표 유형 지표입니다. 이 지표에는 거래자에게 승률 및 승리 포인트와 같은 유용한 정보를 알려주는 백테스팅 대시보드가 ​​있으며 atr x 곱셈에서 tp 및 sl도 제공합니다. 바 오픈 또는 인트라 바에 신호가 있고 신호가 제공된 정확한 가격을 표시하는 노란색 표시가 있습니다. 이 표시기를 사용하는 방법은 표시기에 의해 제공된 화살표에 따라 매수 또는 매도를 개시하고 tp를 설정하는 것입니다. 그리고 표시기에 의해 제공된 대로 표시기 설정을 가지고 놀면 더 좋거나 최악의 결과가 나올 수 있으므로 신뢰할 수 있는 대시보드에서 좋은 결과를 얻을 때까지 설정을 변경해야 합니다. 이 표시기는 다시 칠하거나 다시 칠하지 않습니다. 매개변수: atr tp : atr을 기준으로 한 tp 값 atr sl : atr을 기반으로 한 sl 값 atr 기간 별 기간 스타 필터 History : 백테스트할 히스토리의 양 Spread :
MartingaleArrow
Abdulkarim Karazon
Martingale Arrow는 martingale 바이너리 옵션 거래를 위해 설계된 화살표 유형 mt4 표시기입니다. 이 화살표는 바 열기/인트라 바에 인쇄되고 경고를 제공합니다. 사용 방법: 화살표가 나타나는 순간 거래를 개시하세요. 거래가 성공했다면 다음 신호를 기다렸다가 동일한 로트를 거래하세요. 다음 신호에서 거래가 두 배의 로트를 잃고 신호가 승리할 때까지 계속 그렇게 하는 경우 재설정하고 첫 번째 거래 로트로 거래하세요. 권장 기간: 모두 최소 보증금 : 200 단위. 이 표시기 라이브는 다음을 수행하지 않습니다: 다시 칠하기/뒤로 칠하기 ------------------------------------- ------------- 매개변수: 표시 기간: 변경 시 다른 신호를 제공합니다. 지표 가격/유형 과매수/과매도 수준 경고 입력 화살표 스타일 ==========================================
The basis of the indicator is based on my trading strategy, according to which I trade daily. I automated my system so that it would learn on the market independently. The indicator will not show transactions on the history of the chart, since all calculations of the trading system are in real time. Differences from other indicators: Real time calculations Dynamic Take Profits Dynamic Signals Trend Signals Ideal for beginners Any Currency Pair Any TimeFrame Suitable for scalping To
Bonosu Pr
Anthonius Soruh
Bonsosu P is Binary indicator for binary option trade highly winrate and highly return ........... Design for full auto trade with bot or connetor from MT4 to Binary Broker ...____ Easy to use, No repaint,,, ___  Time frame M1 only, ..... ___  Work with 28 forex pair without martingale, ....__  Support all binary broker, ....__ Trading with experation ..... __
ATC AlgoZone Indicator
Ameur Boudenne
5 (2)
Algo Trading Indicaor  With this indicator , you’ll have zones and trends that hight probability the price will reverse from it. so will gives you all the help that you need  Why should you join us !?  1-This indicator is logical since it’s working in previous days movement , to predict the future movements. 2-Algo trading indicator will help you to draw trends which is special and are too strong than the basics trend , trends will change with the frame time that you work on . 3-We can
Ideal Pips
Yaroslav Varankin
Reliable Tool for the Financial Market This tool delivers high-performance results in trading on financial markets. Advantages: Fast and Accurate Signals: The arrow signals of this tool are easily and accurately analyzed, providing quality signals that you can rely on. No Repainting: This tool does not have any repainting, ensuring reliable trading signals. Quality Guarantee: If any signal repainting is detected, which we cannot correct, we will refund your money without commission. Recommendat
This indicator is created by considering volume divergence with price that is outcome of Bollinger band and Envolpes indicators crossing. It won’t repaint.  It is providing 1 market and three pending orders.  If it is followed with patient, it is providing remarkable profit at the end.  This indicator will be on sale soon on expert advisor. Target is calculated for buy orders as follow 1. 50 pips standard 2. Top Bollinger band 3. Sell Signal Target is calculated for buy orders as follow 1. 50
Calculated
Vitalii Zakharuk
Calculated trend indicator, can be used with an optimal risk to profit ratio, shows successful signals. Uses two options for settings. Shows favorable moments for entering the market with arrows. The probability of a successful trend is not very bad! The indicator can be used both for pipsing on small periods, and for long-term trading. The indicator does not redraw and does not lag. It works on all currency pairs and on all timeframes.
Precautions for subscribing to indicator This indicator only supports the computer version of MT4 Does not support MT5, mobile phones, tablets The indicator only shows the day's entry arrow The previous history arrow will not be displayed (Live broadcast is for demonstration) The indicator is a trading aid Is not a EA automatic trading No copy trading function The indicator only indicates the entry position No exit (target profit)  The entry stop loss point is set at 30-50 PIPS Or the front
BonosuAttack
Anthonius Soruh
Bonsosu attack is Binary indicator for binary option trade highly winrate and highly return ........... Design for full auto trade with bot or connetor from MT4 to Binary Broker ...____ Easy to use, No repaint,,, ___  Time frame M1 only, ..... ___  Work with 28 forex pair without martingale, ....__  Support all binary broker, .... Trading with experation ..... 
This Scanner scans moving average(MA) line across multi-currency pairs and multi-time frames and shows all the result in  the dashboard. 1. Current bar is about to cross up the MA line - designated as "Xup". 2. Current bar is about to cross down the MA line - designated as "Xdn". 3. Previous bar that has just crossed up and closed the MA line - designated as "UP". 4. Previous bar that has just crossed down  and closed the MA line - designated as "DN". Input parameters can be changed: MA, dashboa
FFXMV Dashboard Plus
Opengates Success International
Full Forex Market View Dashboard Plus This is a custom indicator created to give Traders a full view of what is going on in the market. It uses a real time data to access the market and display every bit of information needed to make successful trading. The PLUS there to produce the kind of RESULTS as you see in the SCREENSHOTS, I added a MultipleOrder Utility EA with it with instructions on how to use it with FFXMV Dashboard. INSTALLATION : Read the MANUALS that comes with the rest of the
Platinum FX
Dmitriy Kashevich
Platinum FX индикатор для скальпинга. идеально подходит для торговли бинарными опционами. работает на всех валютных парах мультитаймфреймовый. когда появляемся красная стрелка мы покупаем когда появляемся красная мы продаем. он должен был достичь успеха в трейдинге. Полное отсутствие перерисовки. Точность сигнала. точность данного инструмента можете увидеть в тестере Всем удачных торгов By Lilyyy
This is  a dashboard indicator that displays the Average Level of each selected currency pairs that filters and gives us a signal for overbought (>=90%) or if price at extreme peak above 90, and/or oversold (<=10%) or if price at extreme peak below 10. The calculation is using Relative Strength Index default periods (2 & 9) applied to three different higher time frames H4,D1,&W1. This won't change or altered even if you change symbol or switch to lower time frames or even in monthly and y
Forex 28 Pair Scanner
Federico Quintieri
The Forex   S canner  I ndicator is a tool that helps traders   identify   and   analyze   9 different strategy signals  in   28 different Forex Markets. This way you can find potentially   profitable   trades on almost every currency exchange. What It Does? Scan   all 28 Forex Pairs at the current timeframe   to   find the signal. Color the button Green/Red/Yellow it finds the condition. Clicking   on the button instantly   changes   the market. How To Use It? Select the signal condition th
FREE
Max Volume
Maksim Slovakov
Подкрашивает аномально большие тиковые объёмы в красный цвет. Имеет следующие настройки: "Процент" по умолчанию "70"  (Процент на который аномальный объём должен быть больше предыдущего) "Уровень" по умолчанию "500" (Количество тиков, больше которого будем брать во внимание аномальный объём) Внимание! Данный индикатор был разработан для мелких таймфреймов M1,M5,M15. Идея в том, что на таких Таймфреймах увеличение количества тиков говорит об увеличении количество сделок, увеличения интереса к цен
MT4 "독수리 눈 지표"로 바이너리 옵션 거래의 가능성을 극대화하세요 메타트레이더 4(MT4)용 "독수리 눈 지표"를 활용하여 바이너리 옵션 거래의 혁명적인 세계에 도약해 보세요. 이 혁신적인 도구는 수술적인 정확성과 비교할 수 없는 수익성을 제공하여 거래 경험을 변화시킬 준비가 되어 있습니다. 잠재력의 경계가 깨지고 수익이 극대화되는 세계로 뛰어들어 보세요. 독수리 눈 지표의 뛰어난 정확성과 흔들림 없는 신뢰성 덕분에 시장의 숨겨진 비밀을 해결할 수 있습니다. 세심한 세부 사항에 주의를 기울여 개발된 이 최첨단 지표는 고급 알고리즘, 철저한 기술적 분석, 실시간 시장 데이터를 결합하여 탁월한 거래 이점을 제공합니다. 독수리 눈 지표는 시장의 포인트를 정확하게 파악하여 통찰력 있는 신속한 결정을 돕습니다. 직관적인 인터페이스와 사용하기 쉬운 디자인을 통해 초보 트레이더도 쉽게 바이너리 옵션의 복잡성을 탐색하고 이 도구의 엄청난 힘을 최대한 활용할 수 있습니다. 추측과 감정에 기반한
Introduction This indicator detects volume spread patterns for buy and sell opportunity. The patterns include demand and supply patterns. You might use each pattern for trading. However, these patterns are best used to detect the demand zone (=accumulation area) and supply zone (=distribution area). Demand pattern indicates generally potential buying opportunity. Supply pattern indicates generally potential selling opportunity. These are the underlying patterns rather than direct price action. T
This indicator prepared by using 311,1298 days Haskaya Trend Bandse and Calculates the strand ADX.    This system can be used for 5M time frame.     This system is for Long term and profitable.    Signals are shown as arrows. as an optional,    you can set a voice alarm or email notification    You can fins our other products from link : https://www.mql5.com/en/users/drbastem/seller    Also, you can ask all your questins from email : haskayafx@gmail.com or mobile : +90 530 867 5076 or @Meh
Strong Pairs
Angelico Jurado
5 (1)
This indicator calculates the strength of the major currencies (EUR, USD, CAD, GBP, CHF, NZD, USD, JPY) and shows the top 4 strongest currency pairs that are currently in a high probability trend for the day or for the week. Usage The indicator displays 8 currency pairs with a trend direction (e.g. "EURUSD-DOWN") and ranked according to strength, with 1 being ths strongest. There will be 4 pairs for intraday and 4 pairs for intraweek If a currency pair is present in the top 4 intraday, it is i
Binary Option Signal
Yaroslav Varankin
Indicator for binary options arrow is easy to use and does not require configuration works on all currency pairs, cryptocurrencies buy signal blue up arrow sell signal red down arrow tips do not trade during news and 15-30 minutes before their release, as the market is too volatile and there is a lot of noise it is worth entering trades one or two candles from the current period (recommended for 1 candle) timeframe up to m 15 recommended money management fixed lot or fixed percentage of the depo
BinaryIndi
Andrey Kravchenko
This is an arrow indicator for binary options. It does not redraw, arrows do not disappear. The indicator implements an optional tester for visual monitoring of the number of signal and win rate. Does not require adjustment or fitting. Works on all pairs and gold. The signal appears at the close of a candle. Entry is made on the next bar. Optional alert. For trading with robots, there is a setting for the number of bars in history. If 0, the entire history is used. The EA operation time: 24/5 Wo
Market Profile
Artem Titarenko
5 (1)
The "Market Profile" indicator displays the profiles and volumes of periods – weekly, daily, session (8-hour), 4-hour, hour, summary. The VAH/VAL price area is automatically highlighted by a dotted line for each profile (except for the summary). The indicator includes chroma Delta, which colors the profile areas. The areas of prevailing Buys is colored in green, that of Sells - in red. The intensity histogram features blue/red respectively. In the filter mode, the indicator displays the volume a
이 제품의 구매자들이 또한 구매함
Atomic Analyst
Issam Kassas
5 (3)
우선적으로 언급할 점은이 거래 지표가 다시 그리지 않고 지연되지 않으며 이를 통해 수동 및 로봇 거래 모두에 이상적이라는 점입니다. 사용자 매뉴얼: 설정, 입력 및 전략. Atomic Analyst는 가격의 강도와 모멘텀을 활용하여 시장에서 더 나은 이점을 찾는 PA Price Action Indicator입니다. 고급 필터를 장착하여 잡음과 거짓 신호를 제거하고 거래 잠재력을 높이는 데 도움이 됩니다. 복잡한 지표의 다중 레이어를 사용하여 Atomic Analyst는 차트를 스캔하고 복잡한 수학적 계산을 간단한 신호와 색상으로 변환하여 초보 트레이더가 이해하고 일관된 거래 결정을 내릴 수 있도록합니다. "Atomic Analyst"는 새로운 및 경험이 풍부한 트레이더를위한 종합적인 거래 솔루션입니다. 프리미엄 지표와 최고 수준의 기능을 하나의 거래 전략에 결합하여 모든 종류의 트레이더에 대한 다재다능한 선택지가되었습니다. 인트라데이 거래 및 스캘핑 전략 : 빠르고 정확한
TPSpro RFI Levels
Roman Podpora
4.8 (15)
Reversal First Impulse levels (RFI)    INSTRUCTIONS        RUS       -       ENG              R ecommended to use with an indicator   -   TREND PRO -  Version MT5 A key element in trading is zones or levels from which decisions to buy or sell a trading instrument are made. Despite attempts by major players to conceal their presence in the market, they inevitably leave traces. Our task was to learn how to identify these traces and interpret them correctly. Main functions: Displaying active zones
TrendMaestro
Stefano Frisetti
5 (3)
note: this indicator is for METATRADER4, if you want the version for METATRADER5 this is the link:  https://www.mql5.com/it/market/product/108106 TRENDMAESTRO ver 2.4 TRENDMAESTRO recognizes a new TREND in the bud, he never makes mistakes. The certainty of identifying a new TREND is priceless. DESCRIPTION TRENDMAESTRO identifies a new TREND in the bud, this indicator examines the volatility, volumes and momentum to identify the moment in which there is an explosion of one or more of these data a
FX Volume
Daniel Stein
4.6 (35)
모닝 브리핑을 통해 세부 정보와 스크린샷으로 매일 시장 업데이트를 받으세요 여기 mql5 및 텔레그램에서 FX 거래량은 브로커의 관점에서 시장 심리에 대한 실제 통찰력을 제공하는 최초이자 유일한 거래량 지표입니다. 브로커와 같은 기관 시장 참여자가 외환 시장에서 어떤 포지션을 취하고 있는지에 대한 훌륭한 통찰력을 COT 보고서보다 훨씬 빠르게 제공합니다. 차트에서 이 정보를 직접 확인하는 것은 트레이딩의 진정한 판도를 바꾸고 획기적인 솔루션입니다. 다음과 같은 고유한 시장 데이터 인사이트의 이점 비율 는 통화의 매수/매도 포지션 비율을 백분율로 표시 비율 변화 는 선택한 기간 내 매수 비율과 비율 변화를 표시 총 거래량 는 해당 통화의 총 거래량(롱 및 숏)을 로트 단위로 보여줍니다 Volumes Long 는 해당 통화의 모든 롱 포지션의 거래량을 보여줍니다 Volumes Short 는 해당 통화의 모든 숏 포지션의 거래량을 보여줍니다 Net Long 는 순 롱 포지션의 거래량
ON Trade Optuma Astro
Abdullah Alrai
5 (4)
물론입니다. 아래는 제공해주신 텍스트의 한국어 번역입니다: MT4용 천문학 지표 소개: 귀하의 최상급 하늘 트레이딩 동반자 트레이딩 경험을 천체의 높이로 끌어올리기 준비가 되셨나요? MT4용 천문학 지표를 소개합니다. 이 혁신적인 도구는 복잡한 알고리즘의 힘을 활용하여 탁월한 천문학적 통찰과 정밀한 계산을 제공합니다. 정보의 우주를 손에 담다: 천문학적 데이터의 보물함을 드러내는 포괄적인 패널을 살펴보세요. 행성의 지오/헬리오센트릭 좌표, 태양/지구 거리, 크기, 길이, 별자리, 황도 좌표 및 적도 좌표, 심지어 수평 좌표 등 각각이 정밀하게 계산되고 아름답게 제시됩니다. 지표에 의해 생성된 수직선은 시간 값에 해당하여 트레이딩 여정에 우주적인 시각을 부여합니다. 행성 라인과 관계: 수정 가능한 스케일과 각도로 차트를 장식하는 행성 라인의 마법을 경험해보세요. 직관적인 컨트롤 패널을 통해 각 행성의 라인의 가시성을 손쉽게 전환할 수 있습니다. 쥰션이나 섹스타일, 사분각, 삼분각, 트
Gann Swing Structure
Kirill Borovskii
5 (1)
This indicator is based on the mathematics of the great trader W.D. Ganna. With its help, you can easily find strong levels by analyzing swings to find the optimal entry point. The indicator works on all instruments and all timeframes. The indicator is fully manual and has control buttons. All you need to do is press the NEW button, a segment will appear, which you can place on any movement, swing or even 1 candle that you want to analyze. By placing the segment, press the OK button. A grid (th
현재 20% 할인 ! 초보자 또는 전문가 트레이더를 위한 최고의 솔루션! 이 대시보드 소프트웨어는 28개의 통화 쌍에서 작동합니다. 2가지 주요 지표(Advanced Currency Strength 28 및 Advanced Currency Impulse)를 기반으로 합니다. 전체 Forex 시장에 대한 훌륭한 개요를 제공합니다. 고급 통화 강도 값, 통화 이동 속도 및 모든(9) 시간대의 28 Forex 쌍에 대한 신호를 보여줍니다. 추세 및/또는 스캘핑 기회를 정확히 파악하기 위해 차트의 단일 지표를 사용하여 전체 시장을 볼 수 있을 때 거래가 어떻게 개선될지 상상해 보십시오! 잠재적인 거래를 식별하고 확인하면서 강력한 통화와 약한 통화를 더욱 쉽게 식별할 수 있도록 이 지표에 기능을 내장했습니다. 이 표시기는 통화의 강세 또는 약세가 증가 또는 감소하는지 여부와 모든 시간대에서 수행되는 방식을 그래픽으로 보여줍니다. 추가된 새로운 기능은 현재 시장 조건 변화에 적
Dragon Multi Indicator MT4
Mansour Babasafary
5 (4)
3 Indicators in 1 indicator Strategy based on price action Made specifically for the best forex currency pairs Can be used in the best time frame of the market at a very reasonable price This indicator is basically 3 different indicatos . But we have combined these 3 indicators in 1 indicator so that you can use 3 indicators at the lowest price. All three strategies are based on price action. But based on different trends. Long term, medium term and short term Attributes : No repaintin
Full Forex Market View Dashboard
Opengates Success International
5 (2)
전체 외환 시장 보기 대시보드 표시기 이것은 거래자에게 시장에서 일어나는 일에 대한 전체 보기를 제공하기 위해 만들어진 사용자 지정 지표입니다. 실시간 데이터를 사용하여 시장에 액세스하고 성공적인 거래에 필요한 모든 정보를 표시합니다. 설치: 이 지표를 창 차트에 첨부하기 전에 MT4의 Market Watch 패널로 이동하여 필요하지 않거나 거래하지 않는 모든 통화 쌍을 숨기고 나머지는 그대로 두십시오. 그 이유는 FFMV 대시보드가 MT4의 Market Watch에 나타나는 모든 통화 쌍을 표시하기 때문입니다. 최대 30개 이하의 통화 쌍을 표시할 수 있습니다. MT4의 Market Watch에서 그 이상이면 FFMV 대시보드의 글꼴과 이미지가 흐려지고 변형됩니다! 제대로 표시되지 않습니다. 용법:      솔로 트레이딩      바구니 거래의 경우(방법에 대한 스크린샷 참조)      다중 주문 거래에도 사용할 수 있습니다.      자신의 거래
ECM Channel MT4
Paulo Rocha
5 (1)
ECM Elite Channel is a volatility-based indicator, developed with a specific time algorithm, which consists of finding possible corrections in the market. This indicator shows two outer lines, an inner line (retracement line) and an arrow sign, where the channel theory is to help identify overbought and oversold conditions in the market. The market price will generally fall between the boundaries of the channel. If prices touch or move outside the channel, it's a trading opportunity. The
Volatility Trend System - a trading system that gives signals for entries. The volatility system gives linear and point signals in the direction of the trend, as well as signals to exit it, without redrawing and delays. The trend indicator monitors the direction of the medium-term trend, shows the direction and its change. The signal indicator is based on changes in volatility and shows market entries. The indicator is equipped with several types of alerts. Can be applied to various trading
XQ Indicator MetaTrader 4
Marzena Maria Szmit
3 (2)
Step into the realm of Forex trading with confidence and precision using XQ, a cutting-edge Forex indicator designed to elevate your trading game to unprecedented heights. Whether you're a seasoned trader or just stepping into the world of currency exchange,   XQ Forex Indicator   empowers you with the insights and signals needed to make informed trading decisions. The signal conditions are a combination of three indicators, and XQ Forex Indicator only display  medium and long-term trends . The
Backtesting Simulator MT4
Diego Arribas Lopez
3.5 (2)
[ MT5 Version ] Backtesting Simulator Are you tired of spending months on demo or live accounts to test your trading strategies? The Backtesting Simulator is the ultimate tool designed to elevate your backtesting experience to new heights. Utilizing Metatrader historical symbol information, it offers an unparalleled simulation of real market conditions. Take control of your testing speed, test ideas quickly or at a slower pace, and witness remarkable improvements in your testing performance. For
ON Trade Waves Patterns Harmonic Elliot Wolfe를 소개합니다. 이는 수동 및 자동 방법을 사용하여 다양한 시장 패턴을 감지하기 위해 개발된 고급 지표입니다. 다음은 그 작동 방식입니다: 조화적 패턴: 이 지표는 차트에 나타나는 조화적 패턴을 식별할 수 있습니다. 이러한 패턴은 Scott Carney의 "Harmonic Trading vol 1 및 2"에서 설명한 것처럼 조화적 거래 이론을 연습하는 트레이더에게 중요합니다. 수동으로 그리든 자동 감지를 사용하든 ON Trade Waves Patterns가 도움을 줄 것입니다. 컨트롤 패널: 이 지표에는 사용자 친화적인 컨트롤 패널이 있습니다. 차트 및 시간 프레임 설정을 저장하여 다양한 구성 간에 쉽게 전환할 수 있습니다. 차트 공간을 최대화하려면 최소화할 수도 있습니다. 다른 분석 도구를 사용하는 것을 선호하는 경우 닫기 버튼을 클릭하여 모든 지표 데이터를 숨길 수 있습니다. 템플릿 저장: 설정을 사
Shepherd Harmonic Pattern
Abdullah Alrai
4.68 (59)
이 지표는 수동 및 자동 방법으로 차트에 그려진 고조파 패턴을 감지합니다. 사용자 매뉴얼은 다음 링크에서 확인할 수 있습니다. 리뷰를 작성하고 문의하면 무료 버전으로 MT4에서 제품을 시도할 수 있습니다. Gartley 및 Nenstar 패턴을 감지하는 데 사용할 수 있습니다. https://www.mql5.com/en/market/product/30181 전체 MT4 버전을 구입하려면 다음에서 구입할 수 있습니다. https://www.mql5.com/en/market/product/15212 참고 사항 지표에는 제어 패널이 있으며 모든 (차트 및 시간대) 설정을 저장합니다. 차트에서 더 많은 공간을 확보하려면 최소화할 수 있으며, 다른 분석 도구로 작업하는 것이 선호되는 경우 모든 지표 데이터를 숨기려면 닫기 버튼을 누를 수 있습니다. 이 지표를 사용하고 설정을 변경하면 이동 평균 또는 볼린저 밴드와 같은 지표를 추가하면 자동으로 템플릿을 저장하고 필요할 때 언제든지 로드할 수
Indicator : RealValueIndicator Description : RealValueIndicator is a powerful tool designed specifically for trading on the EURUSD pair. This indicator analyzes all EUR and USD pairs, calculates their real currency strength values, and displays them as a single realistic value to give you a head start on price. This indicator will tell you moves before they happen if you use it right. RealValueIndicator allows you to get a quick and accurate overview of the EURUSD currency pair tops and bottoms,
Nasdaq100 Power Indicator
Teboho Edgar Rakotsoane
5 (4)
The NASDAQ 100 Power Indicator serves with TREND and trend reversals indication using automated arrows that indicates buy or sell at that price and has built-in signal provider across all time frames with alerts and provides also the automated support and resistance that can draw technical analysis patterns like double bottom, double top, head and shoulders etc. using closing and open prices, in assistance for if a trader did not see the pattern sooner for their technical analysis. The indicator
Cycle Sniper
Elmira Memish
4.39 (36)
NEW YEAR SALE PRICE FOR LIMITED TIME!!! Please contact us after your purchase and we will send you the complimentary indicators to complete the system Cycle Sniper is not a holy grail but when you use it in a system which is explained in the videos, you will feel the difference. If you are not willing to focus on the charts designed with Cycle Sniper and other free tools we provide, we recommend not buying this indicator. We recommend watching the videos about the indiactor and system before pu
The indicator of a Professional Trader is an arrow indicator for predicting the direction of price movement. I have been working on this indicator since 2014. You can use this indicator as your main indicator, use its entry signals, and use it as your only indicator to find entry points. About the product: Recommended TF [H4-D1-W1]   . The indicator predicts the direction of the next candle. Fits a variety of tools; Flexibility in settings for different instruments and intervals through the
PZ Swing Trading
PZ TRADING SLU
5 (4)
Swing Trading is the first indicator designed to detect swings in the direction of the trend and possible reversal swings. It uses the baseline swing trading approach, widely described in trading literature. The indicator studies several price and time vectors to track the aggregate trend direction and detects situations in which the market is oversold or overbought and ready to correct. [ Installation Guide | Update Guide | Troubleshooting | FAQ | All Products ] Profit for market swings with
Weis Wave with Alert
Trade The Volume Waves Single Member P.C.
4.8 (20)
Rental/Lifetime Package Options and Privileges' * For optimum results the yearly or lifetime package is suggested due to live training and Discord  channel trading with the  creator! Rent Monthly Six Months   Yearly/Lifetime Weis Wave with Speed with Alert+Speed Index x x x Manual  x x x Quick Set up Video x x x Blog x x x Lifetime Updates x x x Setup and Training Material x x Free Rectangle Break Alert Tool      x Discord Access Channel "The SI traders" x 2-hour live methodology traini
Volume by Price MT4
Brian Collard
4.71 (14)
The Volume by Price Indicator for MetaTrader 4 features Volume Profile and Market Profile TPO (Time Price Opportunity). Volume and TPO histogram bar and line charts. Volume Footprint charts. TPO letter and block marker collapsed and split structure charts. Session filtering and grouping. Static, dynamic and flexible range segmentation and compositing methods with relative and absolute visualizations. Graphical layering, positioning and styling options to suit the user's analytic and aesthetic n
Multi Advanced Arrow
Alfred Kamal
5 (2)
It is the same of Advanced Arrow indicator but shows the signal of 8 currencies pairs at the same time on 5 Timeframes without any TPs line or SL. Features You will know when exactly you should enter the market. This indicator does not repaint it's signals. Signal Types and Timeframes Used You can use this indicator on any timeframes but i recommend you to use it on H1, H4 frames. The indicator gives you four signals (Ready to Buy "RBuy", Ready to Sell "RSell", Buy, Sell). When RBuy appear y
기적적인 외환 지표 소개: 정확한 트레이딩의 힘을 발휘하세요 모든 시간대에서 뛰어난 결과를 제공하는 최고의 외환 지표를 찾는데 지친 적이 있나요? 더 이상 찾을 필요가 없습니다! 기적적인 외환 지표가 도래하여 귀하의 트레이딩 경험을 혁신하고 수익을 새로운 고도로 끌어올립니다. 최첨단 기술과 수년간의 정성스런 개발을 토대로 기적적인 외환 지표는 외환 시장에서의 힘과 정확성의 정점으로 떠오릅니다. 이 탁월한 도구는 모든 수준의 트레이더의 요구를 충족시키고 지속적인 수익을 추구하는 데에서 비길 데 없는 우위를 제공하기 위해 설계되었습니다. 기적적인 외환 지표의 가장 큰 장점은 그 뛰어난 적응성에 있습니다. 당신이 데이 트레이더, 스윙 트레이더이든 장기 포지션을 선호하든, 이 지표는 모든 시간대에서 뛰어난 결과를 제공하기 위해 최적화되었습니다. 그러나 그 정확성과 시장의 복잡한 움직임을 포착하는 능력이 참으로 빛을 발하는 것은 1시간 기간대에서 사용할 때입니다. 기적적인 외환 지표의 정확성
TPA True Price Action indicator reveals the true price action of the market makers through 100% non-repainting signals (except early signals mode) strictly at the close of a candle! TPA shows entries and re-entries, every time the bulls are definitely stronger than the bears and vice versa. Not to confuse with red/green candles. The shift of power gets confirmed at the earliest stage and is ONE exit strategy of several. There are available now two free parts of the TPA User Guide for our custo
Wolfe Wave Scanner
Jalitha K Johny
5 (2)
Wolfe Waves scanner - It scans all the Symbols and identify the movement of price and it gives confidence in trade. It automatically plots  fifth wave breaks out of the channel. According to the theory behind the pattern, a line drawn from the point at the beginning of the first wave and passing through the beginning of the fourth wave predicts a target price for the end of the fifth wave. If a trader properly identifies a Wolfe Wave as it forms, the beginning of the fifth wave represents an op
Introduction to Fractal Pattern Scanner Fractal Indicator refers to the technical indicator that makes use of the fractal geometry found in the financial market. Fractal Pattern Scanner is the advanced Fractal Indicator that brings the latest trading technology after the extensive research and development work in the fractal geometry in the financial market. The most important feature in Fractal Pattern Scanner is the ability to measure the turning point probability as well as the trend probabi
Scientific trade
Aleksey Ivanov
5 (1)
An extremely convenient indicator that truly makes the process of making money on the exchange easy. It is based on the scientifically rigorous theory of the market developed by the author, the beginning of which is presented here .                The full algorithm of this indicator operation is presented in the article .               The indicator calculates the most probable price movement trajectory and displays it on the chart. Based on the predicted price movement trajectory
거래 속도는 시장에서 대량 주문이 언제 어디서 누적되는지, 그리고 이로 인한 이점을 보여주는 최고 품질의 지표입니다. 매우 초기 단계에서 추세 변화를 감지합니다. 이는 지표이자 동시에 트레이딩 시스템입니다. 이 개념은 독특하고 수익성이 매우 높습니다. 외환에서 틱 볼륨은 거래량이라고 오해의 소지가 있습니다. 실제로는 단위 시간당 가격 변동으로, 사실상 거래 속도입니다. 이 지표는 외환에서 볼륨에 대한 개념을 완전히 수정하여 올바른 방식으로 논리적으로 정의하고이 논리를 적용하면 독특하고 정확한 최상위 수익성 도구가됩니다. 속도가 증가하면 더 큰 관심과 그에 상응하는 진입 및 출구의 신호입니다. 사용 방법: 이 지표는 시장에서 거래 속도를 측정하고 비교하기 때문에 가장 먼저해야 할 일은 다음과 같습니다.  이러한 비교를 할 기간을 선택합니다.  일반적으로 15일 전이 비교를 위한 좋은 출발점입니다.  인디케이터에 날짜를 입력하고 실행합니다.  30분 또는 1시간의 기간에서
Max Min Cycle
Vitalyi Belyh
Cyclical indicator for trading and predicting the direction of the market. Shows the cyclical behavior of the price in the form of an oscillator. Gives signals for opening deals when rebounding from the upper and lower boundaries of the oscillator. In the form of a histogram, it shows the smoothed strength of the trend. Will complement any trading strategy, from scalping to intraday. The indicator does not redraw. Suitable for use on all symbols/instruments. Suitable time frames for short-term
제작자의 제품 더 보기
Best Scalper EA is a very short scalper EA that analyzes the market by using some of the most powerful indicators, it uses the main trend to enter the market. This EA uses the D1 timeframe for identifying the trend and uses a short timeframe to enter the market. It is a scalper with a very short take and a stop. It’s a new unique and experimental EA that actually worked and has proven results! 93% Winning percentage with proper money management. It uses an adaptive trade trailing algorithm. This
This EA buys when at new low in a down trend occurs with oversold rsi. inputs for trending range and quality including look back how many bars involved. sells at new high and same as buy.  Past candle count , look back period for trend conditions. past pips , pip look back range minimum range. trend quality 1-10 , 1 being loose trend / 10 quality trend. stop are placed in pips targets are a percent of stops. 100 being a 1:1 risk reward ratio . 200 1:2 ect lots set at 0.01 , variable. rsi period
The EUR/USD Forex Scalping robot for Metatrader 4 is a simple to use expert advisor that can be used by both beginners and seasoned traders. This scalping bot was designed to trade the EUR/USD pair and made an amazing +115.19% gain during the test phase. As always, please use this EA on a demo account first until you fully understand how it works and how it performs over an extended period of time. Trade Information The EUR/USD scalping EA focuses on the short-term charts and works with pending
필터:
리뷰 없음
리뷰 답변