• 미리보기
  • 리뷰
  • 코멘트 (1)
  • 새 소식

Haskaya Correct Signal

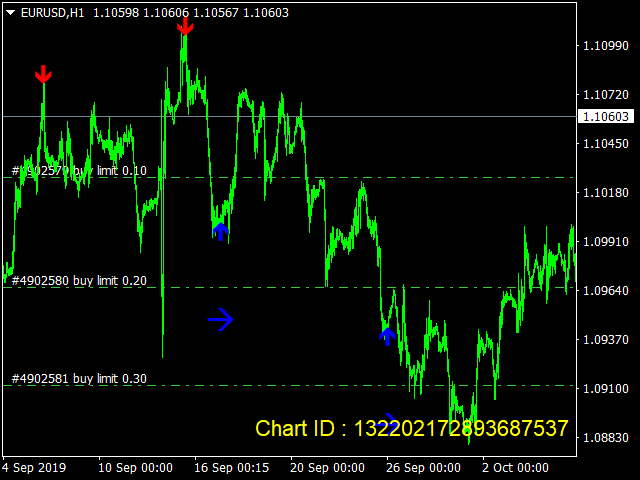
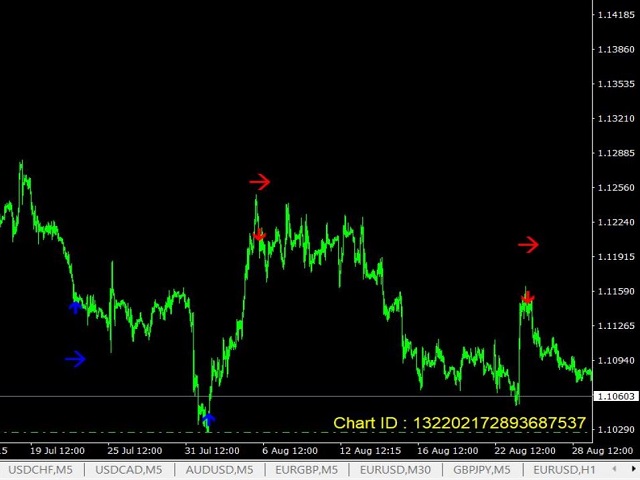
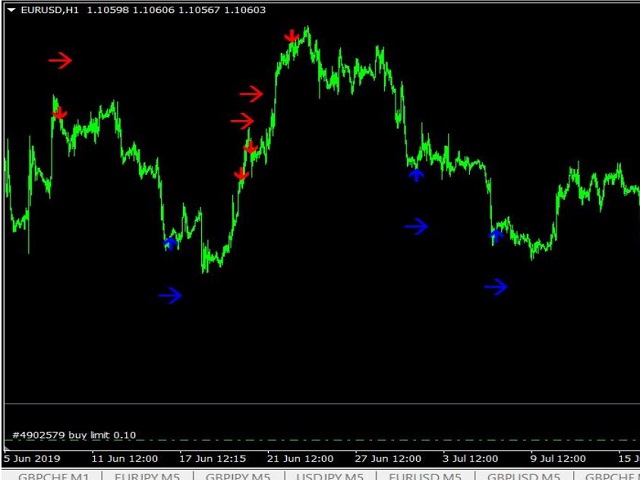
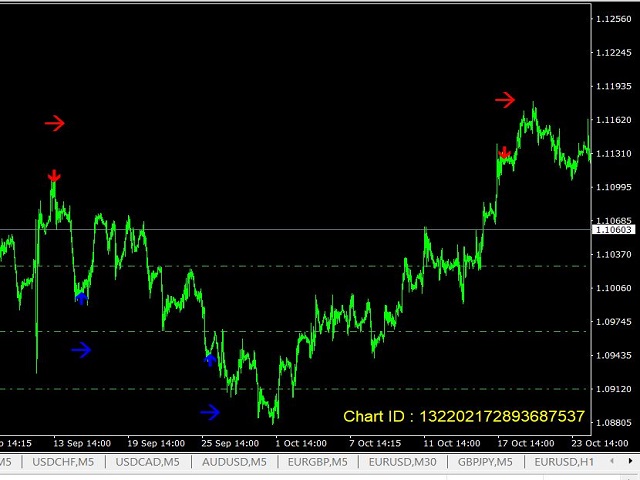
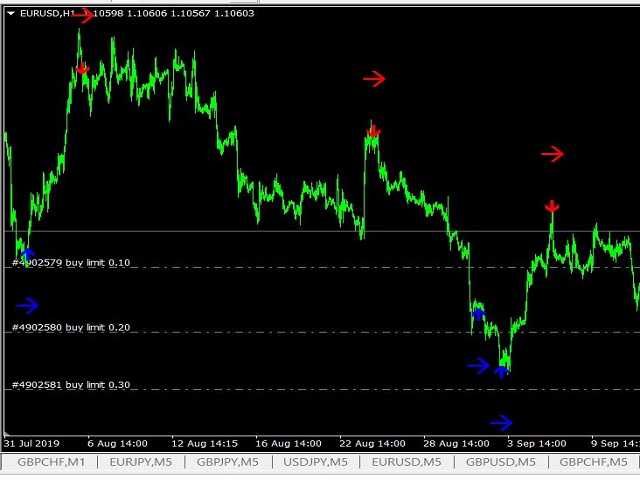
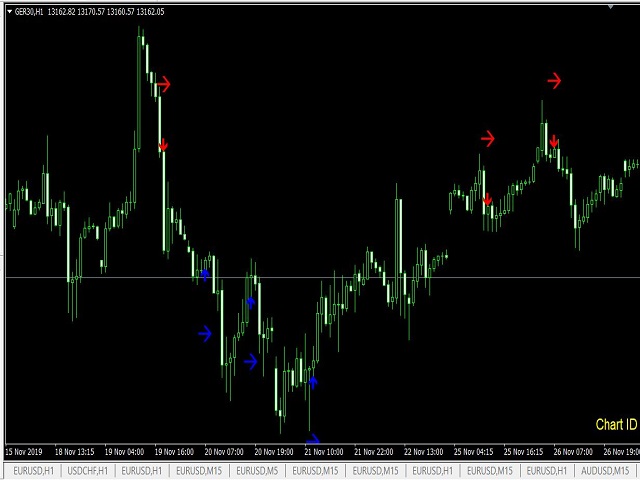
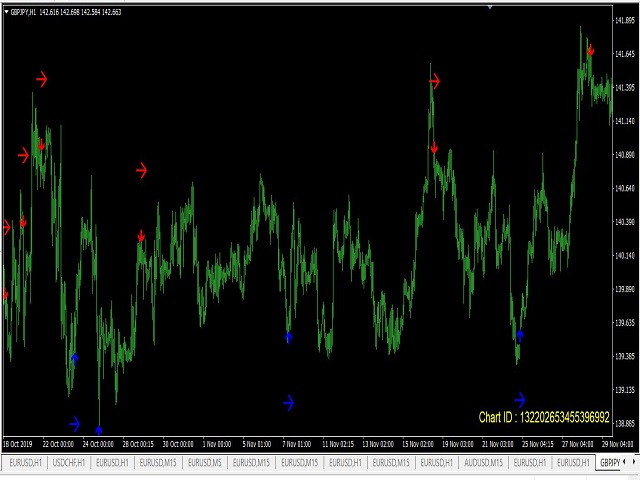
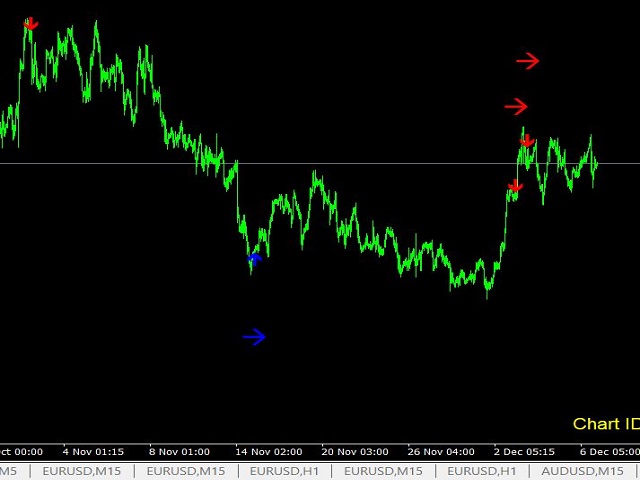
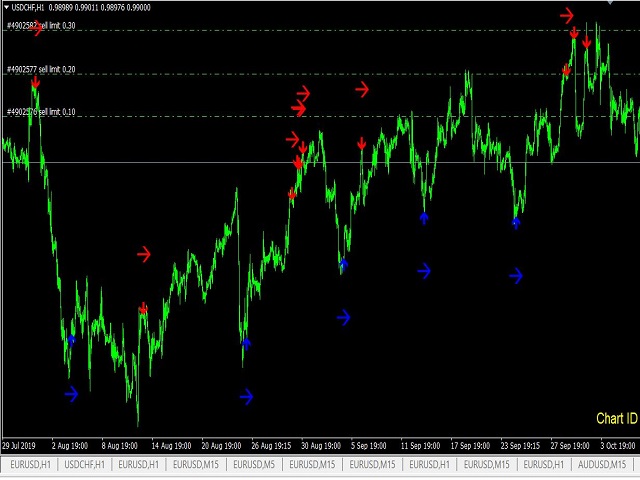
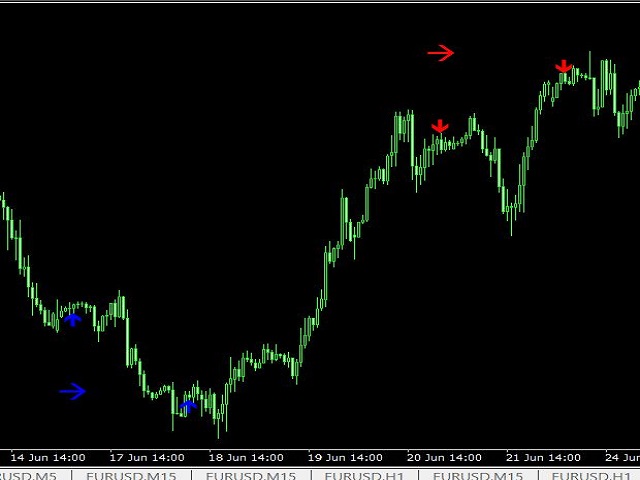
This indicator is using two moving average , signal will be crated according to preset points on two Moving Average.

In general, First signal is immadiate entrence and second order is limit order.

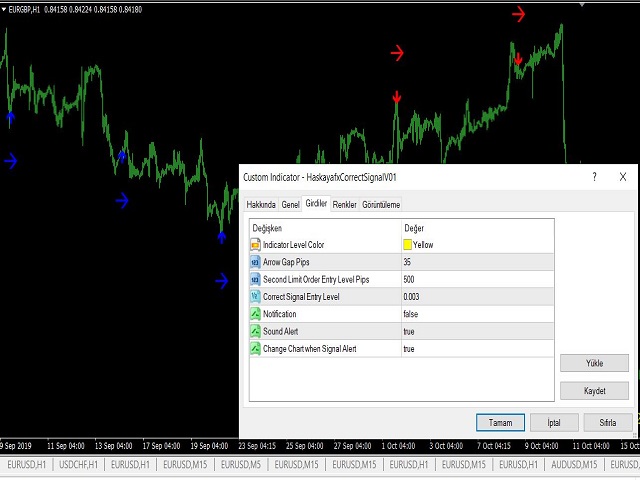
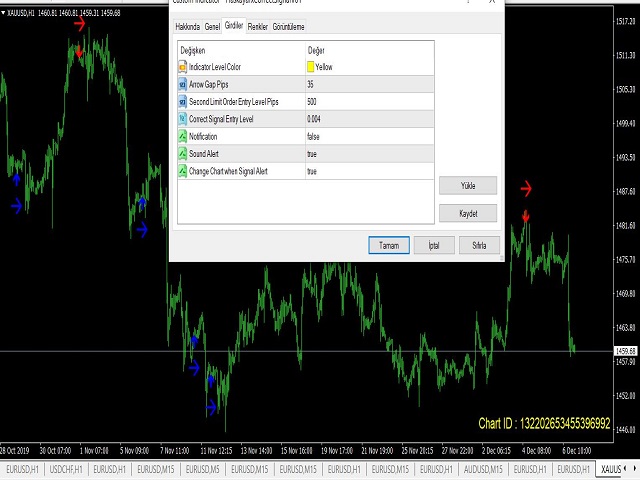
color IndLevelColor=clrYellow;  // Indicator Level Color

extern int   ArrowGap=35; // Close+-Arrow Gap Pips

extern int   SecondOrderEntryLevelPips=500;// Second Limit Order Entry Level Pips

extern int   HareketliOrtalamaGiris1=5; // 1. Moving Average

extern int   HareketliOrtalamaGiris2=35;// 2. Moving Average

extern double    HareketliOrtalamaAlimGirisSeviyesi=0.003;      // Correct Signal Entry Level 

extern bool      CepUyariGonder=false;      // Notification 

extern bool      SesliAlarm=true;           // Sound Alert

extern bool      AktifGrafikGoster=true;    // Change Chart when Signal Alert


추천 제품
TwoMA Crosses
Nedyalka Zhelyazkova
TwoMA Crosses indicator displays arrows based on whether the short term moving average crosses above or below the long term moving average. A moving average doesn't predict price direction. Instead, it defines the current direction. Despite this, investors use moving averages to filter out the noise. Traders and investors tend to use the EMA indicator, especially in a highly volatile market because it’s more sensitive to price changes than the SMA. Download for FREE  TwoMA Crosses  EA from th
FREE
The Hull Moving Average (HMA), developed by Alan Hull from 2005, one of the most fast-moving Average, reduce lag and easy to use to identify Trend for both Short & Long term. This Indicator is built based on exact formula of Hull Moving Average with 3 phases of calculation: Calculate Weighted Moving Average (WMA_01) with period n/2 & (WMA_02) with period n Calculate RAW-HMA: RAW-HMA  = 2 * WMA_01(n/2) - WMA_02(n) Weighted Moving Average with period sqrt(n) of RAW HMA HMA = WMA (RAW-HMA, sqrt(n
FREE
MA Crosses Show
Faran Ataeiraveshti
5 (1)
Hello.  Another free indicator from Sepehr! ;) You can determine the trend with this tool. Using crosses of two Moving averages, you can say that the trend is going to be bullish or bearish; A fast-moving average and a slow one. When the fast-moving crosses up the slow-moving, it's going to be an uptrend and when it crosses down the slow-moving, it means that you are going to have a downtrend. That's easy ;) Hope to enjoy it Sepehr(Faran)
FREE
This indicator prepared by using 1311,2840 days moving average and Calculates the Envelopes.    This system can be used for 15M time frame.     This system is for Long term and profitable.    Signals are shown as arrows. as an optional,    you can set a voice alarm or email notification    You can fins our other products from link : https://www.mql5.com/en/users/drbastem/seller    Also, you can ask all your questins from email : haskayafx@gmail.com or mobile : +90 530 867 5076 or @MehmetBastem
Multi RsIBB MT4
Mansour Babasafary
5 (1)
A combined indicator of two famous indicators: RSI , Bollinger Bands Can be used in all currency pairs Can be used in all time frames with many signals Very simple and fast to use Description: This indicator is made from the combination of RSI and Bollinger Bands indicators As you can see, it shows good signals and is worth using and testing We hope you are satisfied with this indicator Settings: show past show candle: Displays the number of candles that the indicator calculates. For
FREE
SFT Full MACD
Artem Kuzmin
5 (1)
A classic indicator with advanced features for more accurate display of the market situation. All settings of all moving averages are available, such as the moving average type and the priced used in its calculation. It is also possible to change the appearance of the indicator - line or histogram. Additional parameters provide the ability of fine tuning. Distinctive features Does not redraw. Additional parameters for fine tuning. Displayed as a line or as a histogram. Works on all timeframes
FREE
HMA Trend
Pavel Zamoshnikov
4.61 (83)
A trend indicator based on the Hull Moving Average (HMA) with two periods. The Hull Moving Average is an improved variant of the moving average, which shows the moment of trend reversal quite accurately. It is often used as a signal filter. Combination of two types of Hull Moving Averages makes a better use of these advantages: HMA with a slow period identifies the trend, while HMA with a fast period determines the short-term movements and signals in the trend direction. Features The movement
FREE
This indicator is producing accurate signal based on distances between crossection     point of 571 period moving average with 632 period bollinger band and 17 moving average and 171 moving average.     You can also use this signal with expert advisor with below code      double v1= 0 ;     v1= GlobalVariableGet ( Symbol ()+ string ( Period ())+ "HSKPASHAVO1" );      if (v1== 0 )   return ( 0 ); // No Signals      if (v1== 1 )        {        //Send BUY Order...        GlobalVariableSet ( Symbo
APriceChannel is a modification of the standard Price_Channel indicator. The EA draws 2 levels - the upper level shows the price High for the specified period of time, the lower level shows the price Low for the same period. In addition to the period, you can set vertical offset in points to widen the channel up and down. This prevents false breakouts of current support/resistance levels. Inputs Period - time period in bars - the number of bars to calculate the price High/Low. Offset up and do
FREE
Scalping Swing
Oleg Borisov
4.2 (5)
RECOMMEHDATION    Trade with this indicator for 2-3 weeks and you will feel significant progress in your trading. This indicator is developed based on the use of HMA, Laguerre, CCI . Indicator will help you: accurately enter the market; reduce the number of errors when opeinng orders; visually see market movement; predict price movement(in absent of significant news); do not rush to close profitable trades prematurely and increase profit; do not rush to enter the market and wait for "easy prey".
FREE
Force Jurik
Augustine Kamatu
Introducing Force Jurik—a powerful indicator designed to enhance trading insights by combining custom moving averages based on Jurik with the MetaTrader 4 indicator, Force Index. Jurik moving averages are renowned for their precision and smoothness, making them ideal for analyzing price movements in the forex market. They offer traders a reliable method of identifying trends and filtering out market noise, ultimately providing clearer signals for decision-making. The Force Index, a popular
FREE
Crossover MA Histogram
Mariusz Piotr Rodacki
The Cossover MA Histogram indicator is a simple tool showing the trend based on crossover of moving averages. Simply specify two mobving averages and addicional parameters like MA method and Applied price. When fast MA is above slow MA the histogram is green, indicating an uptrend. When MA fast is below MA slow the histogram is red, indicating an downtrend.
FREE
The True Market Indicator
Thomas William Kelly
FREE FOR A LIMITED TIME ONLY!!! The Ultimate Indicator For Trading Trend This indicator clearly shows you the strength of the market in one direction or the other, which means that you can trade knowing you are either with or against the market. When used in conjunction with the +3R principles you are sure to have some serious results. The +3R Principles Routine - This is when you trade and how often  Rules - This is the rule you follow  Risk:Reward - This is the percentage amount of your accoun
FREE
The product   Divergence Cci Force Stddev Ac Atr   is designed to find the differences between indicators and price. It allows you to open orders or set trends using these differences. The indicator has 4 different divergence features. Divergence types Class A Divergence Class B Divergence Class C Divergence Hidden Divergence Product Features and Rec ommendations There are 5 indicators on the indicator Indicators =   CCI, Force, Stdandard Deviation, Acelereator, Atr 4 different divergence ty
FREE
MACD Double
Dorian Baranes
5 (9)
This indicator calculates buy and sell signals by using MACD indicator on two timeframes. MACD is a trend-following showing the relationship between two moving averages of the closing price. The MACD is calculated by subtracting the 26-period Exponential Moving Average (EMA) from the 12-period EMA.The result of that calculation is the MACD line. A nine-day EMA of the MACD called the "signal line". This indicator has 2 modes to calculate the buy/sell signals: - MACD crosses 0 line - MACD cro
FREE
IMA Finder MT4
Mubashir Mohamed Quraish Albarakat
5 (1)
This indicator is designed based on the Moving Origin indicator When the moving origin indicator breaks the price, this indicator gives a signal It is useful for better viewing of signals and analysis on them Attributes: Can be used in all symbols Can be used in all time frames Too many signals Simple and quick settings Easy way to work Settings: period: like moving average settings alarmShow: If you want to receive an alert in Metatrader after receiving the signal, enable this setting a
FREE
The Adaptive Moving Average (AMA), created by Perry Kaufman, is a moving average variation designed to have low sensitivity to market noise and volatility combined with minimal lag for trend detection. These characteristics make it ideal for identifying the overall market trend, time turning points and filtering price movements. A detailed analysis of the calculations to determine the AMA can be found in MetaTrader 5 Help ( https://www.metatrader5.com/en/terminal/help/indicators/trend_indicators
FREE
Accuracy Meter
Ashkan Hazegh Nikrou
5 (1)
Is This tools use able for free in Forex market ? Accuracy Meter is useful and also free product, i made this product for free because i believe that any seller must have some good products for free not just release bad products as free tools. What does Green koala logo mean : Means Free Products , i ll release my free products by green koala logo, so when you see green koala, it means new free products is access able for you. Accuracy Meter Introduction : Accuracy Meter is powerful
FREE
PZ Oscillator
PZ TRADING SLU
3 (10)
This is a smooth and responsive accelerometer which reveals the market trend and strength. [ Installation Guide | Update Guide | Troubleshooting | FAQ | All Products ] Two moving averages indicate trend direction The histogram represents strength of the price movement It draws buy and sell zones as colored vertical lines Should be used as a confirmation indicator Customizable line widths and colors It implements alerts of all kinds This indicator is similar to MACD but aims to react faster t
FREE
TrailingStop MA 4
Andrej Nikitin
4 (3)
The indicator draws two simple moving averages using High and Low prices. The MA_High line is displayed when the moving average is directed downwards. It can be used for setting a stop order for a sell position. The MA_Low line is displayed when the moving average is directed upwards. It can be used for setting a stop order for a buy position. The indicator is used in the TrailingStop Expert Advisor. Parameters Period - period of calculation of the moving average. Deviation - rate of convergence
FREE
The TLR indicator is a market trend identification indicator. The idea behind this indicator is to use 3 linear regression lines, one short-term, one medium-term, and one long-term. The UPTREND will be determined when: The long-term linear regression line and the medium-term linear regression line have an uptrend. The long-term linear regression line has an uptrend, the medium-term linear regression line has a sideway, and the short-term linear regression line has an uptrend. The DOWNTREND will
FREE
CCI in MA
Nikolaos Pantzos
4.5 (6)
iCC in iMA is indicator to change color in iMA if iCCI crosses level up (up trend) or crosses level down (down trend). It is a useful tool to track when the upside and the downside iCCI on iMA. You can to get source code from here . Parameters MA_Periods —Period for iMA. MA_Method — Method for iMA. CCI_Periods —Period for iCCI. CCI_ApliedPrice — Price used for iCCI. CCI_LevelsUp — Level iCCI for up trend. CCI_LevelsDN — Level iCCI for down trend. BarsCount — How many bars will show the line.
FREE
THIS FREE INDICATOR ALLOWS YOU TO SET THE TIMEFRAME OF THE MA YOU WANT ON YOUR CHART For example, it's very useful if you want to trade the H4 200 SMA using a lower timeframe chart, to identify price reactions such as reversals, Wyckoff schematics, etc. ***Please comment, rate and share it to your friends if you like it*** ------------------------------------------------------------------------- Moving averages are popular technical indicators used to identify trends, support and resistance leve
FREE
SuperTrend V
Muhammad Hassaan
5 (1)
*This is TradingView indicator converted to mql4* The SuperTrend V indicator is a popular technical analysis tool used to identify trends and potential trend reversals in financial markets. It is based on the concept of the SuperTrend indicator but incorporates additional features and variations. The SuperTrend V indicator uses a combination of price action and volatility to determine the trend direction and generate trading signals. Here are the key components and features of the indicator:
FREE
Th3Eng HistoMaster
Ahmed Farag
4.83 (6)
Th3Eng HistoMaster  indicator Free Histogram Indicator to detect the current trend direction. The indicator is based on CCI indicator. Also draw arrows when it detect the trend is strong buy or strong sell, with Alerting system (Popup with sound, Email alerting and mobile notification). Also draws a dashboard shows all Time-Frames' current signal. Requirements works with all pairs, stocks, CFDs and crypto currencies. works with all Spreads works with all Account types works on all Time-Frames
FREE
T3 Cloud MA
Ridwan Kureemun
Trend indicator derived from T3 moving averages. The cloud is bounded by a fast T3 and slow T3 lines. Buying/Selling opportunities above/below cloud. The fast and slow T3 MA lines can also be used as dynamic support/resistance for more aggressive entries. Use default values for best settings. The number of look back bars is user defined. This indicator can be used in combination with other strategies such as price action. Suitable for all time frames. Prerequisites:  T3IndiSlow and T3IndiFast in
FREE
Hull Candles AM
Andriy Matviyevs'kyy
The presented indicator colors the chart candles in accordance with the data of the Hull Momentum AM indicator. Coloring of candlesticks depends not only on the location of the oscillator histogram above or below zero. The location of the histogram relative to the signal line is also important. The indicator is part of a series of indicators - Hull Line AM, Hull Momentum AM, Hull Candles AM, Hull Signal AM . For a better understanding of the operation of each of the indicators, it is recommended
FREE
Ikoku Kairi Band
Takuma Shimizu
2.5 (2)
What is Ikoku Kairi Band? It is an oscillator indicator that combines Kairi Relative Index with Bollinger Band and displays signals with possible position entry points.  It is meant to be used to trade against the trend, so it is perfect for scalping in a range market. It shouldn’t be used in a trend market. It will display arrow signals at possible entry points for buy and sell position. You can be notified when they appear with, push, alert or email notifications. You can customise the indica
FREE
ST Cross
Curtis Daniel Jr -
Introduction The ST Cross indicator is based on the traditional Moving Average (MA) Cross which uses a fast and slow moving average. Entry signals to buy and sell are given when both moving averages cross. However with the basic strategy there are a lot of false signals. In order to filter the trades we use the 200 (MA) to identify the overall direction of the trend. Input Settings           Master Trend Period     -      200 Period moving average used to get the trend direction.           Fast
FREE
FRAMA macd 2 AM
Andriy Matviyevs'kyy
Technically, the indicator represents the difference between two fractal adaptive moving averages. Fractal Adaptive Moving Average (FRAMA) is a smart adaptive moving average developed by John Ehlers. FRAMA takes price changes into account and closely follows the price level, remaining straight during price fluctuations. FRAMA takes advantage of the fact that markets are fractal and dynamically adjusts the lookback period based on this fractal geometry. The indicator has the ability to send notif
FREE
이 제품의 구매자들이 또한 구매함
Gann Made Easy
Oleg Rodin
4.93 (71)
Gann Made Easy 는 mr.의 이론을 사용하여 최고의 거래 원칙을 기반으로 하는 전문적이고 사용하기 쉬운 Forex 거래 시스템입니다. W.D. 간. 이 표시기는 Stop Loss 및 Take Profit Levels를 포함하여 정확한 BUY 및 SELL 신호를 제공합니다. PUSH 알림을 사용하여 이동 중에도 거래할 수 있습니다. 구매 후 연락주세요! 내 거래 팁과 훌륭한 보너스 지표를 무료로 공유하겠습니다! 아마도 Gann 거래 방법에 대해 이미 여러 번 들었을 것입니다. 일반적으로 Gann의 이론은 초보자 거래자뿐만 아니라 이미 거래 경험이 있는 사람들에게도 매우 복잡한 것입니다. Gann의 거래 방식은 이론적으로 적용하기 쉽지 않기 때문입니다. 나는 그 지식을 연마하고 Forex 지표에 최고의 원칙을 적용하기 위해 몇 년을 보냈습니다. 표시기는 적용하기가 매우 쉽습니다. 차트에 첨부하고 간단한 거래 권장 사항을 따르기만 하면 됩니다. 지표는 지속적으로 시장 분석 작업
Atomic Analyst
Issam Kassas
5 (3)
우선적으로 언급할 점은이 거래 지표가 다시 그리지 않고 지연되지 않으며 이를 통해 수동 및 로봇 거래 모두에 이상적이라는 점입니다. 사용자 매뉴얼: 설정, 입력 및 전략. Atomic Analyst는 가격의 강도와 모멘텀을 활용하여 시장에서 더 나은 이점을 찾는 PA Price Action Indicator입니다. 고급 필터를 장착하여 잡음과 거짓 신호를 제거하고 거래 잠재력을 높이는 데 도움이 됩니다. 복잡한 지표의 다중 레이어를 사용하여 Atomic Analyst는 차트를 스캔하고 복잡한 수학적 계산을 간단한 신호와 색상으로 변환하여 초보 트레이더가 이해하고 일관된 거래 결정을 내릴 수 있도록합니다. "Atomic Analyst"는 새로운 및 경험이 풍부한 트레이더를위한 종합적인 거래 솔루션입니다. 프리미엄 지표와 최고 수준의 기능을 하나의 거래 전략에 결합하여 모든 종류의 트레이더에 대한 다재다능한 선택지가되었습니다. 인트라데이 거래 및 스캘핑 전략 : 빠르고 정확한
Advanced Currency Strength28 Indicator
Bernhard Schweigert
4.9 (663)
현재 26% 할인 초보자 또는 전문가 트레이더를 위한 최고의 솔루션! 이 지표는 우리가 독점 기능과 새로운 공식을 통합했기 때문에 독특하고 고품질이며 저렴한 거래 도구입니다. 단 하나의 차트로 28 Forex 쌍의 통화 강도를 읽을 수 있습니다! 새로운 추세 또는 스캘핑 기회의 정확한 트리거 포인트를 정확히 찾아낼 수 있기 때문에 거래가 어떻게 개선될지 상상해 보십시오. 사용 설명서: 여기를 클릭  https://www.mql5.com/en/blogs/post/697384 그것이 첫 번째, 원본입니다! 쓸모없는 지망생 클론을 사지 마십시오. 더 스페셜  강력한 통화 모멘텀을 보여주는 하위 창의 화살표 GAP가 거래를 안내합니다! 기본 또는 호가 통화가 과매도/과매도 영역(외부 시장 피보나치 수준)에 있을 때 개별 차트의 기본 창에 경고 표시가 나타납니다. 통화 강도가 외부 범위에서 떨어질 때 풀백/반전 경고. 교차 패턴의 특별 경고 추세를 빠르게 볼 수 있는
Scalper Inside PRO
Alexey Minkov
4.74 (58)
An exclusive indicator that utilizes an innovative algorithm to swiftly and accurately determine the market trend. The indicator automatically calculates opening, closing, and profit levels, providing detailed trading statistics. With these features, you can choose the most appropriate trading instrument for the current market conditions. Additionally, you can easily integrate your own arrow indicators into Scalper Inside Pro to quickly evaluate their statistics and profitability. Scalper Inside
TPSpro RFI Levels
Roman Podpora
4.82 (17)
Reversal First Impulse levels (RFI)    INSTRUCTIONS        RUS       -       ENG              R ecommended to use with an indicator   -   TREND PRO -  Version MT5 A key element in trading is zones or levels from which decisions to buy or sell a trading instrument are made. Despite attempts by major players to conceal their presence in the market, they inevitably leave traces. Our task was to learn how to identify these traces and interpret them correctly. Main functions: Displaying active zones
Trend Punch
Mohamed Hassan
5 (8)
Manual guide:   Click here PROMO of  $79 for 2 copies left!  -- Next price is  $149 .  This indicator is unstoppable when combined with our other indicator called  Support & Resistance . After purchase, send us a message and you will get it   for  FREE as a BONUS! I like to use Trend Punch on XAUUSD & BTCUSD on the M1 timeframe!  Introducing Trend Punch , the revolutionary forex trend indicator that will transform the way you trade! Trend Punch is uniquely designed to provide preci
Market Reversal Alerts
LEE SAMSON
4.21 (121)
가격이 역전되고 후퇴함에 따라 시장 구조가 변경됩니다. 시장 구조 반전 경고 표시기는 추세 또는 가격 움직임이 고갈에 가까워지고 반전할 준비가 되었음을 식별합니다. 일반적으로 반전이나 큰 하락이 일어나려고 할 때 발생하는 시장 구조의 변화를 알려줍니다. 지표는 가능한 고갈 지점 근처에서 새로운 고점 또는 저점이 형성될 때마다 초기에 돌파와 가격 모멘텀을 식별합니다. 표시기는 반대쪽에 있는 마지막 촛불에 직사각형을 그립니다. 그런 다음 현재의 단기 추세에서 계속 움직이기 때문에 가격과 함께 직사각형을 따라갈 것입니다. 가격이 사각형 위나 아래로 다시 닫힐 정도로 약해지면 시장 구조에 잠재적인 변화가 일어나고 있음을 나타냅니다. 그런 다음 표시기는 방향의 잠재적인 이동과 추세 또는 주요 하락의 가능한 반전 시작에 대해 경고합니다. 작동 방식을 보려면 아래의 작동 표시기를 참조하십시오! 여기에서 모든 쌍 및 기간을 모니터링하기 위한 선택적 대시보드 추가 기능: https://
FX Volume
Daniel Stein
4.6 (35)
모닝 브리핑을 통해 세부 정보와 스크린샷으로 매일 시장 업데이트를 받으세요 여기 mql5 및 텔레그램에서 FX 거래량은 브로커의 관점에서 시장 심리에 대한 실제 통찰력을 제공하는 최초이자 유일한 거래량 지표입니다. 브로커와 같은 기관 시장 참여자가 외환 시장에서 어떤 포지션을 취하고 있는지에 대한 훌륭한 통찰력을 COT 보고서보다 훨씬 빠르게 제공합니다. 차트에서 이 정보를 직접 확인하는 것은 트레이딩의 진정한 판도를 바꾸고 획기적인 솔루션입니다. 다음과 같은 고유한 시장 데이터 인사이트의 이점 비율 는 통화의 매수/매도 포지션 비율을 백분율로 표시 비율 변화 는 선택한 기간 내 매수 비율과 비율 변화를 표시 총 거래량 는 해당 통화의 총 거래량(롱 및 숏)을 로트 단위로 보여줍니다 Volumes Long 는 해당 통화의 모든 롱 포지션의 거래량을 보여줍니다 Volumes Short 는 해당 통화의 모든 숏 포지션의 거래량을 보여줍니다 Net Long 는 순 롱 포지션의 거래량
FX Power MT4 NG
Daniel Stein
5 (10)
모닝 브리핑 여기 mql5 와 텔레그램에서 FX Power MT4 NG 는 오랫동안 인기 있는 통화 강도 측정기인 FX Power의 차세대 버전입니다. 이 차세대 강도 측정기는 무엇을 제공합니까? 기존 FX Power에서 좋아했던 모든 것 PLUS GOLD/XAU 강도 분석 더욱 정밀한 계산 결과 개별 구성 가능한 분석 기간 더 나은 성능을 위한 사용자 정의 가능한 계산 한도 특별 멀티더 많은 것을보고 싶은 사람들을위한 특별한 다중 인스턴스 설정 모든 차트에서 좋아하는 색상을위한 끝없는 그래픽 설정 수많은 알림 옵션, 중요한 것을 다시는 놓치지 않도록 Windows 11 및 macOS 스타일의 둥근 모서리가 있는 새로운 디자인 마법처럼 움직이는 인디케이터 패널 FX 파워 키 특징 모든 주요 통화의 완전한 강세 이력 모든 시간대에 걸친 통화 강세 이력 모든 브로커 및 차트에서 고유 계산 결과 100% 신뢰할 수있는 실시간100 % 신뢰할 수있는 실시간 계산-> 다시 칠하지 않음
TPSproTREND PrO
Roman Podpora
4.78 (18)
TPSpro TRENDPRO  - is a trend indicator that automatically analyzes the market and provides information about the trend and each of its changes, as well as giving signals for entering trades without redrawing! The indicator uses each candle, analyzing them separately. referring to different impulses - up or down impulse. Exact entry points into transactions for currencies, crypto, metals, stocks, indices!  -  Version MT5               DETAILED DESCRIPTION                R ecommended to use with
Legacy of Gann
Pavel Zamoshnikov
4.83 (12)
The indicator very accurately determines the levels of the possible end of the trend and profit fixing. The method of determining levels is based on the ideas of W.D.Gann, using an algorithm developed by his follower Kirill Borovsky. Extremely high reliability of reaching levels (according to K. Borovsky  - 80-90%) Indispensable for any trading strategy – every trader needs to determine the exit point from the market! Precisely determines targets on any timeframes and any instruments (forex, met
Gold Stuff
Vasiliy Strukov
4.89 (258)
Gold Stuff는 금을 위해 특별히 설계된 추세 지표이며 모든 금융 상품에서도 사용할 수 있습니다. 표시기가 다시 그려지지 않고 지연되지 않습니다. 권장 기간 H1. 표시기에서 완전 자동 Expert Advisor EA Gold Stuff를 작동합니다. 내 프로필에서 찾을 수 있습니다. 설정 및 개인 보너스를 받으려면 구매 후 즉시 저에게 연락하십시오!   강력한 지원 및 트렌드 스캐너 표시기의 무료 사본을 받으실 수 있습니다. 메시지를 보내주세요. 나!   설정 화살표 그리기 - 켜기 끄기. 차트에 화살표 그리기. 경고 - 가청 경고를 끕니다. 이메일 알림 - 켜기 끄기. 이메일 알림. Puch-notification - 켜기 끄기. 푸시 알림. 다음으로 색 영역을 조정합니다. Gold Stuff는 금을 위해 특별히 설계된 추세 지표이며 모든 금융 상품에서도 사용할 수 있습니다. 표시기가 다시 그려지지 않고 지연되지 않습니다. 권장 기간 H1. 표시기에서 완
Advanced Supply Demand
Bernhard Schweigert
4.92 (312)
현재 33% 할인! 초보자나 전문 트레이더를 위한 최고의 솔루션! 이 보조지표는 우리가 다수의 독창적 기능과 새로운 공식을 통합한 독특하고 고품질이며 저렴한 거래 도구입니다. 이 업데이트를 통해 이중 시간대를 표시할 수 있습니다. 더 높은 TF를 표시할 수 있을 뿐만 아니라 차트 TF와 더 높은 TF 모두를 표시할 수 있습니다: 중첩 영역 표시. 모든 Supply Demand 트레이더들이 좋아할 것입니다. :) 중요한 정보 공개 Advanced Supply Demand의 잠재력을 극대화하려면 다음을 방문하십시오. https://www.mql5.com/ko/blogs/post/720245   진입 또는 목표의 명확한 트리거 포인트를 정확히 찾아냄으로 해서 거래가 어떻게 개선될지 상상해 보십시오. 새로운 알고리즘을 기반으로 매수자와 매도자 간의 잠재적인 불균형을 훨씬 더 쉽게 분간할 수 있습니다. 왜냐하면 가장 강한 공급영역과 가장 강한 수요 영역과 과거에 어떻게 진행 되었는지를(이
Enigmera
Ivan Stefanov
5 (2)
에니메라: 시장의 핵심 https://www.enigmera.com 소개 이 지표 및 트레이딩 시스템은 금융 시장에 대한 놀라운 접근 방식입니다. 에니메라는 프랙탈 주기를 사용하여 지지선과 저항선을 정확하게 계산합니다. 진정한 축적 단계를 보여주고 방향과 목표를 제시합니다.  추세에 있든 조정에 있든 작동하는 시스템입니다.  어떻게 작동하나요? 에니메라는 지지선/저항선, 목표선, 편차선의 세 가지 라인으로 구성됩니다. 이 시스템은 과거 데이터를 현재와 미래로 추정하는 일반적인 시장 지표와 달리 현재에 대한 완전한 그림을 제공합니다. 지지선 위에 있으면 실제 지지를 의미하고 저항선 위에 있으면 실제 저항을 의미합니다. 레벨이 깨지면 추세의 변화를 나타냅니다. 다시 그리지 않습니다. 시장이 지속적으로 진화함에 따라 에니메라는 평가 도구를 조정하여 전략을 정기적으로 수정합니다.   이를 통해 모든 시나리오를 철저히 평가할 수 있습니다. 이 시장 지표의 고유성은 분명하며 그 기
Break and Retest
Mohamed Hassan
4.38 (13)
New update to V.4 where  Break & Retest automatically draws the take profit & stop loss levels and you also have more signals per day! ‍You can visually backtest Break & Retest to see how it behaved in the past!     Manual guide:   Click here $60 for a very limited time. Next price is $120   This Indicator only places quality trades when the market is really in your favor with a clear break and retest. Patience is key with this price action strategy! If you want more alert s
현재 20% 할인 ! 초보자 또는 전문가 트레이더를 위한 최고의 솔루션! 이 대시보드 소프트웨어는 28개의 통화 쌍에서 작동합니다. 2가지 주요 지표(Advanced Currency Strength 28 및 Advanced Currency Impulse)를 기반으로 합니다. 전체 Forex 시장에 대한 훌륭한 개요를 제공합니다. 고급 통화 강도 값, 통화 이동 속도 및 모든(9) 시간대의 28 Forex 쌍에 대한 신호를 보여줍니다. 추세 및/또는 스캘핑 기회를 정확히 파악하기 위해 차트의 단일 지표를 사용하여 전체 시장을 볼 수 있을 때 거래가 어떻게 개선될지 상상해 보십시오! 잠재적인 거래를 식별하고 확인하면서 강력한 통화와 약한 통화를 더욱 쉽게 식별할 수 있도록 이 지표에 기능을 내장했습니다. 이 표시기는 통화의 강세 또는 약세가 증가 또는 감소하는지 여부와 모든 시간대에서 수행되는 방식을 그래픽으로 보여줍니다. 추가된 새로운 기능은 현재 시장 조건 변화에 적
Entry Points Pro
Yury Orlov
4.7 (225)
다시 색을 칠하지 않고 거래에 진입할 수 있는 정확한 신호를 제공하는 MT4용 지표입니다. 외환, 암호화폐, 금속, 주식, 지수 등 모든 금융 자산에 적용할 수 있습니다. 매우 정확한 추정값을 제공하고 매수와 매도의 가장 좋은 시점을 알려줍니다. 하나의 시그널로 수익을 내는 지표의 예와 함께 비디오 (6:22)시청하십시오! 대부분의 거래자는 Entry Points Pro 지표의 도움으로 첫 거래 주 동안 트레이딩 결과를 개선합니다. 저희의   Telegram Group 을 구독하세요! Entry Points Pro 지표의 좋은점. 재도색이 없는 진입 신호 신호가 나타나고 확인되면(시그널 캔들이 완성된 경우) 신호는 더 이상 사라지지 않습니다. 여타 보조지표의 경우 신호를 표시한 다음 제거되기 때문에 큰 재정적 손실로 이어집니다. 오류 없는 거래 게시 알고리즘을 통해 트레이드(진입 또는 청산)를 할 이상적인 순간을 찾을 수 있으며, 이를 통해 이를 사용하는 모든 거래자의
우선적으로, 이 거래 도구는 전문적인 거래에 이상적인 비-다시 그리기 및 지연되지 않는 지표입니다.  온라인 강좌, 사용자 매뉴얼 및 데모. 스마트 가격 액션 컨셉트 인디케이터는 신규 및 경험 많은 트레이더 모두에게 매우 강력한 도구입니다. Inner Circle Trader Analysis 및 Smart Money Concepts Trading Strategies와 같은 고급 거래 아이디어를 결합하여 20가지 이상의 유용한 지표를 하나로 결합합니다. 이 인디케이터는 스마트 머니 컨셉트에 중점을 두어 대형 기관의 거래 방식을 제공하고 이동을 예측하는 데 도움을 줍니다.  특히 유동성 분석에 뛰어나 기관이 어떻게 거래하는지 이해하는 데 도움을 줍니다. 시장 트렌드를 예측하고 가격 변동을 신중하게 분석하는 데 탁월합니다. 귀하의 거래를 기관 전략에 맞추어 시장의 동향에 대해 더 정확한 예측을 할 수 있습니다. 이 인디케이터는 시장 구조를 분석하고 중요한 주문 블록을 식별하고 다양한
Volatility Trend System - a trading system that gives signals for entries. The volatility system gives linear and point signals in the direction of the trend, as well as signals to exit it, without redrawing and delays. The trend indicator monitors the direction of the medium-term trend, shows the direction and its change. The signal indicator is based on changes in volatility and shows market entries. The indicator is equipped with several types of alerts. Can be applied to various trading
맞춤형 MT4 지표로 성공적인 외환 거래에 대한 비밀을 발견하십시오! 외환 시장에서 성공을 달성하고 위험을 최소화하면서 일관되게 이익을 얻는 방법을 궁금해 한 적이 있습니까? 여기에 당신이 찾고 있던 답이 있습니다! 거래에 대한 귀하의 접근 방식을 혁신 할 독점적 MT4 지표를 소개 할 수 있습니다. 독특한 다양성 우리의 지표는 Renko 및 Rangebar Candle Formations를 선호하는 사용자를 위해 특별히 설계되었습니다. 우리는 이러한 차트 유형이 많은 숙련 된 거래자들이 선호한다는 것을 이해하기 때문에 우리의 지표가 그들과 완벽하게 통합되어 비교할 수없는 시장 분석을 제공합니다. 명확한 추세 신호 복잡한 분석을 잊어 버리십시오! 우리의 지표는 생생한 색상과 명확한 점 구조를 사용하여 시장 동향을 명확하게 나타냅니다. 빨간색과 파란색 점은 가격 이동 방향에 대해 의심의 여지가 없어 거래에서 빠른 의사 결정을 할 수 있습니다. HH/HL HL/LL
ICT, SMC, SMART MONEY CONCEPTS, SMART MONEY, Smart Money Concept, Support and Resistance, Trend Analysis, Price Action, Market Structure, Order Blocks, BOS/CHoCH,   Breaker Blocks ,  Momentum Shift,   Supply&Demand Zone/Order Blocks , Strong Imbalance, HH/LL/HL/LH,    Fair Value Gap, FVG,  Premium  &   Discount   Zones, Fibonacci Retracement, OTE, Buy Side Liquidity, Sell Side Liquidity, BSL/SSL Taken, Equal Highs & Lows, MTF Dashboard, Multiple Time Frame, BigBar, HTF OB, HTF Market Structure, 
PRO Renko System
Oleg Rodin
5 (25)
PRO Renko System 은 RENKO 차트 거래를 위해 특별히 고안된 매우 정확한 거래 시스템입니다. 이것은 다양한 거래 상품에 적용될 수있는 보편적 인 시스템입니다. 체계는 효과적으로 당신에게 정확한 반전 신호에 접근을 주는 소위 시장 소음을 중화합니다. 이 표시기는 사용하기가 매우 쉽고 신호 생성을 담당하는 매개 변수가 하나만 있습니다. 당신은 쉽게 당신의 선택의 어떤 무역 계기에 공구를 적응시킬 수 있고 renko 막대기의 크기. 나는 항상 당신이 내 소프트웨어로 수익성있게 거래 할 수 있도록 추가 지원을 제공 할 준비가되어 있습니다! 나는 당신에게 행복하고 수익성있는 거래를 기원합니다! 구매 후 저에게 연락하십시오! 내 렌코 차트 생성기를 보내드립니다. 또한 내 개인 권장 사항 및 시스템의 다른 모듈을 무료로 공유 할 것입니다!
Trend Screener
STE S.S.COMPANY
4.83 (88)
트렌드 표시기, 트렌드 트레이딩 및 필터링을 위한 획기적인 고유 솔루션, 하나의 도구 안에 내장된 모든 중요한 트렌드 기능! Forex, 상품, 암호 화폐, 지수 및 주식과 같은 모든 기호/도구에 사용할 수 있는 100% 다시 칠하지 않는 다중 시간 프레임 및 다중 통화 표시기입니다. Trend Screener는 차트에 점이 있는 화살표 추세 신호를 제공하는 효율적인 지표 추세 추종 지표입니다. 추세 분석기 표시기에서 사용할 수 있는 기능: 1. 트렌드 스캐너. 2. 최대 이익 분석이 있는 추세선. 3. 추세 통화 강도 측정기. 4. 경고가 있는 추세 반전 점. 5. 경고가 있는 강력한 추세 점. 6. 추세 화살표 Trend Screener Indicator가 있는 일일 분석 예, 일일 신호 성능...등은 여기에서 찾을 수 있습니다.   여기를 클릭하십시오. LIMITED TIME OFFER : Trend Screener Indicator는 50 $ 및 평생 동안만 사용할 수 있
Auto Order Block with break of structure based on ICT and Smart Money Concepts (SMC) Futures Break of Structure ( BoS )             Order block ( OB )            Higher time frame Order block / Point of Interest ( POI )    shown on current chart           Fair value Gap ( FVG ) / Imbalance   -  MTF      ( Multi Time Frame )    HH/LL/HL/LH  -  MTF      ( Multi Time Frame )  Choch  MTF      ( Multi Time Frame )  Volume Imbalance     ,  MTF          vIMB Gap’s Power of 3 Equal High
Advanced Currency IMPULSE with ALERT
Bernhard Schweigert
4.91 (494)
현재 31% 할인!! 초보자 또는 전문가 트레이더를 위한 최고의 솔루션! 이 지표는 우리가 독점 기능과 비밀 공식을 통합했기 때문에 독특하고 고품질이며 저렴한 거래 도구입니다. 단 하나의 차트로 28개 통화 쌍 모두에 대한 경고를 제공합니다. 새로운 추세 또는 스캘핑 기회의 정확한 트리거 포인트를 정확히 찾아낼 수 있기 때문에 거래가 어떻게 개선될지 상상해 보십시오! 새로운 기본 알고리즘을 기반으로 구축되어 잠재적인 거래를 훨씬 더 쉽게 식별하고 확인할 수 있습니다. 이는 통화의 강세 또는 약세가 가속되는지 여부를 그래픽으로 표시하고 가속 속도를 측정하기 때문입니다. 자동차의 속도계처럼 생각하면 됩니다. 가속화할 때 Forex 시장에서 동일한 일이 분명히 더 빠르게 발생합니다. 즉, 반대 방향으로 가속화되는 통화를 페어링하면 잠재적으로 수익성 있는 거래를 식별한 것입니다. 통화 모멘텀의 수직선과 화살표가 거래를 안내합니다! 역동적인 Market Fibonacci 23
Up Down v6
Guner Koca
4.88 (8)
up-down indicator is no repaint and works all pairs and lower than weekly time frames charts. it is suitable also 1 m charts for all pairs. and hold long way to signal. dont gives too many signals. when red histogram cross trigger line that is up signal.and price probably will down when blue histogram cross trigger line that is down signal.and price probably will go up. when the signals not seen press + button on terminal . too see weekly chart because of low data on chart ,it needs to lower p
Currency Strength Wizard
Oleg Rodin
4.91 (44)
통화 강도 마법사는 성공적인 거래를 위한 올인원 솔루션을 제공하는 매우 강력한 지표입니다. 표시기는 여러 시간 프레임의 모든 통화 데이터를 사용하여 이 또는 해당 외환 쌍의 힘을 계산합니다. 이 데이터는 특정 통화의 힘을 확인하는 데 사용할 수 있는 사용하기 쉬운 통화 지수 및 통화 전력선의 형태로 표시됩니다. 필요한 것은 거래하려는 차트에 표시기를 부착하는 것뿐입니다. 표시기는 거래하는 통화의 실제 강세를 보여줍니다. 지표는 또한 추세와 거래할 때 유리하게 사용할 수 있는 구매 및 판매 거래량 압력의 극한값을 보여줍니다. 지표는 또한 피보나치에 기반한 가능한 대상을 보여줍니다. 표시기는 PUSH 알림을 포함한 모든 유형의 알림을 제공합니다. 구매 후 연락주세요. 나는 당신과 거래 팁을 공유하고 당신에게 무료로 훌륭한 보너스 지표를 줄 것입니다! 나는 당신에게 행복하고 유익한 거래를 기원합니다!
Matrix Arrow Indicator MT4
Juvenille Emperor Limited
5 (3)
매트릭스 화살표 표시기 MT4 는 외환, 상품, 암호 화폐, 지수, 주식과 같은 모든 기호/도구에 사용할 수 있는 100% 다시 칠하지 않는 다중 기간 표시기를 따르는 고유한 10 in 1 추세입니다.  Matrix Arrow Indicator MT4 는 다음과 같은 최대 10개의 표준 지표에서 정보와 데이터를 수집하여 초기 단계에서 현재 추세를 결정합니다. 평균 방향 이동 지수(ADX) 상품 채널 지수(CCI) 클래식 하이켄 아시 캔들 이동 평균 이동 평균 수렴 발산(MACD) 상대 활력 지수(RVI) 상대 강도 지수(RSI) 포물선 SAR 스토캐스틱 오실레이터 윌리엄스의 백분율 범위 모든 지표가 유효한 매수 또는 매도 신호를 제공하면 강력한 상승/하락 추세를 나타내는 다음 캔들/막대가 시작될 때 해당 화살표가 차트에 인쇄됩니다. 사용자는 사용할 표시기를 선택하고 각 표시기의 매개변수를 개별적으로 조정할 수 있습니다. 매트릭스 화살표 표시기 MT4는 선택한 표시기에서만 정보를 수
PZ Trend Trading
PZ TRADING SLU
4.75 (4)
Trend Trading is an indicator designed to profit as much as possible from trends taking place in the market, by timing pullbacks and breakouts. It finds trading opportunities by analyzing what the price is doing during established trends. [ Installation Guide | Update Guide | Troubleshooting | FAQ | All Products ] Trade financial markets with confidence and efficiency Profit from established trends without getting whipsawed Recognize profitable pullbacks, breakouts and early reversals The ind
Full Forex Market View Dashboard
Opengates Success International
5 (2)
전체 외환 시장 보기 대시보드 표시기 이것은 거래자에게 시장에서 일어나는 일에 대한 전체 보기를 제공하기 위해 만들어진 사용자 지정 지표입니다. 실시간 데이터를 사용하여 시장에 액세스하고 성공적인 거래에 필요한 모든 정보를 표시합니다. 설치: 이 지표를 창 차트에 첨부하기 전에 MT4의 Market Watch 패널로 이동하여 필요하지 않거나 거래하지 않는 모든 통화 쌍을 숨기고 나머지는 그대로 두십시오. 그 이유는 FFMV 대시보드가 MT4의 Market Watch에 나타나는 모든 통화 쌍을 표시하기 때문입니다. 최대 30개 이하의 통화 쌍을 표시할 수 있습니다. MT4의 Market Watch에서 그 이상이면 FFMV 대시보드의 글꼴과 이미지가 흐려지고 변형됩니다! 제대로 표시되지 않습니다. 용법:      솔로 트레이딩      바구니 거래의 경우(방법에 대한 스크린샷 참조)      다중 주문 거래에도 사용할 수 있습니다.      자신의 거래
제작자의 제품 더 보기
These indicators are suitable for scalper tradition. At least 5-10 pips of income should be targeted. The stop should be at least 11 pips. It is suitable to be used in brokers with not much spread. This indicator is used to determine the trend percentage. Trend direction is made in color. It has the indicator warning system: beep, e-mail and has three types of alerts, including messages to mobile phone. The position can be in 4 different corners of the screen. When trend value reaches the value
You can fins our other products from link : https://www.mql5.com/en/users/drbastem/seller   Also, you can ask all your questins from email : haskayafx@gmail.com or mobile : +90 530 867 5076 or @MehmetBastem    on telegram application This indicator is used to determine the trend. Standard Osma indicator is used. It has the indicator warning system: beep, e-mail and has three types of alerts, including messages to mobile phone. It shows the best performance on the chart of 5 minutes. When the
You can fins our other products from link : https://www.mql5.com/en/users/drbastem/seller   Also, you can ask all your questins from email : haskayafx@gmail.com or mobile : +90 530 867 5076 or @MehmetBastem    on telegram application This indicator is used to determine the trend. Standard Three Moving Average and ADX indicators are used. It has the indicator warning system (audio, e-mail) and three types of alerts, including messages to mobile phone. It shows the best performance on M5. When
This indicator is used to determine the trend. Standard Three Moving Average and ADX indicators are used. It has the indicator warning system (audio, e-mail) and three types of alerts, including messages to mobile phone. It shows the best performance on M5. When the trend value reaches the value set, the warning system is activated. This indicator works only with Forex symbols. Inputs SoundAlarm = true - Sound Alert Sendmail=true - Send an e-mail in case of a buy or sell signal Sendnotificatio
You can fins our other products from link : https://www.mql5.com/en/users/drbastem/seller   Also, you can ask all your questins from email : haskayafx@gmail.com or mobile : +90 530 867 5076 or @MehmetBastem    on telegram application This indicator is used to determine the trend. Standard MACD indicator is used. It has the indicator warning system: beep, e-mail and has three types of alerts, including messages to mobile phone. It shows the best performance on the chart of 5 minutes. When the
You can fins our other products from link : https://www.mql5.com/en/users/drbastem/seller   Also, you can ask all your questins from email : haskayafx@gmail.com or mobile : +90 530 867 5076 or @MehmetBastem    on telegram application  This indicator uses standard Bollinger’s bands and two moving average,  it is providing trustable signal based on difference between Top and Bottom limit of Bollinger bands,   moving average trend degree within the Bollinger band zone. Signals are shown as arrow
This indicator is producing accurate signal based on distances between crossection     point of 571 period moving average with 632 period bollinger band and 17 moving average and 171 moving average.     You can also use this signal with expert advisor with below code      double v1= 0 ;     v1= GlobalVariableGet ( Symbol ()+ string ( Period ())+ "HSKPASHAVO1" );      if (v1== 0 )   return ( 0 ); // No Signals      if (v1== 1 )        {        //Send BUY Order...        GlobalVariableSet ( Symbo
You can fins our other products from link : https://www.mql5.com/en/users/drbastem/seller   Also, you can ask all your questins from email : haskayafx@gmail.com or mobile : +90 530 867 5076 or @MehmetBastem    on telegram application This system created by using Corrected MACD, Different time zone support and resistant points,  Parabolic Sars, Bollinger band, 4 moving average, stochastic oscillator and ADX. In this system, Using parabolic Sars reverse bar count,  Pips difference between clo
This indicator prepared by using 57 days moving averagr and least square method. It can only work for 1 hr time interval. Once a signal created. It is creating order and 2 limit orders. It works in CFD pairs as well as in Forex pairs. You can fins our other products from link : https://www.mql5.com/en/users/drbastem/seller Also, you can ask all your questins from email : haskayafx@gmail.com or mobile : +90 530 867 5076 or @MehmetBastem on telegram application This system is for Long term and pr
This system created by using Corrected MACD,ADX, Different time zone support and resistant points,  Parabolic Sars, Bollinger band, 9 moving average, stochastic oscillator and ADX. In this system, Using parabolic Sars reverse bar count,  Pips difference between closing price and last parabolic Sars in the direction of signal and Trend strength.   Note that this system is not martingale, this system is creating limit order.    Best result for the orders are 25 Pips in USD, 50 Pips in GBP. Best
This system created by using Corrected MACD,ADX, Different time zone support and resistant points,  tree Parabolic Sars,two Bollinger band, 3 moving average, stochastic oscillator and ADX. In this system, Using parabolic Sars reverse bar count,  Pips difference between closing price and last parabolic Sars in the direction of signal and Trend strength.   Note that this system is not martingale, this system is creating limit order.    Best result for the orders are 45 Pips in USD, 75 Pip
This system created by using  Stochastic oscillator and moving average.  Entrance value and take profit values can be seen by system.  This is system for Long term and profitable. this system can be used for 15 minutes time frame. This system is not  repaints.         This system is for Long term and profitable.  Signals are shown as arrows. as an optional,  you can set a voice alarm or email notification  You can fins our other products from link : https://www.mql5.com/en/users/drbastem/seller
This indicator prepared by using 311,1298 days moving average and Calculates the Envelopes.    This system can be used for 5M time frame.     This system is for Long term and profitable.    Signals are shown as arrows. as an optional,    you can set a voice alarm or email notification    You can fins our other products from link : https://www.mql5.com/en/users/drbastem/seller    Also, you can ask all your questins from email : haskayafx@gmail.com or mobile : +90 530 867 5076 or @MehmetBastem   
This indicator prepared by using 1311,2840 days moving average and Calculates the Envelopes.    This system can be used for 15M time frame.     This system is for Long term and profitable.    Signals are shown as arrows. as an optional,    you can set a voice alarm or email notification    You can fins our other products from link : https://www.mql5.com/en/users/drbastem/seller    Also, you can ask all your questins from email : haskayafx@gmail.com or mobile : +90 530 867 5076 or @MehmetBastem
This indicator prepared by using 311,1298 days Haskaya Trend Bandse and Calculates the strand ADX.    This system can be used for 5M time frame.     This system is for Long term and profitable.    Signals are shown as arrows. as an optional,    you can set a voice alarm or email notification    You can fins our other products from link : https://www.mql5.com/en/users/drbastem/seller    Also, you can ask all your questins from email : haskayafx@gmail.com or mobile : +90 530 867 5076 or @Meh
This indicator prepared by using 3 EMA,3 Bollinger Bands and Calculates the Volumes.    This system can be used for 5M time frame.     This system is for Long term and profitable.    Signals are shown as arrows. as an optional,    you can set a voice alarm or email notification    You can fins our other products from link : https://www.mql5.com/en/users/drbastem/seller    Also, you can ask all your questins from email : haskayafx@gmail.com or mobile : +90 530 867 5076 or @MehmetBastem     on t
This indicator prepared by  using Envelopes, Bollingers Bands, ADX and RSI .    This system can be used for 5M time frame.     This system is for Long term and profitable.    Signals are shown as arrows. as an optional,    you can set a voice alarm or email notification    You can fins our other products from link : https://www.mql5.com/en/users/drbastem/seller    Also, you can ask all your questins from email : haskayafx@gmail.com or mobile : +90 530 867 5076 or @MehmetBastem     on telegram
This indicator is created by considering volume divergence with price that is outcome of Bollinger band and Envolpes indicators crossing. It won’t repaint.  It is providing 1 market and three pending orders.  If it is followed with patient, it is providing remarkable profit at the end.  This indicator will be on sale soon on expert advisor. Target is calculated for buy orders as follow 1. 50 pips standard 2. Top Bollinger band 3. Sell Signal Target is calculated for buy orders as follow 1. 50
https://youtu.be/t3SLLgcEEPM This indicator prepared by  using Moving Averages, Bollingers Bands .    This system can be used for 5M time frame and Gold Symbols (XAUUSD).     This system is for Long term and profitable.    Signals are shown as arrows. as an optional,    you can set a voice alarm or email notification    You can fins our other products from link : https://www.mql5.com/en/users/drbastem/seller    Also, you can ask all your questins from email : haskayafx@gmail.com or mobile : +90
This indicator prepared by  using Haskayafx Target Line Indicators .    This system can be used for 30M time frame and All Symbols.     This system is for Long term and profitable.    Signals are shown as arrows. as an optional,    you can set a voice alarm or email notification    You can fins our other products from link : https://www.mql5.com/en/users/drbastem/seller    Also, you can ask all your questins from email : haskayafx@gmail.com or mobile : +90 530 867 5076 or @MehmetBastem 
This indicator is only working in M1 period.it is predicting end of horizantal trend by using envolepes indicator.   After takeprofit predicted, this indicator will open 4 orders as buy and sell.   One of the order is market type, others are limit type.   There are 25.5 and 70 pips range between these limit type orders.   After  market type order reach its target other limit orders will be deleted automatically.   Note that this system is not martingale, this system is creating limit order.   T
This system never paints.   This system created by using Envolpes bands and reverse bar count.   This indicator is only working in M5 period.   This system is for long term and profitable.   Signals are shown as arrows. as an optional limit orders.   You can set a voice alarm or email notification.   You can fins our other products from link : https://www.mql5.com/en/users/drbastem/seller   Also, you can ask all your questins from email : haskayafx@gmail.com or mobile : +90 530 867 5076 or @Meh
T his system never paints.   This system created by using Calculates the Standard Deviation indicator.   This indicator is only working in M1 period.   This system is for short term and profitable.   BUY and SELL Orders Target is 30 Pipes.     When the Market Order Reaches the Target or an order in the Reverse Direction is opened, the Pending Limit order is Closed.   Signals are shown as arrows. as an optional limit orders.   You can set a voice alarm or email notification.   You can fins our
This system never paints.   This system uses 30 standard MT4 indicators.   This indicator is only working in M5 period.   This system is for long term and profitable.   Signals are shown as arrows. as an optional limit orders.   You can set a voice alarm or email notification.   You can fins our other products from link : https://www.mql5.com/en/users/drbastem/seller   Also, you can ask all your questins from email : haskayafx@gmail.com or mobile : +90 530 867 5076 or @MehmetBastem    on teleg
This system never paints.   This system created by using Envolpes bands and parabloic Sars.   This indicator is only working in M5 period and EURUSD Symbol.   This system is for long term and profitable.   Signals are shown as arrows. as an optional limit orders.   You can set a voice alarm or email notification.   You can fins our other products from link : https://www.mql5.com/en/users/drbastem/seller   Also, you can ask all your questins from email : haskayafx@gmail.com or mobile : +90 530 8
필터:
리뷰 없음
리뷰 답변
버전 1.2 2020.01.02
Alarm improvements