Trade history MT4
- 지표
- Andriy Konovalov
- 버전: 1.3
- 업데이트됨: 5 6월 2021
- 활성화: 5
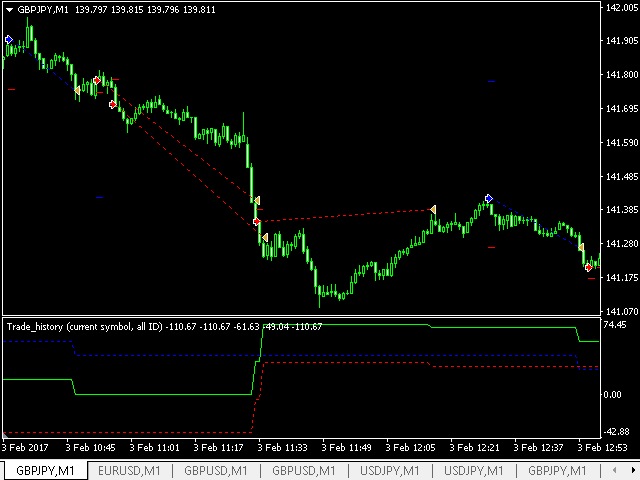
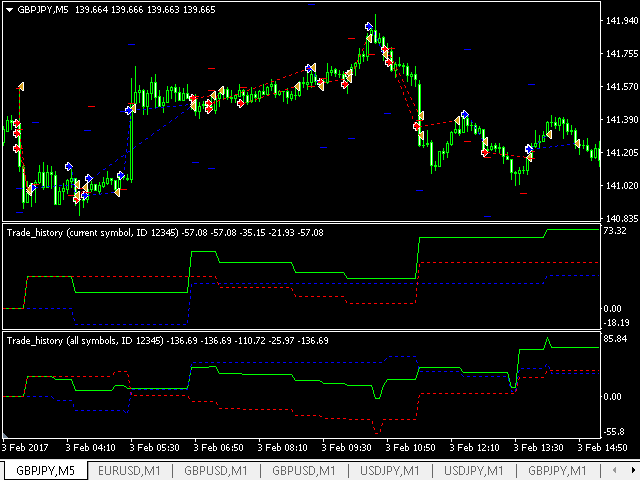
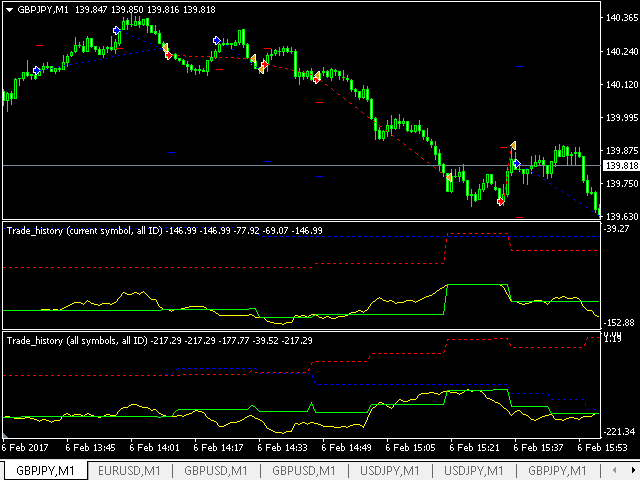
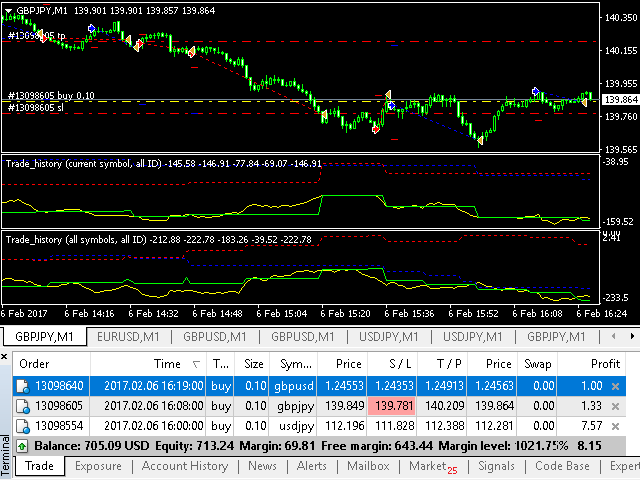
The indicator plots charts of profit taken at the Close of candles for closed (or partially closed) long and short orders individually. The indicator allows to filter orders by the current symbol, specified expert ID (magic number) and the presence (absence) of a substring in a order comment, to set the start time and the periodicity of profit reset (daily, weekly or monthly) to calculate the profit chart. The indicator also displays the floating (not fixed) profit of the opened orders at the candle closure (only from the moment of initializing indicator).
The indicator works with any timeframes and instruments. It can be useful for analysis of efficiency of multiple experts trading on different symbols and directions on one account from a certain point of time.
The available history of orders fixing a profit is used to plot charts of the fixed profit. To allow the indicator to display the full trading history, it is necessary to select the "All History" option in the context menu of the "Account History" tab before starting the indicator.
Additional features of new versions of the indicator are described in the What's New tab.
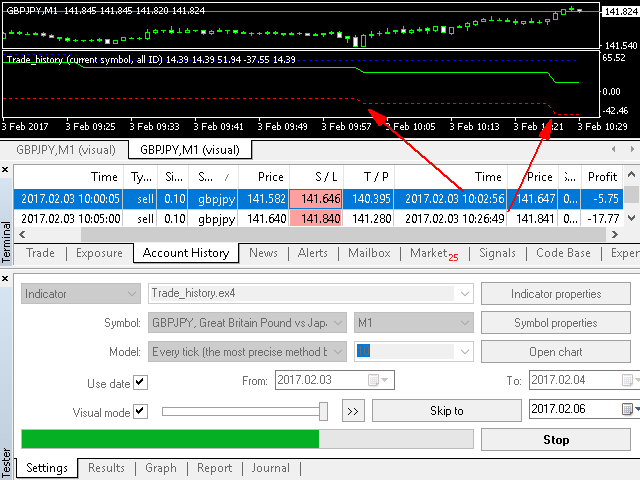
Indicator operation in the strategy tester
You can test the operation of the indicator for free in the tester of the MetaTrader 5 terminal by downloading a demo version of the indicator. In testing mode, the indicator always displays the trading history of the real or demo account from the "Account History" tab of the "Terminal" window, and not the history of trading during the test from the "Results" tab of the "Tester" window (see the last screenshot for this description).
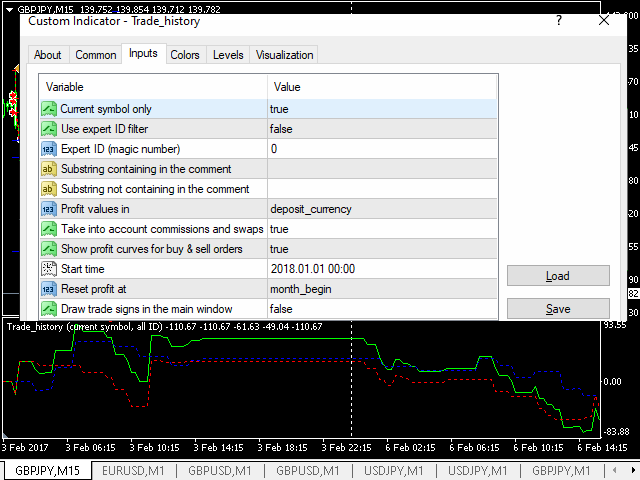
Indicator Parameters
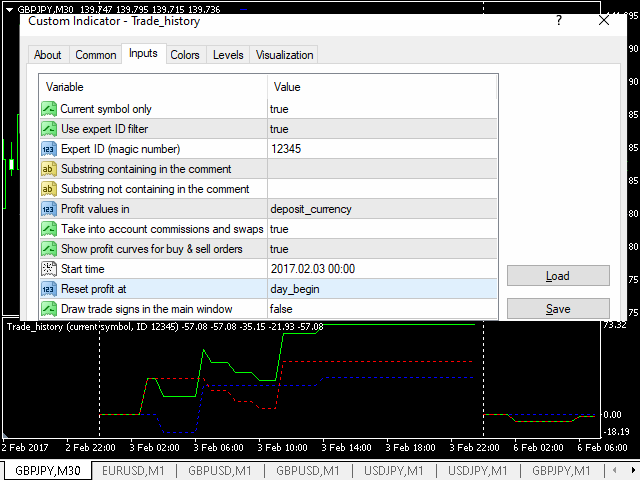
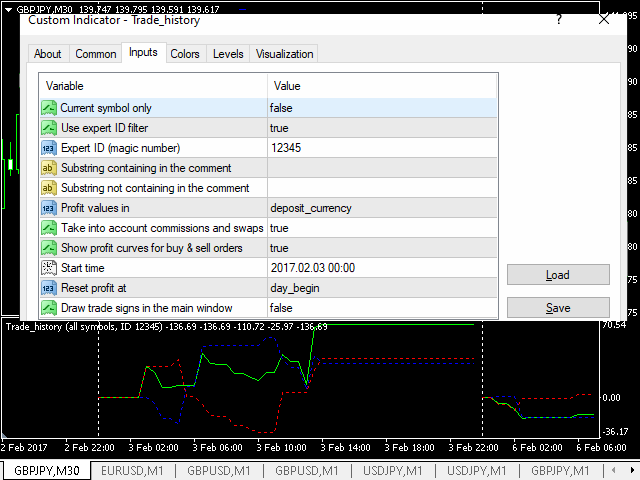
- Current symbol only - boolean parameter (true/false), indicating the need for filtering orders by the current symbol.
- Use expert ID filter - boolean parameter (true/false), indicating the need for filtering orders by expert advisor ID (magic number).
- Expert ID (magic number) - expert advisor ID (integer) which is used in filtering orders by expert ID (for manual trading expert ID equals 0). This parameter is not used when the Use expert ID filter option is set to false.
- Substring containing (not containing) in the comment - a substring that must (not) be contained in order comments (case sensitive and including all spaces). An empty string disables filtering of orders by the presence (absence) of a substring in the comments.
- Profit values in - selection of profit units (deposit currency, percentage of start balance, points).
- Take into account commissions and swaps - boolean parameter (true/false), indicating the need for accounting of commission and swap of orders when calculating profit in units of deposit currency or percentage of balance.
- Show profit curves for buy & sell orders - boolean parameter (true/false), indicating the need to display separate charts of fixed profit for long and short orders.
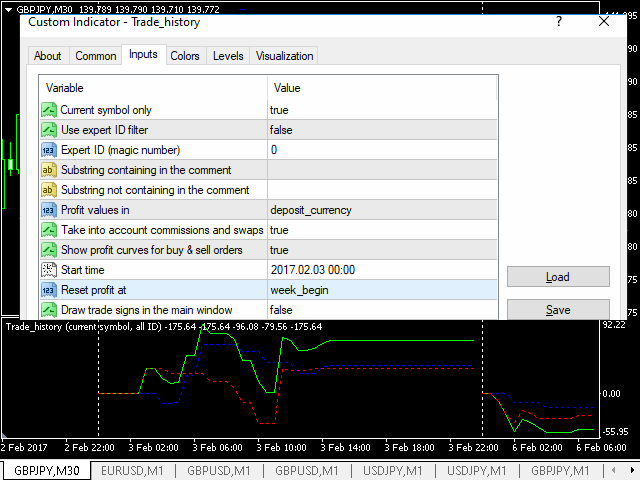
- Start time - date & time parameter, specifying the initial time moment for calculating charts of profit.
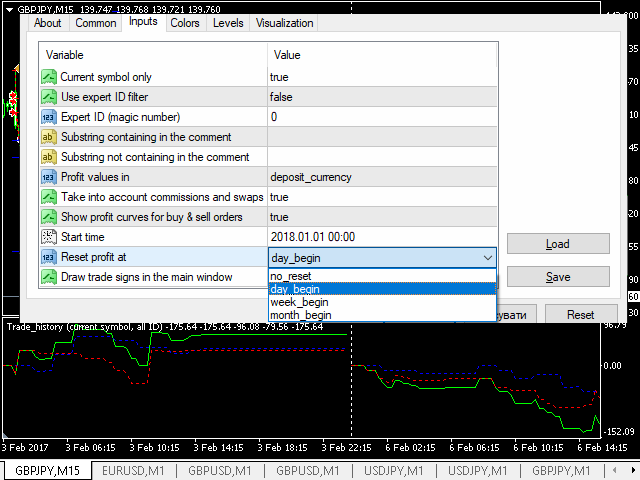
- Reset profit at - parameter of enumeration type with the values no_reset, day_begin, week_begin, month_begin. It indicates the need for daily, weekly or monthly reset of profits.
- Draw trade signs in the main window - the need for drawing trade signs in the main window of a current chart.
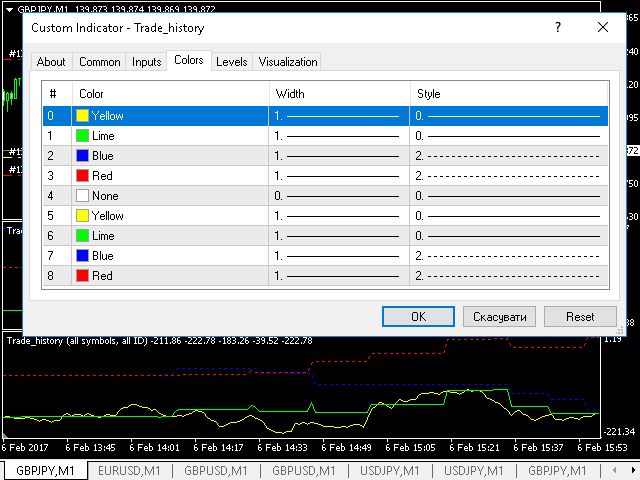
The indicator graphic series (lines)
- Floating profit - line (solid yellow by default) showing floating (not fixed) profit of orders opened according to the filter settings at the candle closure since the indicator was launched. The indicator buffers 0 and 5 are used to plot this line.
- Fixed profit - line (solid lime by default) showing fixed profit at the candle closure for closed (or partially closed) long and short orders according to the filter settings. The indicator buffers 1 and 6 are used to plot this line.
- Fixed profit (buy) and Fixed profit (sell) - lines (dotted blue and red by default) showing fixed profit at the candle closure for closed (or partially closed) long orders according to the filter settings. These lines are not visible when the Show profit curves for buy & sell orders option is set to false. The indicator buffers 2, 7 and 3, 8 are used to plot these lines.
- Invisible service buffer - hidden auxiliary buffer 4 which should be ignored.


Great Tool, i see fast which Pairs of my Basket get worse or better.....