Moving Average Scanner MT4
- 지표
- Frederic Jacques Collomb
- 버전: 1.0
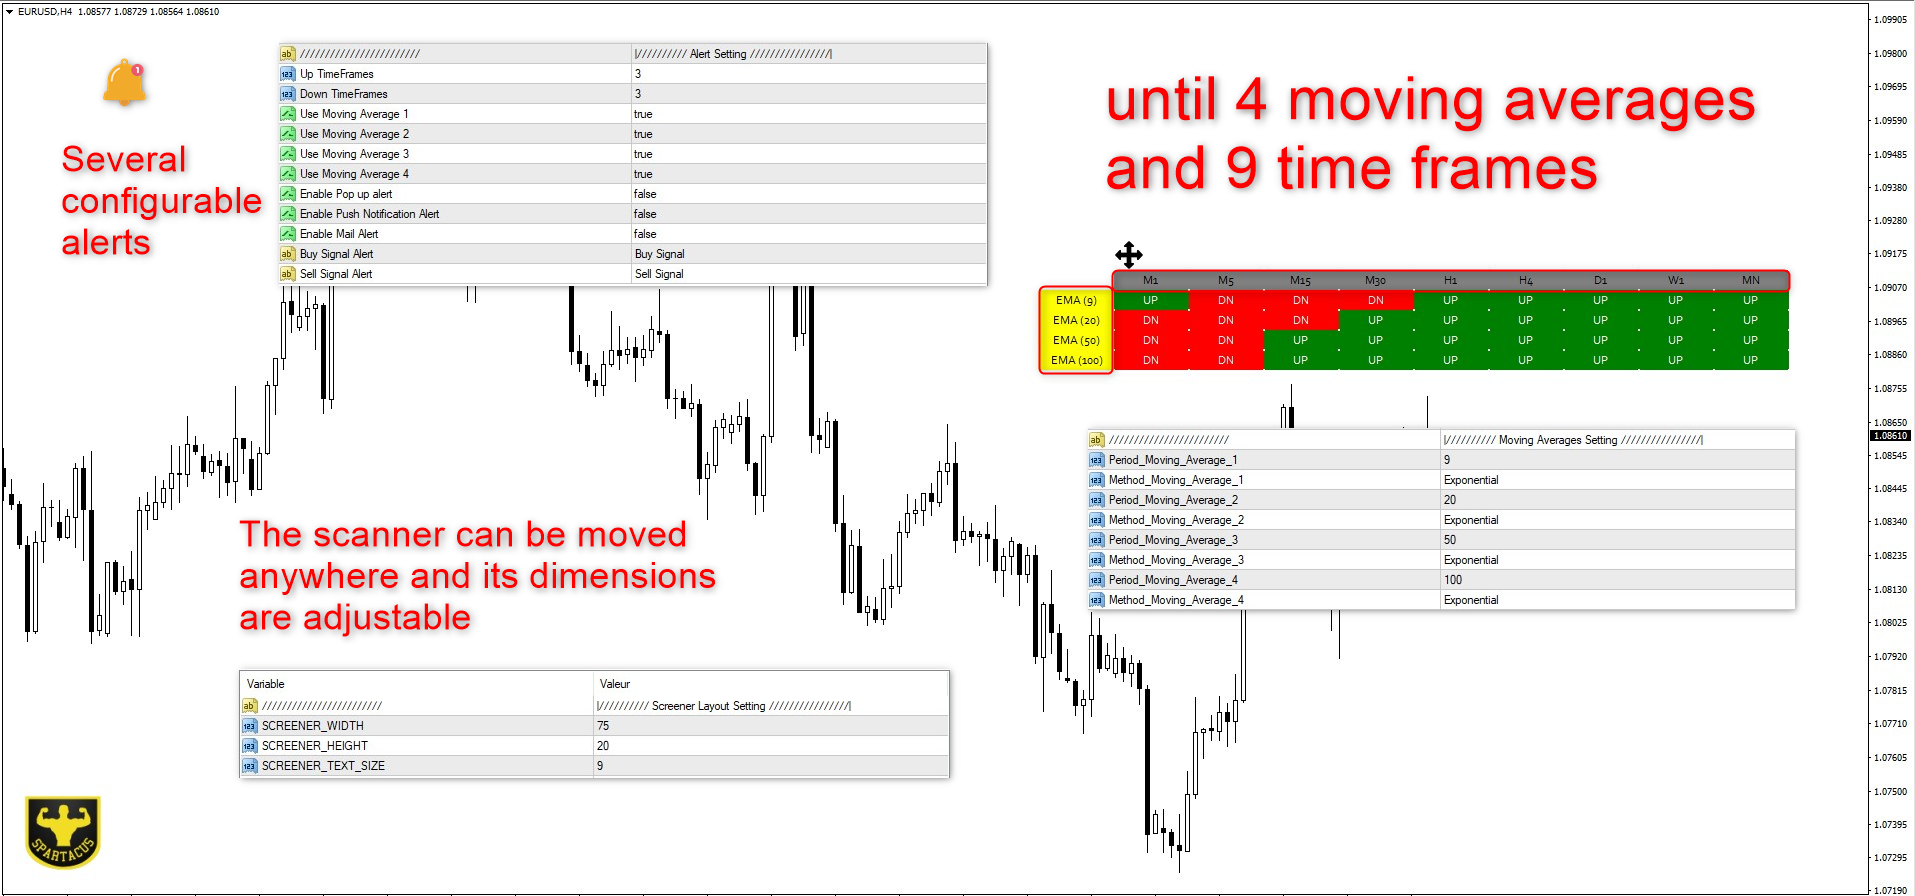
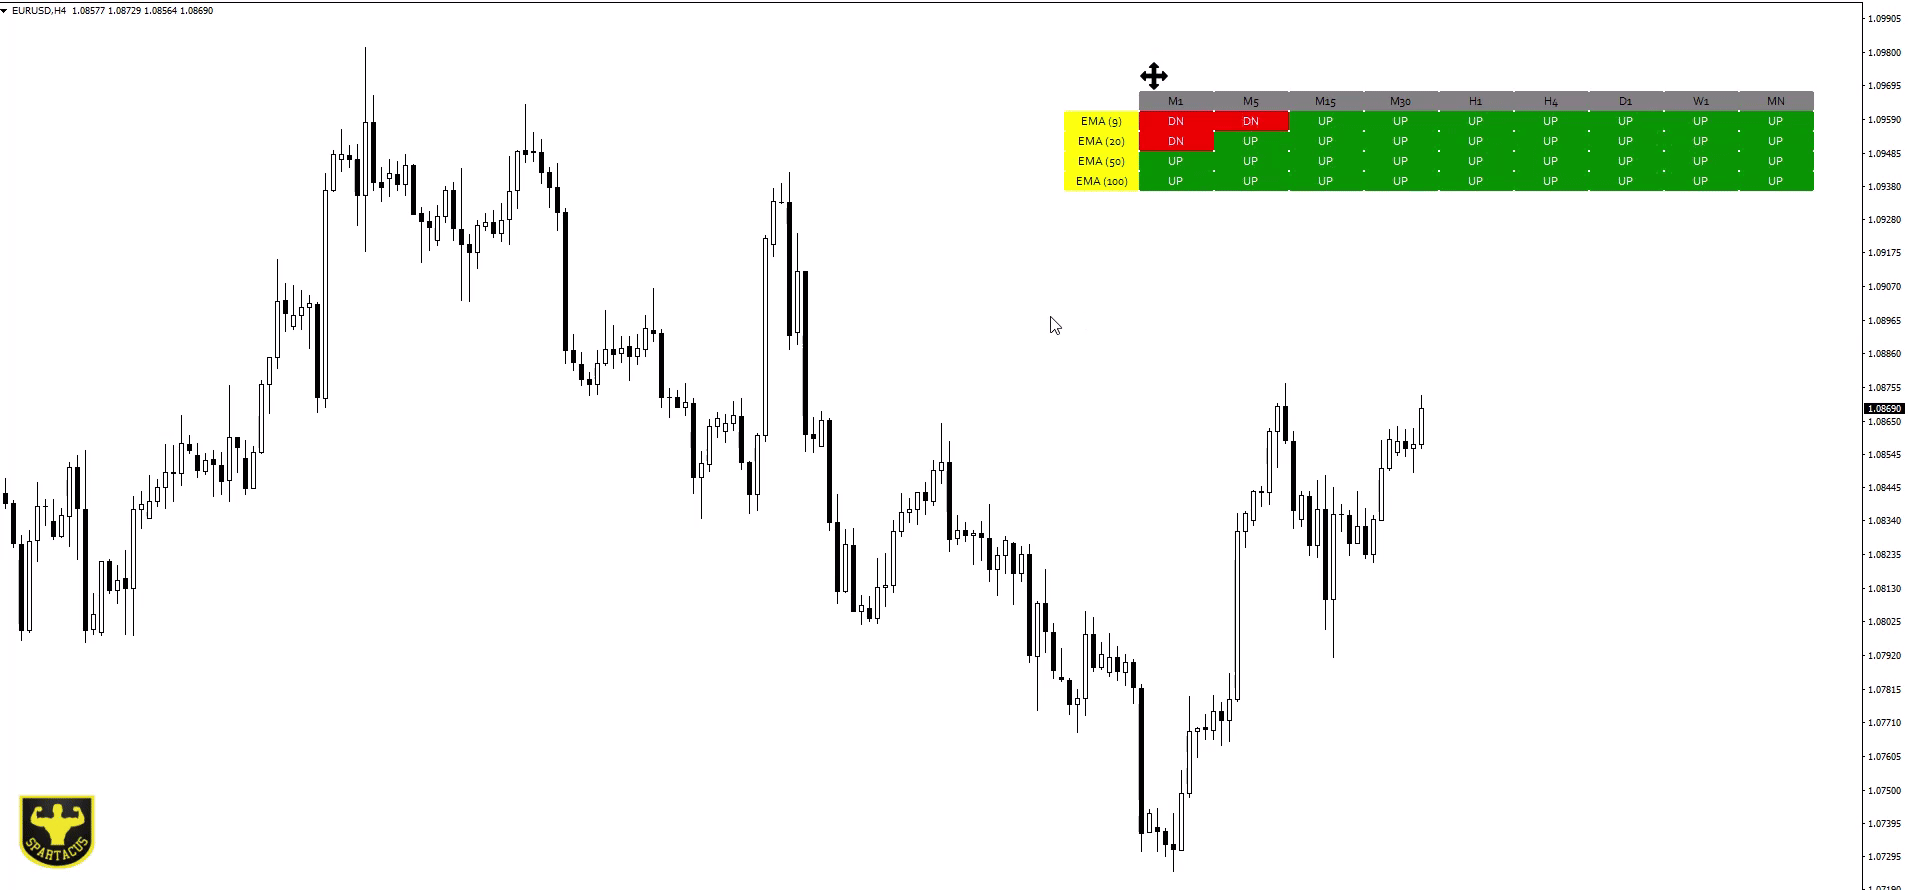
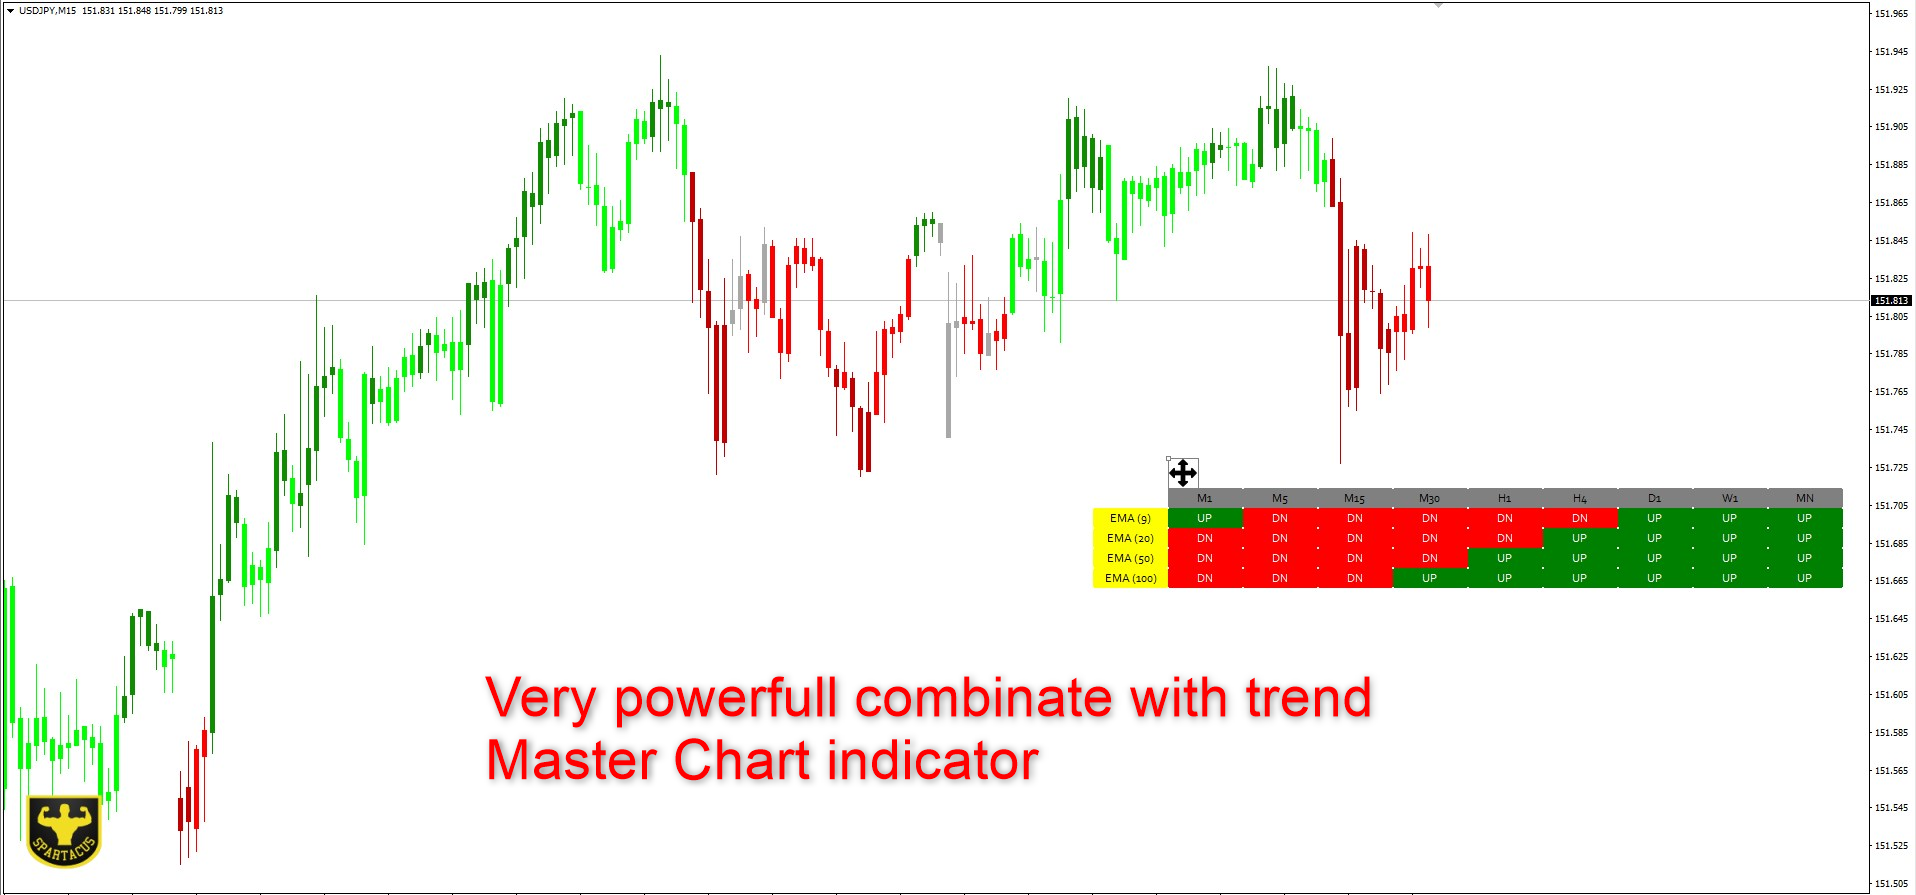
이동 평균 스캐너는 차트를 변경하지 않고도 여러 시간대에 걸친 추세를 한 눈에 볼 수 있는 완벽한 다중 시간대 스캐너입니다.
9개 시간 단위에 걸쳐 원하는 이동 평균을 최대 4개까지 사용할 수 있습니다. 완전히 구성 가능하며 간단히 "드래그 앤 드롭"만으로 그래프의 어느 곳으로든 이동할 수 있습니다.
이동 평균은 4가지 계산 방법으로 구성할 수 있습니다. 이동 평균 수와 기간 수를 기준으로 알림을 설정할 수도 있습니다.
입력 매개변수:
스크리너 레이아웃:
그래프에 표시되는 스캐너의 크기와 표시 텍스트의 크기를 원하는 대로 조정할 수 있습니다.
이동 평균:
4가지 이동 평균 기간과 4가지 계산 방법(단순/지수/평활 및 선형 가중)을 구성할 수 있습니다.
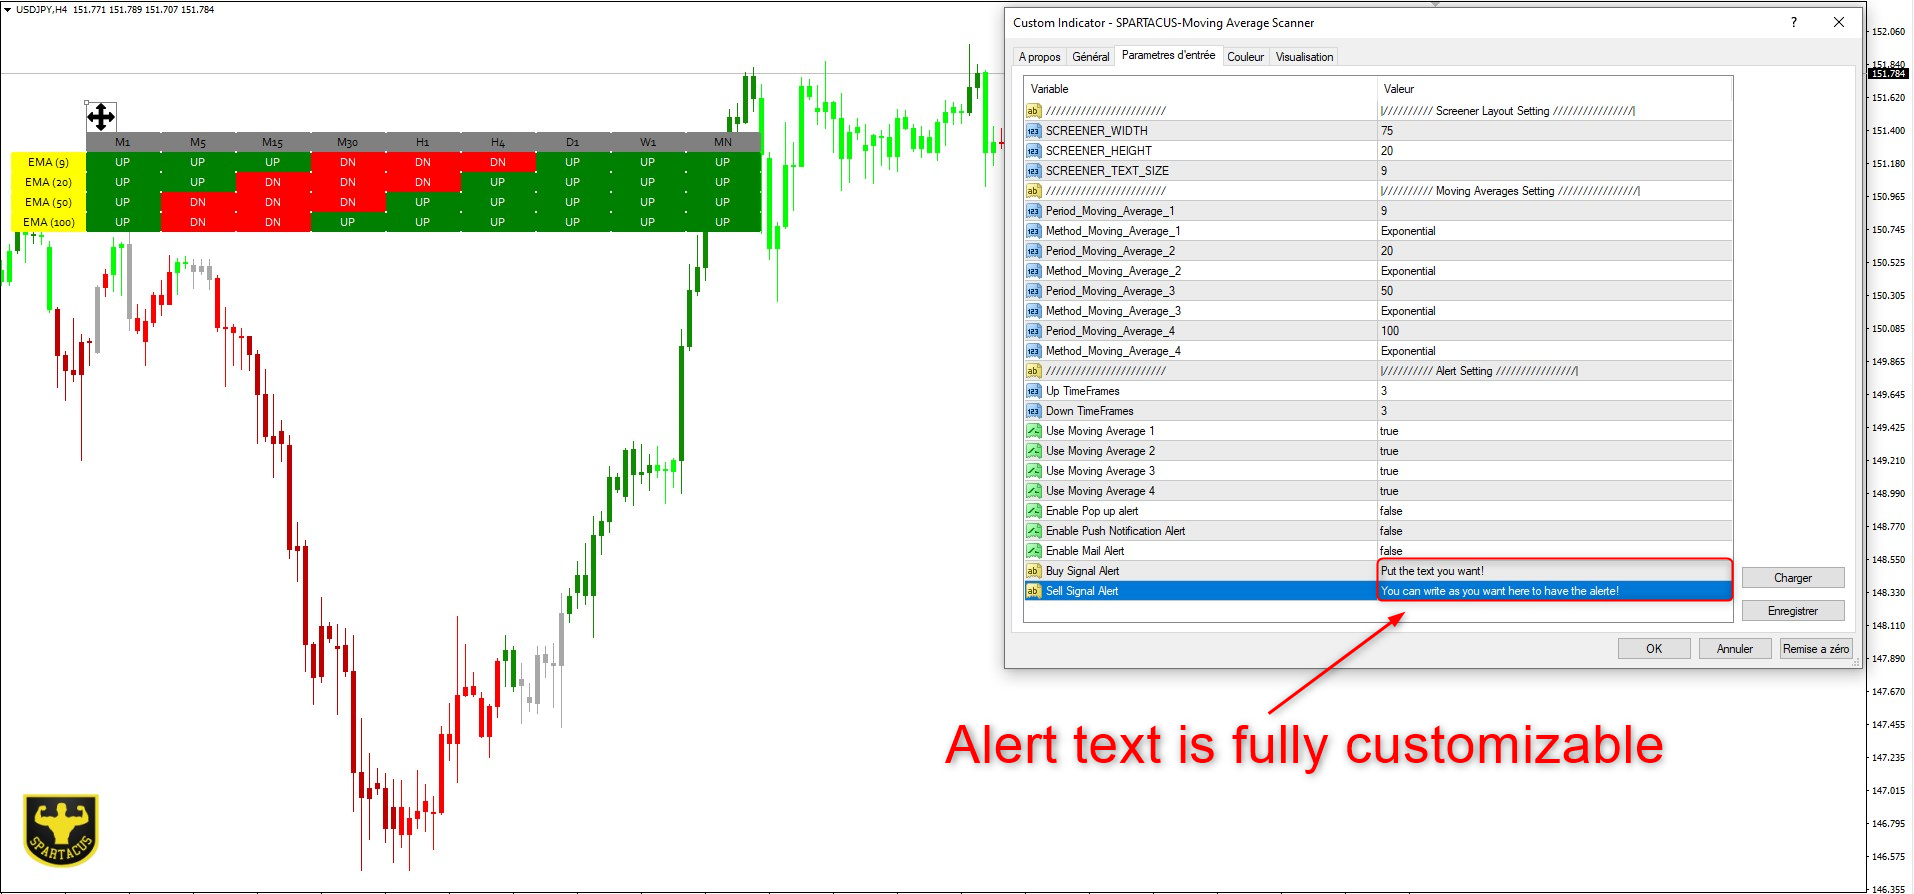
경고:
경고를 설정하려면 경고를 트리거하기 위해 선택한 이동 평균과 결합하여 원하는 기간(강세/약세) 수를 선택하기만 하면 됩니다.
팝업/푸시 알림 및 메일로 알림이 가능합니다. 경고 텍스트는 완전히 사용자 정의할 수 있습니다.
SPARTACUS©2024