Keltner Enhanced
- 지표
- David Ben Svaiter
- 버전: 2.0
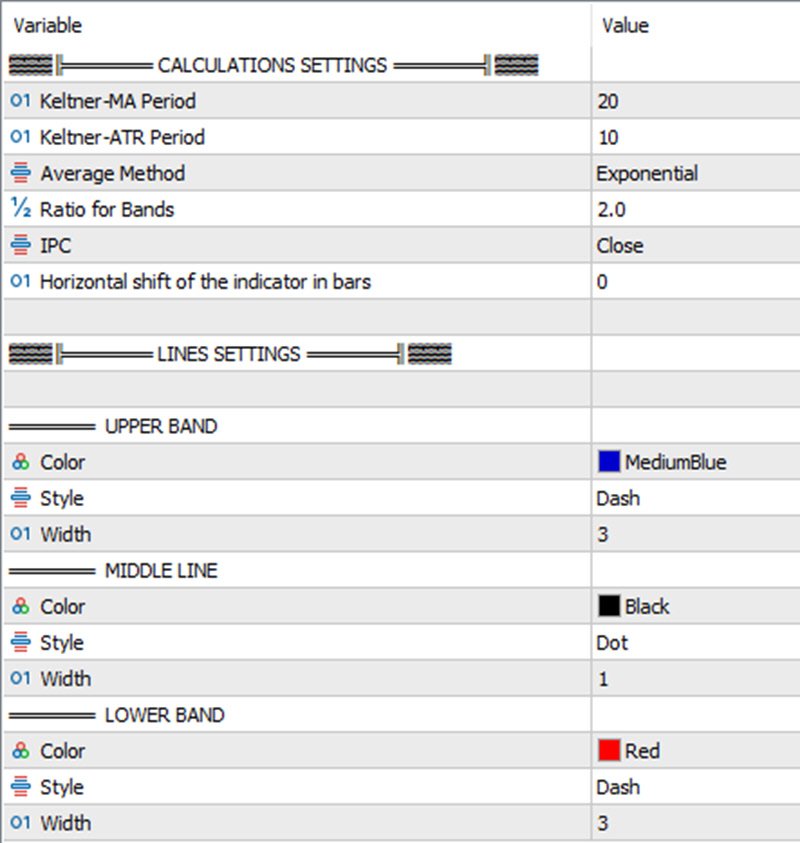
Keltner-Enhanced improves the accuracy and readability of Keltner Channels with many options for adjusting them and more five price calculations beyond the META default.
The Keltner-E indicator is a banded indicator similar to Bollinger Bands and Moving Average Envelopes. They consist of an upper envelope above a midline and a lower envelope below the midline.
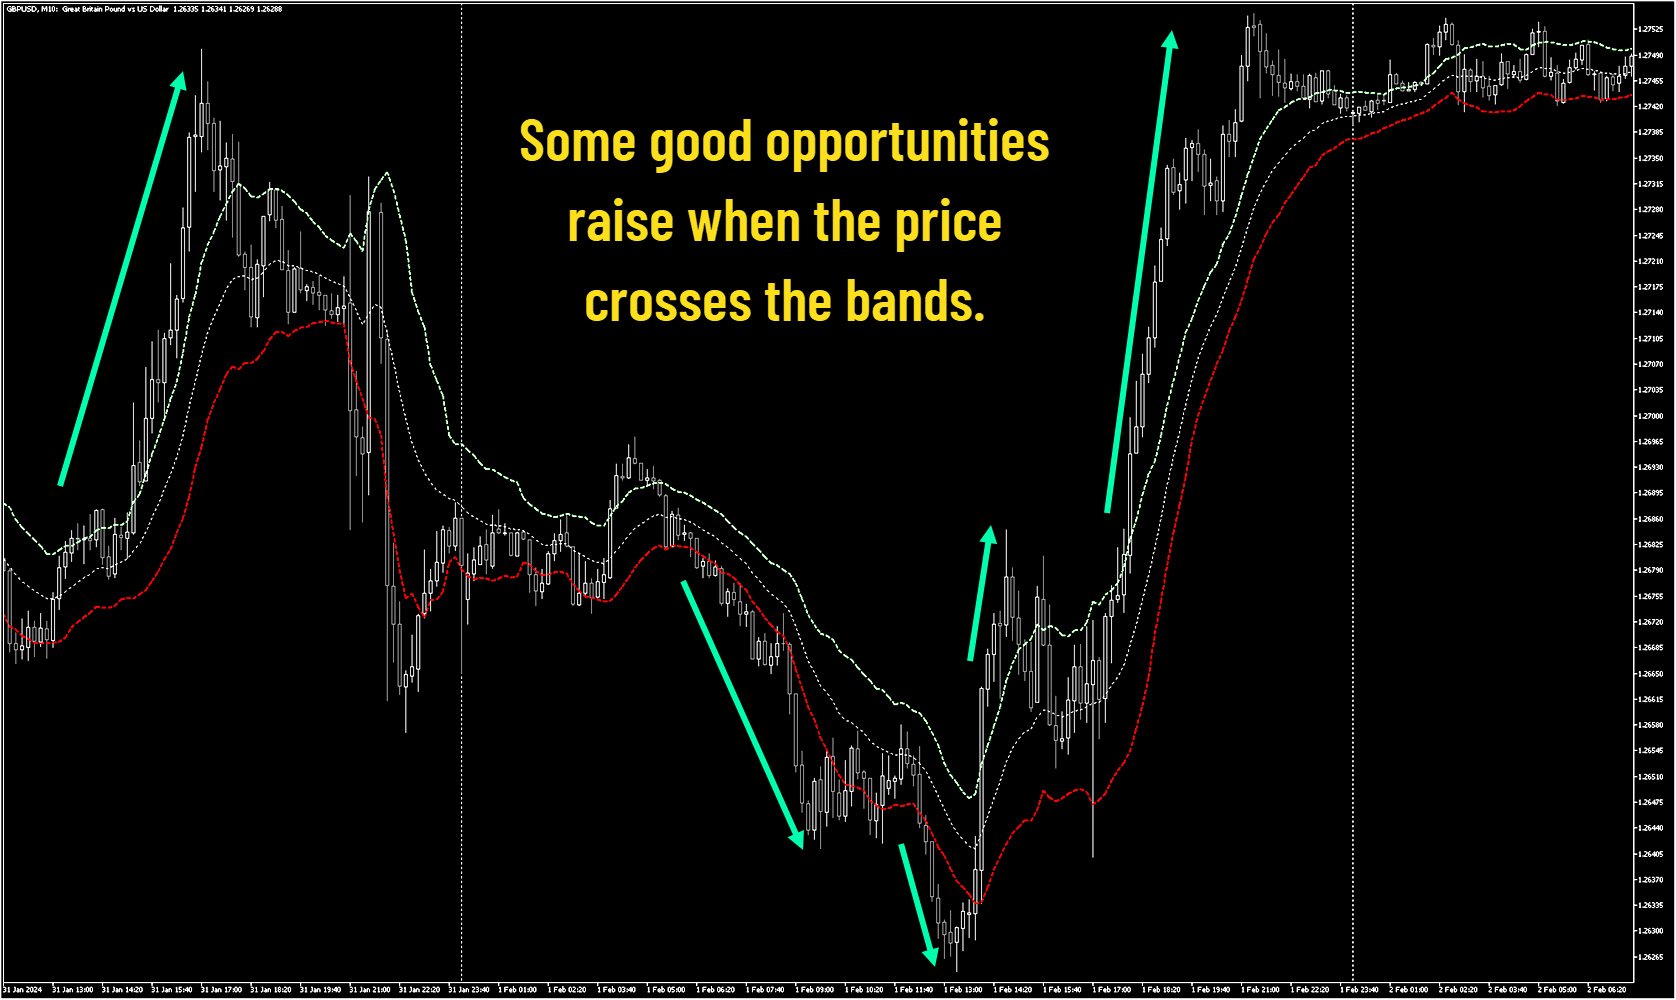
The main occurrences to look out for when using Keltner Channels are breakouts above the Upper Envelope or below the Lower Envelope. A breakout above the Upper Envelope signifies overbought conditions. A break below the Lower Envelope means oversold conditions.
However, when using Keltner Channels, keep in mind that overbought and oversold conditions are often a sign of strength.
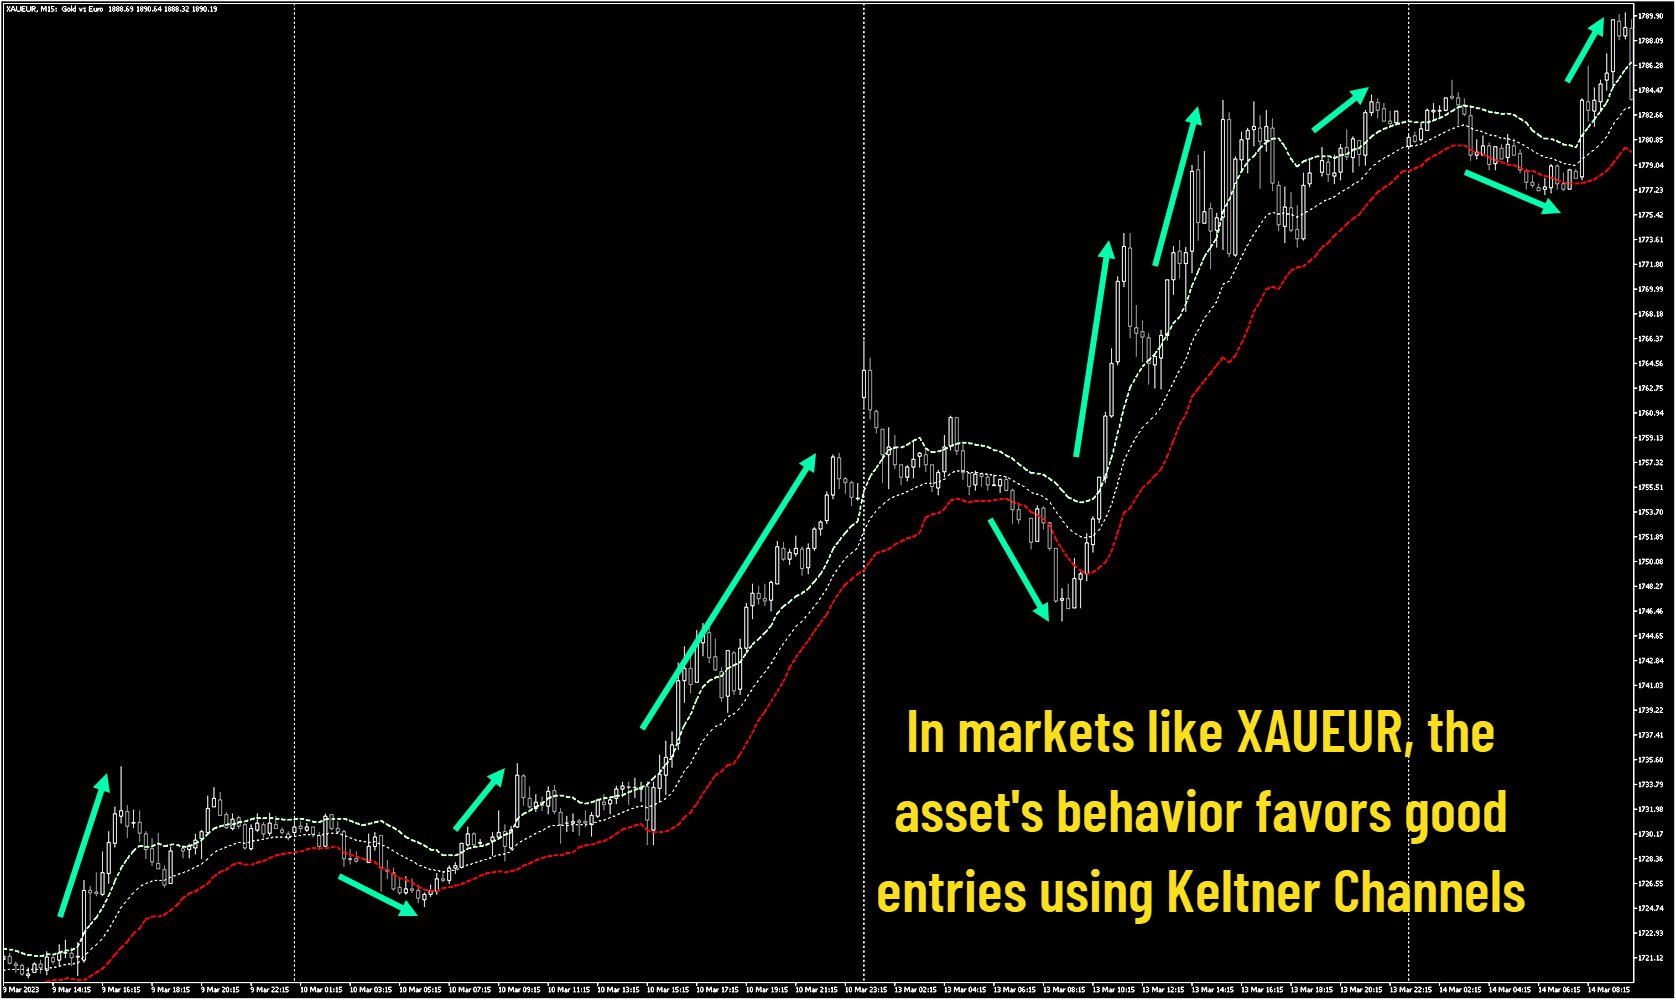
During a clearly defined trend, overbought and oversold conditions can signify strength. In this case, the current trend would strengthen and ultimately continue. This works a little differently in a sideways market. When the market is in a sideways trend, overbought and oversold readings are often followed by a return movement of the price towards the moving average (midline).
I hope it's useful for you to make good trades.

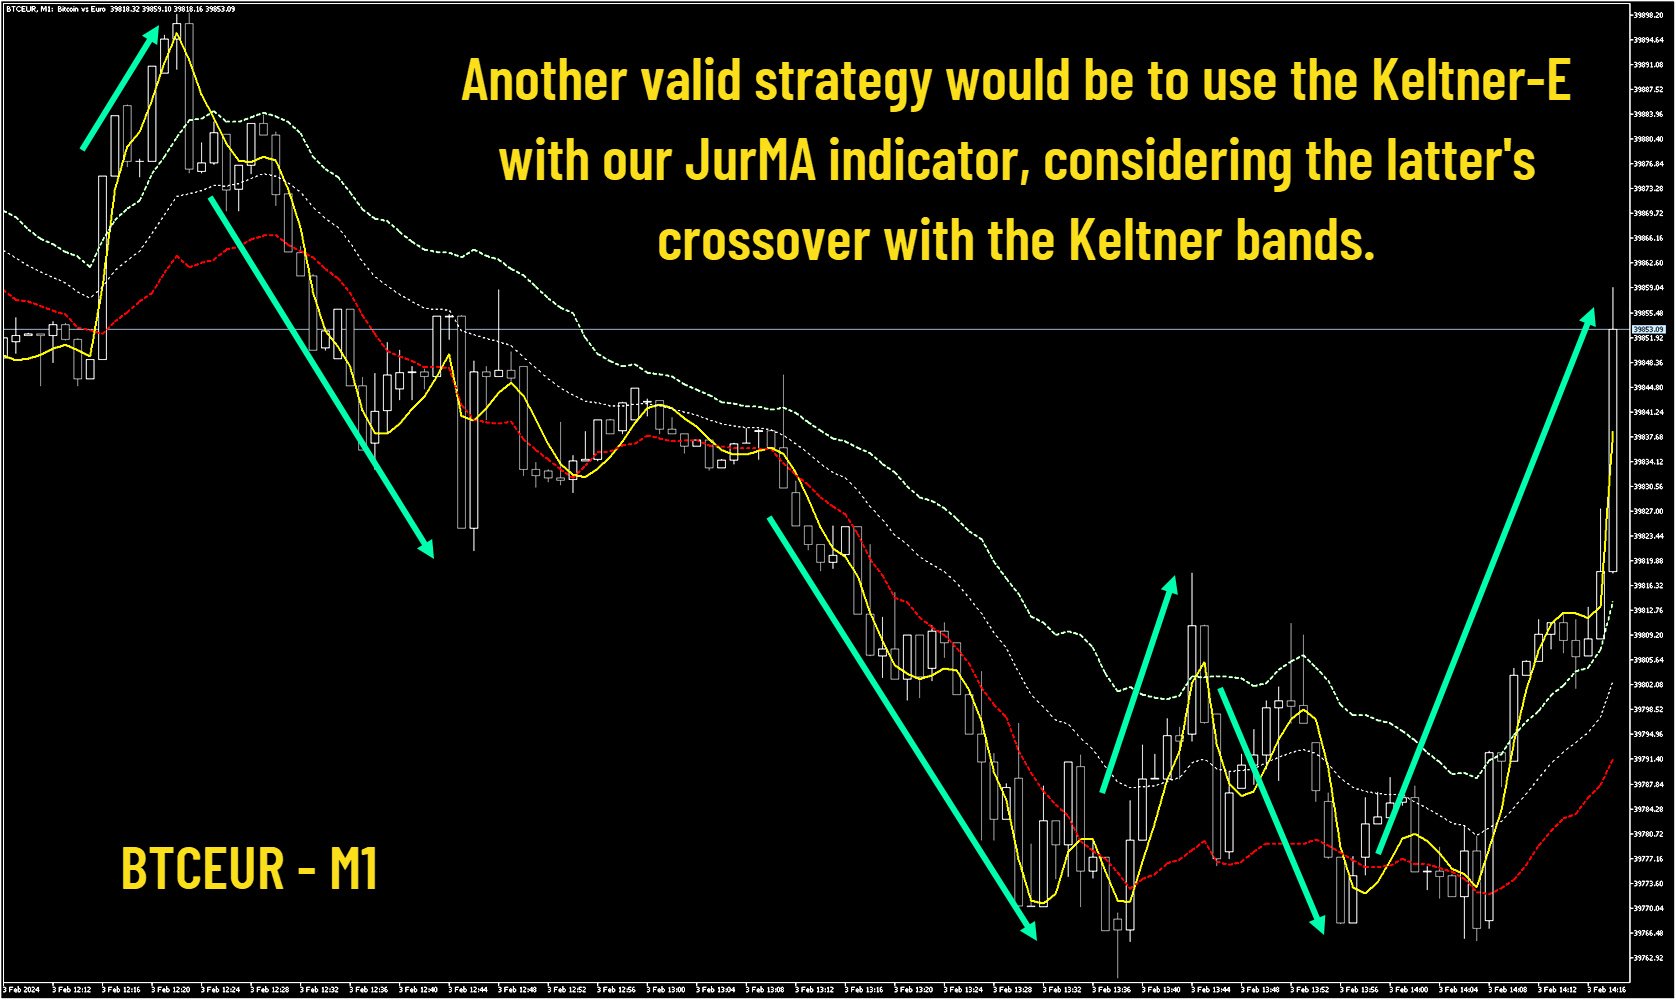

Excelente para tendencia... ainda mais se utilizado com uma media rapida para confirmar as entradas