MetaTrader 5용 Expert Advisor 및 지표 - 55
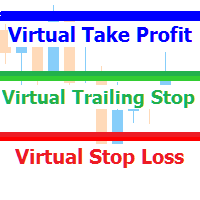
A utility for managing open positions using virtual (invisible to the broker) stops. Virtual stop loss and virtual take profit can be freely moved around the chart. If the price touches the virtual stop line (TP, SL, TS), the EA will close all orders of the same direction on the current chart. Closing orders by virtual take profit is possible only if there is a profit.
With the help of the built-in trading simulator, you can, in the strategy tester, see how the adviser works. Parameters Block
This EA trades with the trend using several methods to identify and enter a trade. For example, it uses trendlines, Gator and Stochastic indicators to analyze the market. In addition to trading, it can also display trend lines that it trades based on. It has filters for ADX and MA indicators, as well as a sufficient number of settings to be able to optimize on various currency pairs and timeframes.
The EA sets stop loss and take profit for each trade, does not have risky trading methods. It i

Introducing Backtest Simulator , an essential Expert Advisor designed to help you thoroughly test your trading strategies using historical data. Unlike the standard Strategy Tester in MetaTrader 5 , Backtest Simulator provides a user-friendly graphical interface that allows manual control over trades and positions within the Strategy Tester . The Strategy Tester in MetaTrader 5 lacks the capability for manual trade execution , limiting your ability to open orders manually, set pending orders, o

The RFOC Mini Chart was created to project a macro view of the market, which the option to select the timeframe of interest other than the main chart, it is possible to include 2 indicators: 1 - Moving average channel On the mini chart, the moving average will be created based on the prices of the selected time frame for the RFOC Mini Chart. The moving average period must be selected in the indicator settings pannel.
2 - Boillinger Band In the mini chart, a boillinger band will be created base
FREE
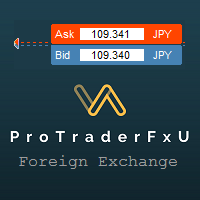
Description: - BidAskLine Indicator is very simple and easy, but each utility can be important in the probability that we will win in our trade. This utility Indicator shows lines and prices of the Bid, Ask and Spread. Input Parameters: - Visual Aspect Options : Select between 2 options with Box or Simple Style. - Parameters Bid Price : Select between show or hide line or box objects, change color, style or width line. - Parameters Ask Price : Select between show
FREE

Market Grid View is a utility to replace the original 'Market Watch' window. It was designed to be fast and give the user the ability to navigate over all symbols with just a click, while watch the price change or last trade value. To use it, configure your "Market Watch" window with all the symbols you want to monitor, and you can close it. Then insert the indicator in the graph. The parameters window need to be configured: Columns: the number of columns you want to be drawn ShowInfo: the type
FREE

마지막으로 인터페이스가 편리 해졌습니다. 지금 당신은 마우스로 표시 기간을 제어 할 수 있습니다. 버튼을 클릭하고 마우스 휠을 스크롤하여 참조 기간을 늘리거나 줄이십시오. 이 버튼은 편리한 장소에 배치 할 수 있으며 한 번의 클릭으로 고정 및 사용할 수 있습니다. 하나의 차트에 여러 지표를 설정하고 개별적으로 또는 한 번에 모두 관리 할 수 있습니다. 차트에 간단한 설치를 사용하면 각 표시기의 매개 변수 이름 바꾸기 또는 변경에 대해 걱정할 필요가 없으며 자동 알고리즘 자체가 필요한 개체의 이름을 바꾸고 생성 할뿐만 아니라 사용 후 삭제할 수 있습니다. 이 인터페이스는 가능한 한 편리하며 실제로 수동 개입이 필요하지 않습니다. 이 구성 요소는 종종 자신의 거래 전략에 참조 표시기를 사용하는 사람들을 위해 이상적입니다. 차트에 지속적으로 작업 할 수 있습니다! 테스터에서 작동하지 않습니다. 이 무료 제품에 대한 귀하의 의견을 남길 수있는 큰 요청. 설치 방법:
-차트에"버튼"을
FREE

GenMA MTF
The signal indicator WITHOUT REDRAWING gives recommendations on the direction of trading.
When the price moves through the internal channel, it gives signals (red and blue arrows) that recommend a possible change in the direction of the price movement up or down.
When the price crosses the external channel, it gives signals (yellow arrows), warning that a strong price movement is possible, which will not immediately change the direction of trading.
When the price crosses the a
FREE
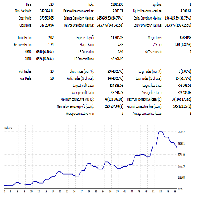
This is MacroTrendTrader. It trades in DAILY time frame even if you run it on lower time frames. It opens/closes trades once per day at a specific time that you choose via input tab: - "param(1-5)" are optimization parameters. - "Open/Close Hour" is set via input tab. Make sure to choose this to be away from nightly server shutdown. - "high risk" mode if chosen, sets a closer stop loss level. Therefore higher lot sizes are taken. This is a light load EA from processing point of view. Calculatio
FREE
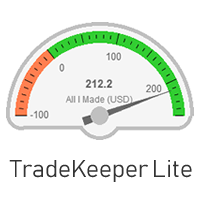
The utility TradeKeeper Lite can show your profits for different periods and bip a sound when you reach a profit target value. Click the tachometer to quickly switch to the next profit period. There are 5 of them: This Day, This Week, This Month, Last 90 Days and All I Made. With the utility TradeKeeper Pro , available at this link , you can also open trades with a magic number and volume of your choice, trail any orders with a simple trail or iSAR-based trail, as well as close any open trades a
FREE

We at Minions Labs always like to defy the stablished systems and beliefs trying new things and new ways of seeing and interpreting the Market Data. And all starts with the following question...
WHAT IF...
You give more relevance and focus on the Wicks/Shadows on the candlesticks? And Why? In volatile markets wicks play an important role on determining who is winning the the fight between Bulls and Bears , and more than that, Higher and lower wicks can present you with a good status of the cu
FREE

TickChart Indicator plots tick line on the main window of MetaTrader.
In the Lite version, the number of ticks is limited to 20 and the alert function described below is omitted. The tick-line shows the most detailed, fastest and real-time activities of the market, which are usually hidden in bars or candles longer than 1 minute. Usually, several new tick-line segments appear while a bar of M1 time frame is completed. After the release of an important economic indicator, the number of ticks pe
FREE

The indicator ColorCandlesDaily draw candles with different colors depending on the day of the week.
FREE

The Panel will read the floating profit/loss for the symbol of your chart and will plot the profit/loss numbers on the chart. It will work with manual trades or trades made by any expert advisor. The Panel shows the Max Drawdown in the base currency, floating profit/loss for both buy and sell orders. It will also show the same in Pips. The Panel is movable on the chart, so you can drag it using the mouse cursor.
FREE
This EA is decided to protect all positions when the markt go in the wrong direction. Pre-requirement: The calculation of margin should not be SUM. E.g you have 1 Lot Buy Position (1) and 2 Lots Sell Position (2)-> then the required margin should not be sum of margin of Postion (1) + margin of Position (2) Strategy: The important parameter is the TML "Triggered Margin Level". E.g TML = 110%: This EQ will loop over all the open positions. I f the current margin level go down to <= 110%, it will o
FREE

The RSI (Relative Strength Index) scanner is a powerful technical analysis tool designed to help traders and investors identify potential trading opportunities in the forex, stocks, and cryptocurrency markets. RSI is a popular momentum oscillator that measures the speed and change of price movements and helps determine overbought or oversold conditions in an asset. The scanner takes advantage of this indicator to streamline the process of finding trading signals and opportunities. The RSI value
FREE

A simple indicator/tool to display the current timeframe in the center of the chart. The object is automatically moved to the center of the chart whenever the chart size is changed by the user.
Input Parameters :
Font (default is Arial Black) Font Size (default is 50) Font Color (default is Silver, for light theme graphics, change to black or another dark color) Font Transparency (default is 90%)
FREE

BeST_Hull Single MA Strategy is an Metatrader Indicator based on the famous indicator Hull Mov.Average . This indicator can display the Single HMA Strategy of just 1 Hull MAvg. It uses added internal filters locating the most likely Entries while it can be used as a standalone system or as an add-on to other ones.
Generally the Hull Moving Average (HMA - developed by Alan Hull) is a directional trend indicator . It captures the current state of the market and uses recent price action to determi

A simple and efficient indicator that plots and updates the 50% of the current day, for those who use this point as a reference in day trading.
On trend days the 50% region tends to be a good resistance point, ideal for making new entries.
On non-trend days (sideways) the 50% region is great for carrying out positions.
In addition, for study or back-testing criteria, you can define the amount of previous days to be plotted by the indicator.
For questions or suggestions, please contact u
FREE

"Are you tired of losing money on unsuccessful trades? Look no further than EA Trailing Stop! Our program is designed to help you prevent losses and control your trades efficiently. With features such as adjustable stop loss and more, you can rest assured that your trades are in good hands. Don't wait any longer to start making successful trades. Try EA Trailing Stop today!"
You can use this as a starting point and tailor it to your audience and the platform you're using. This EA Trailing Stop
FREE

This is a multi frame stochastic indicator, you can attach any time frame of stoch indicator on one chart. It is very useful if you like to check multi time frame stoch data. If you are interested in EA,click below links to take a look: https://www.mql5.com/en/market/product/80170 https://www.mql5.com/en/market/product/81136
How to use: > Atach the first time frame you want on to the currency pair's chart > Atach the second time frame you want on to the currency pair's chart > Atach the thir
FREE

Smart Trend Line Alert , available for MT5 is a unique professional Trend Line, Support Line and Resistance Line Touch and Break out Alert with awesome Alert History feature, designed to help traders easily manage many charts and symbols without staring at the monitor.
Features Candle Break Out Alert, Price Touch Alert and Time Line Alert; 1 click for converting any drawn line into an alert line (Trend line and Horizontal line or Trend Line By Angle); Alerts History able to re-open closed char

Introducing "PropFirm Consistency Analyst" — your dynamic companion for achieving consistency in proprietary trading. This innovative Expert Advisor operates seamlessly, continuously calculating consistency metrics between two specified dates, providing real-time insights throughout the trading month.
Tailored specifically for prop traders, this tool serves as a dedicated ally in meeting the stringent consistency requirements set by some proprietary firms. By evaluating trading performance on
FREE

Limited Time Offer! Only $ 5300 USD ! The price will increase by $100 USD after every 10th purchase ! Final price: $ 15 000 USD DESCRIPTION : Attention! Contact me immediately after purchase to receive setup instructions!
The Expert Advisor (EA) is designed for capital distribution. We have made every effort to ensure that the minimum deposit is $100 USD.
This advisor is intended for trading with the broker Deriv. The EA has been optimized over the past year, startin

TradeCopy is an efficient MT4, MT5 trade copy software,using as EA on MT4 real account. You can download the Demo unlimit version to test on Demo account: Trade Copy MT4 Demo Free Trade Copy MT5 Demo Free
Features: 1.Can achieve cross-MT4 and MT5 trade copy . 2. The Sender and the receiver are in the same file, which is convenient to use. 3.Can achieve cross-broker trade copy. 4.More trade copy style, you can copy by balance,equity, lot ratio or fixed lot . 5.Can enlarge or reduce the amou

BeST_Hull MAs Directional Strategy is a Metatrader Indicator based on the corresponding Hull Moving Average.It timely locates the most likely points for Entering the Market as well as the most suitable Exit points and can be used either as a standalone Trading System or as an add-on to any Trading System for finding/confirming the most appropriate Entry or Exit points. This indicator does use only the directional slope and its turning points of Hull MAs to locate the Entry/Exit points while it

The RFOC Mini Chart was created to project a macro view of the market, which the option to select the timeframe of interest other than the main chart, it is possible to include 2 indicators:
In the full version it is possible to include 2 indicators: 1 - Moving average channel On the mini chart, the moving average will be created based on the prices of the selected time frame for the RFOC Mini Chart. The moving average period must be selected in the indicator settings pannel. 2 - Boillinger Ba
FREE

DLMACD - Divergence Local (Wave) MACD . The indicator displays divergences by changing the color of the MACD histogram. The indicator is easy to use and configure. It was created as an addition to the previously published DWMACD . For the calculation, a signal line or the values of the standard MACD histogram can be used. You can change the calculation using the UsedLine parameter. It is advisable to use a signal line for calculation if the histogram often changes directions and has small val
FREE
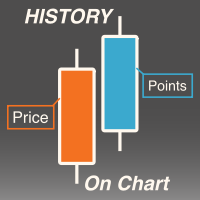
Description This is a utility tool for MT5 reminding traders of all the entry points by highlighting trading history. For those who just started to learn trading, one of the most efficient tips to improve their trading skill is to look back their own trading history. However, trade history arrow shown on MT5 chart is simply too small to find out, which will keep traders away from reviewing their trade, especially stupid mistakes like overtrading. By clearly showing their trade history and face i
FREE
Unlock Your Trading Potential with Our Risk Management Tool! Revolutionize your trading experience with our game-changing solution. Designed for traders who prioritize precision and control, our Risk Management Tool lets you effortlessly calculate the perfect lot size or volume, ensuring confident trades even in volatile markets. Seamless Trade Execution : Input your stop loss and risk level, and let our tool handle the rest. No more manual calculations – just efficient trading. Optimal Risk-Rew
FREE

Free version of https://www.mql5.com/en/market/product/44815 Simple indicator to calculate profit on fibonacci retracement levels with fixed lot size, or calculate lot size on fibonacci levels with fixed profit. Add to chart and move trend line to set the fibonacci retracement levels. Works similar as default fibonacci retracement line study in Metatrader. Inputs Fixed - select what value will be fix, lot or profit (available in full version, lot is set on free version) Fixed value - value tha
FREE

FOREXBOB AUTO CLOSER is a very handsome tool for :- Scalping Correlation Hedging Those who use averaging methods As this utility tool will help you by closing all your running trades when the universal floating P/L reaches a certain value that you will put in inputs. This tool consider all the trades that running on the your account either opened MANUALLY or with help of an EA.
Inputs USD - Put numeric value for required profit Group Mode - False Magic No. - Zero (0) to consider manually open
FREE

This expert advisor joins 18 strategies on crosses and changes, each of them identify a gap on specific custom sessions and try to close the gap. All the parameters are in the code so you can select only the size used for each strategies the base magic number: the real magic numbers used strating from base+1 to base+18. You can specify also the "Suffix" parameters, a special char following the name of the cross in some brokers (eg: EURUSD. EURUSD# EURUSDm) You can also activate/deactivate eve
FREE
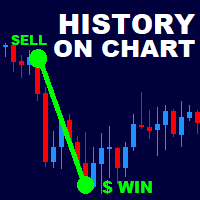
History On Chart is an indicator that shows the "trail" of all trades made in a specific period of time. It shows the entry and exit point with their respective dates and prices. It also shows the type of trades and the cash result. Open trades are also displayed, but only the entry point. The indicator is free and fully customizable. If you have any questions please contact us. Enjoy!
This is a free indicator, but it took hours to develop. If you want to pay me a coffee, I appreciate a lot
FREE

The BWmfi Bar indicator is designed to work with the Bill Williams system The indicator displays MFI signals on the chart, highlighting candles the corresponding MFI signals
You can choose 4 options for the indicator operation by setting the corresponding number 1,2,3,4 in the settings, in the "Input parameters" tab:
Normal graph without MFI signals In this mode, the bars will be painted in the colors of the MFI bars
This regime is used in his trading by Justin Williams, the daughter of Bi

516/5000 Average volume indicator to calculate the average volume for a given period. Useful as a filter to measure the strength of a trend, or false breaks in support or resistance.
It does not give a signal to buy or sell, it only acts as a filter to avoid entering into transactions with a drop in volume, or below-average volume, which may indicate disinterest in trading at the price level.
It has only the parameters of period, method of calculating the average and type of volume.
FREE

A professional tool for trading - the divergence indicator between the RVI and the price, which allows you to receive a signal about a trend reversal in a timely manner or catch price pullback movements (depending on the settings). The indicator settings allow you to adjust the strength of the divergence due to the angle of the RVI peaks and the percentage change in price, which makes it possible to fine-tune the signal strength. The indicator code is optimized and is tested very quickly as p
FREE
As a paid version, but only for JPY pairs.
Paid version: https://www.mql5.com/en/market/product/109302 Enjoy it, enjoy it, enjoy it, enjoy it, enjoy it, enjoy it, enjoy it, enjoy it, enjoy it, enjoy it, enjoy it, enjoy it, enjoy it, enjoy it, enjoy it, enjoy it, enjoy it, enjoy it, enjoy it, enjoy it, enjoy it, enjoy it, enjoy it, enjoy it, enjoy it, enjoy it, enjoy it, enjoy it, enjoy it, enjoy it, enjoy it, enjoy it, enjoy it, enjoy it, enjoy it, enjoy it, enjoy it, ...
FREE

Bill Williams' divergent bar with angulation. The angle between the green line and the top/bottom of the bar is used as an angle, which basically corresponds to the updated recommendations from Justin Williams Angulation for the Wiseman Bullish and Bearish Divergent Signal Bar - YouTube . The default settings of the angle of 85 and 21 bar from the moment of crossing the lip line of the Alligator work quite well. If you use this indicator in real trading, I highly recommend not to engage in day
FREE

If you are looking for a safe ea to start trading BTCUSD this is your ea
BITCOIN MT5. It is an Ea that seeks the best window of opportunity to enter the market.
If the entry is wrong, the system exits by stop lost and take profit.
The system detects the best moment to enter the BTCUSD and at that moment places a market order with its stop loss and its take profit.
Once the order is placed, the exit is only by stop lost or by take profit.
There is only one order at a time reducing the r
DYJ Follow Me is an EA that follows the virtual transaction record of any dyj indicator to actually open and close positions.
It can display the name and status of the indicator of the single signal source; At present, it is only the DYJ SignalSourceOfWPR MT5 indicator, and more indicators will be expanded in the future.
It can receive real-time trend direction of indicator.
It can receive the latest admission time of the indicator.
It can receive the latest admission price of

Transaction Data Analysis Assistant: This is a statistical analysis tool for transaction data, and there are many data charts for analysis and reference. language: Support language selection switch (currently supports Chinese and English active recognition without manual selection) The main window shows: Balance display Total profit and loss display Now the position profit and loss amount is displayed Now the position profit and loss ratio is displayed The total order volume, total lot size, and
FREE

실시간 바이낸스 선물 틱 데이터 및 실시간 바이낸스 현물 틱 데이터 작업을 위한 유틸리티입니다. 데이터를 더 빠르게 가져오고 Binance Future의 경계 내에 머물도록 설계되었습니다.
작동 로직: 글로벌 변수는 바이낸스 체크 서버 시간에서 수신한 시간 정보를 기록합니다.
다른 프로그램에서는 이 시간 정보를 사용하여 작업을 더 빠르고 효율적으로 수행합니다.
도구 메뉴 >> 옵션 >> Expert Advisors에서 WebRequest를 허용하고 URL을 추가해야 합니다. https://api.binance.com 설치 중 또는 판매 후 발생할 수 있는 문제가 있을 경우 주저하지 마시고 당사로 연락주시기 바랍니다. 설치 중 또는 판매 후 발생할 수 있는 문제가 있을 경우 주저하지 마시고 당사로 연락주시기 바랍니다.
FREE
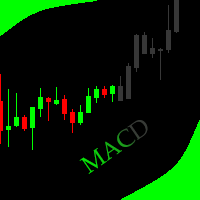
This indicator allows to hide MACD oscillator (on all MT5 timeframes) from a date define by the user, with a vertical line (Alone) or a panel (with "Hidden Candles").\ Indicator Inputs: Fast EMA Period Slow EMA Period Signal SMA Period Apply To Information on "MACD" indicator is available here: https://www.metatrader4.com/en/trading-platform/help/analytics/tech_indicators/macd ************************************************************* Hey traders!! Give me your feeds! We are a community
FREE
DESCRIPTION 3 Bar Break is based on one of Linda Bradford Raschke's trading methods that I have noticed is good at spotting potential future price volatility. It looks for when the previous bar's High is less than the 3rd bar's High as well as the previous bar's Low to be higher than the 3rd bar's Low. It then predicts the market might breakout to new levels within 2-3 of the next coming bars. Must also be traded during the active hours of the market you want to trade. EG EURUSD 7am - 5pm This
FREE

The ICT Concepts indicator regroups core concepts highlighted by trader and educator "The Inner Circle Trader" (ICT) into an all-in-one toolkit. Features include Market Structure (MSS & BOS), Order Blocks, Imbalances, Buyside/Sellside Liquidity, Displacements, ICT Killzones, and New Week/Day Opening Gaps. It’s one kind of Smart money concepts. USAGE: Please read this document ! DETAILS Market Structure Market structure labels are constructed from price breaking a prior extreme point. T

T-Wallpaper. This is a very useful wallpaper that comes with trade manager panel. You can choose any wallpaper of your choice. Must add the WallPaper file to your MQL5 Data Folder. Follow this easy steps: Download the WallPaper files from our channel https://www.mql5.com/en/channels/transitbk98 Open MT5 Select files Open Data Folder Open MQL5 Open Files and past the Wallpaper folder Now the wallpaper will display. Wallpaper settings are found on the user input. Trade panel settings are found on
FREE

ICT Kill zone and Macros Indicator mark and display the following zone times on the chart: Kill zones Kill zone Forex Asian
London Open New York Open London Close Central Bank Dealing range
Kill zone Indices Asian London Open New York AM New York Lunch New York PM Power Hour
Macros London 1 London 2 New York Am 1 New York AM 2 New York Lunch New York PM 1 New York PM 2
Silver bullet London Open New York AM New York PM
Sessions Asian London New York
Chart The display of Kill zone ,

The Grid Builder MT5 utility is designed for placing a grid of pending orders of any complexity and will be an excellent tool in the hands of a trader who trades grid trading strategies. The tool has numerous settings that allow you to quickly and easily build a grid of orders with the specified parameters. All types of pending orders are supported:
Buy Stop; Buy Limit; Sell Stop; Sell Limit. The script also allows you to delete a previously placed grid of orders in one click. If the "Delet
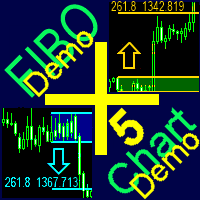
A ready-made trading system based on automatic plotting and tracking of Fibonacci levels for buying and selling any symbol on any timeframe. Demo version - calculation of the last 290 bars is not performed.
Advantages Determines the trend direction (14 indicators) Displays the trend strength and the values of indicators comprising the trend direction Plotting horizontal levels, support and resistance lines, channels Selection of the Fibonacci levels calculation type (6 different methods) Alert
FREE

This Renko is: Live : constantly updated on the market prices Dynamic : updating on each new ATR value Backtestable : Generating the chart during backtest, allowing Real Ticks Accuracy and Time Period Accuracy Guppy Built-in : GMMA with 12 EMA built-in This is what you are looking for! RENKO A Renko chart is a type of chart, developed by the Japanese, that is built using price movement rather than both price and standardized time intervals like most charts are. It is thought to be named a
MA strategies EA is a moving average cross EA that can support multiple MA cross strategies that involve two or three moving averages. Purchasing this EA can save you the time taken to automate your existing MA strategy through coding a custom EA and it also helps you discover profitable moving average strategies as its fully compatible with the strategy tester and all settings are editable. The EA supports both scalping, short term and long term strategies. The various supported settings are ex

Pairs Navigator is a simple and easy-to-use tool that allows you to view all of your charts in a single window. This eliminates the need to open multiple charts from the Market Watch window, saving you time and effort. Pairs Navigator is also very lightweight, so it will not put a strain on your RAM or cause your MT4/5 platform to hang. To use Pairs Navigator, simply drag and drop the currency pairs you want to view into the Pairs Navigator window. You can then easily switch between charts by
FREE

XXXX ATR (Average True Range) Position Manager: ATR StopLoss, ATR Target, ATR Breakeven, ATR Trailing StopLoss, with Risk % Calculation / Position.
Fully automated advanced ATR EA is now available:
https://www.mql5.com/en/market/product/94895
Key takeaways One click does it all: SELL and BUY button automatically places ATR stoploss, ATR target, ATR breakeven, ATR trailing stop and Risk % calculation of equity Entire position is calculated based on ATR No more manual position calculati

Midnight Scalper is based on a sound trading principle. It is made to trade during times when the market is at low volatility. From 23:00 to 00:00 is best. It uses multiple indicators for precise entry and exits with a basic fixed stop loss and take profit as part of its money management strategy.It does not put your funds at high risk with such methods as martingale, grid, averaging positions or no stop loss trading. ECN broker is required with a tight spread and low commission. NOTE : After a

Have you thought about sharing your EA trading signals with your friends? Or your EA signal can trade cryptocurrencies, but it cannot trade Binance Futures directly in MT5? Or you have an excellent EA, but it cannot be applied to other quantitative trading platforms without source code? Hook EA is to solve these problems. Regardless of whether you trade with a real account or a Demo account, Hook EA can monitor the Order or Deal submitted by any EA in real time, and send the information to the

Hello This EA (expert advisor) will open orders from Telegram "Auto Open orders from Telegram" (Telegram to MT5). Please watch our video for more details: https://www.youtube.com/watch?v=p06o1xgsD5c
download instructions from here https://drive.google.com/file/d/1rwZnvgaWoi3gSkEwsi7s5jeatjJLGTWc/view?usp=sharing
Good luck -------------------------------------------------------------- السلام عليكم هذا الاكسبيرت سيفتح صفقات آلية وفورية من تليجرام (Telegram إلى MT5) يرجى مشاهدة الفيديو لمزيد من
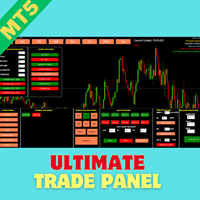
Introducing the Ultimate Trade Panel MT5 - Your All-in-One Trade Manager for MQL5 Trading Are you a trader looking to streamline your trading activities and gain a competitive edge in the market? Look no further! The Ultimate Trade Panel MT5 is here to revolutionize your trading experience on the MQL5 platform. With a plethora of unique and time-saving features, this expert advisor is designed to be your reliable companion for day-to-day trading activities. Key Features: Indicator Manager: Say g

MACD Histogram tracks the difference between the MACD line and the Signal line (which is the exponential moving average of the first line). For better visibility, when plotting the lines and the histogram in the same window, we scale up the histogram by a factor of 2. Furthermore, we use two separate plots for the histogram, which allows us to color-code the bars for upticks and downticks. The MACD Combo overlays MACD lines on MACD Histogram. Putting both plots in the same window enables you to

iVolX indicator horizontal volumes for all time periods
Main settings of the indicator: VolumeSource - select data for volumes (tick or real) PeriodMinutes - selection period for rendering of volumes PeriodsNumber - number of periods to show on the chart StartDate - the start date of the calculations ClusterPoints - cluster width Color - color MaxVolColor - maximum volume color ValueArea - the value of the zone of balance ValueAreaColor - color of the balance zone MaxVolFontSize - font size Ma

This utility allows to switch among symbols. You have to insert in the input your favorite tickers. it is possible to customize up to 5 symbols
Shortcut Keys : Switch among Symbols : A -Forward D -Backward
Inputs You can setup your favorite keys to switch among symbols.
You can customize the color of background and the edge of the buttons .
You can customize the labels : dimension and font.
FREE

The indicator displays the delta and the cumulative delta based on the "Time & Sales" deals list data. In addition to the standard timeframes, the indicator displays data regarding the seconds timeframes (S5, S10, S15, S20, S30) to choose from. Using the rectangle, user can select an arbitrary area in the indicator subwindow to view the ratio of the volumes of deals of buyers and sellers within this area.
Indicator features:
The indicator works correctly only on those trading symbols for whi

MACD indicators https://mql5.com This MACD indicator looks slightly different from the MACD indicator found in many other charting software. When the value of the signal line parameter is greater than the value of the MACD parameter, the indicator will give a buy prompt, and when the signal line parameter is less than the value of the MACD parameter, the indicator will give a sell prompt.
FREE
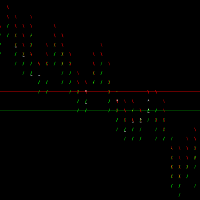
Analisador de Segundos, exibição de sinais e formação de padrões. Alteração a precisão do tempo em: Ferramentas --> Opções --> Aba Graficos --> item: Escola de Tempo Precisa. / --> indica uma compra \ --> indica uma venda "-" --> indica um movimento de indecisão. ^ --> indica um esforço dos compradores para manter e ou reverter a direção do mercado. _ --> indica um esforço dos vendedores para manter e ou reverter a direção do mercado.
As linhas de compra e venda tenta indicar o real spread do
FREE

Dynamic Theoretical Stop
Histogram indicator that dynamically analyzes the theoretical Stop levels in real time.
Operation :
The DTS - Dynamic Theoretical Stop does a mapping of fractals in previous candles and suggests two levels of Stop: For purchase and for sale.
Suggested reading :
It is necessary to make the definition of Maximum Stop in points in the Trading Plan. In this way, the trader can decide the best entry point by analyzing the theoretical stop levels:
Stop for sales: S
FREE
Use Day Trading Tracker to keep a record of your earnings across accounts. This indicator will show a dashboard in the Meta Trader chart to show for the profit or loss money in your account. It’s easy to see just how much money you’re making matched betting with the Forex Trading Profit Tracker. Key features: Track your profit over time Check out your stats. Track expected profits against actual profits. Export account history to Excel. MT4 version: https://www.mql5.com/en/market/product/39113
FREE

The indicator calculates the inclination angle between the Highs, Lows and Closes of adjacent bars. The angle can be measured in degrees or radians. A linear graph or a histogram is drawn in a subwindow. You can set the scale for the calculation — floating or fixed. For use in Expert Advisors or indicators, you need to specify a fixed scale.
Parameters Angular measure — degrees or radians. Scale mode for calculation — scaling mode. Free scale — free transformation, the indicator will calculate
FREE

" A trading range occurs when a financial instrument trades between constant high and low prices over a period of time. The upper part of the trading range of a financial instrument often provides price resistance, while the lower part of the trading range usually offers price support. Traders can enter in the direction of a breakout or breakdown from a trading range... "
This is the "Classical Theory" understanding of ranges. We have a different understanding of the nature of ranges and th

Baby Shark Pro EA works using a series of indicators, mainly the RSI. This is an EA that uses martingale, so use with caution. But Baby Shark Pro EA gives you the ability to change the multiplier parameter, which allows it to decrease the martingale level. Thus, you determine the risk level you want. Unlike most of the other martingale, EA’s This doesn’t place random entries, rather it is riding on market movement RSI > 50. If the market moved the opposite direction after the first entry, th

MovingInWL Expert Advisor는 미리 결정된 특정 이익 수준에 도달하면 열린 포지션의 중지를 손실이 없도록 이동하도록 설계되었습니다. 권고자 설정에 대한 설명: MagicNumber - 주문 식별자 LevelProfit - 스톱이 손실 없이 레벨로 이동하기 위해 포지션이 도달해야 하는 포인트의 이익 레벨. LevelWLoss - 포인트 손실이 없는 레벨로, 이익이 LevelProfit 레벨(포인트)에 도달한 후 스톱 포지션이 이전됩니다. Expert Advisor는 미리 결정된 특정 이익 수준에 도달하면 열린 포지션의 중지를 손실이 없도록 이동하도록 설계되었습니다. 권고자 설정에 대한 설명: MagicNumber - 주문 식별자 LevelProfit - 스톱이 손실 없이 레벨로 이동하기 위해 포지션이 도달해야 하는 포인트의 이익 레벨. LevelWLoss - 포인트 손실이 없는 레벨로, 이익이 LevelProfit 레벨(포인트)에 도달한 후 스톱
FREE
MetaTrader 플랫폼 어플리케이션 스토어에서 MetaTrader 마켓에서 트레이딩 로봇을 구매하는 방법에 대해 알아 보십시오.
MQL5.community 결제 시스템은 페이팔, 은행 카드 및 인기 결제 시스템을 통한 거래를 지원합니다. 더 나은 고객 경험을 위해 구입하시기 전에 거래 로봇을 테스트하시는 것을 권장합니다.
트레이딩 기회를 놓치고 있어요:
- 무료 트레이딩 앱
- 복사용 8,000 이상의 시그널
- 금융 시장 개척을 위한 경제 뉴스
등록
로그인
계정이 없으시면, 가입하십시오
MQL5.com 웹사이트에 로그인을 하기 위해 쿠키를 허용하십시오.
브라우저에서 필요한 설정을 활성화하시지 않으면, 로그인할 수 없습니다.