당사 팬 페이지에 가입하십시오
- 조회수:
- 12801
- 평가:
- 게시됨:
- 2012.05.18 16:25
- 업데이트됨:
- 2016.11.22 07:32
-
이 코드를 기반으로 한 로봇이나 지표가 필요하신가요? 프리랜스로 주문하세요 프리랜스로 이동
When volatility of the financial instrument became lower than some level, the long-,middle- and short-term strategies may lose profit and became unprofitable.
It depends how long will this "calm" - during these periods you may use scalper strategies based on hourly volatility. To find the patterns of market behavior you need a tools.
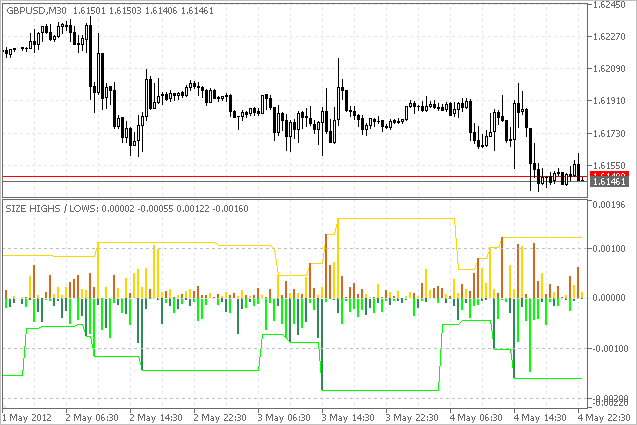
The Size Highs And Lows indicator shows the size of Highs and Lows and their values over the specified period (the values are calculated the same way as Price Channel indicator).

Fig. 1. Size Highs And Lows indicator
- The values>0 at the histogram show the size of the Highs. The bullish bars are plotted with yellow color, the bearish bars are plotted with brown color.
- The values<0 at the histogram show the size of the Lows. Bearish bars are shown with light green, bullish bars are shown with green color.
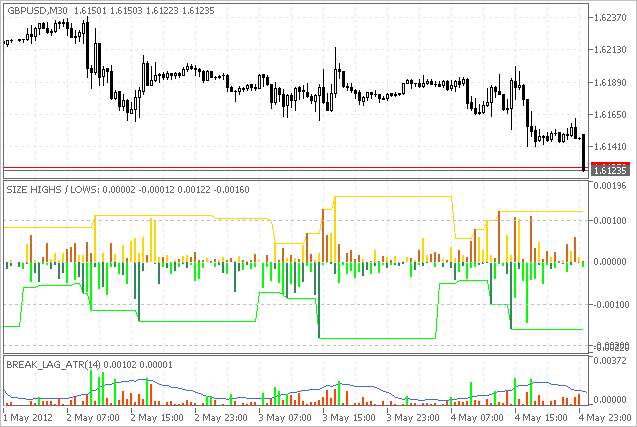
The idea became clear if you look at this with Break_Lag_ATR indicator:

Fig. 2. Size Highs And Lows + Break Lag ATR indicators
One can see on the figure above, the increased volatility persists some time after the breakdown of the volatility. That's the time for usage of the scalper robot. The only thing to find is the patterns :)
Input parameters:
The indicator has only 2 input parameters (periods):
| Parameter | Value |
|---|---|
| Period Max High | 30 |
| Period Max Low | 30 |
MetaQuotes Ltd에서 러시아어로 번역함.
원본 코드: https://www.mql5.com/ru/code/892
 IncGUI_ColorInput
Graphic control for color selection.
 IncColors
This class contains functions for working with colors. It has color conversion and other useful functions.
 Pearson correlation indicator
Pearson correlation indicator shows the correlation between symbols.
 Sampler
The indicator calculates perfect market entry signals, which can be used for neural network training.