TPM cross indicator MT4
- インディケータ
- Ekaterina Saltykova
- バージョン: 1.0
- アクティベーション: 5
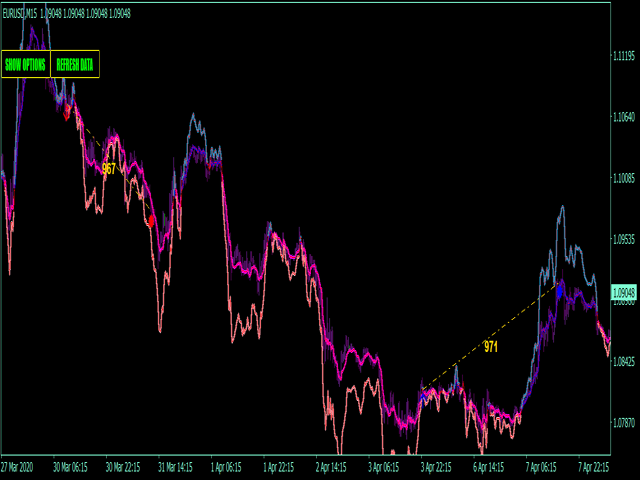
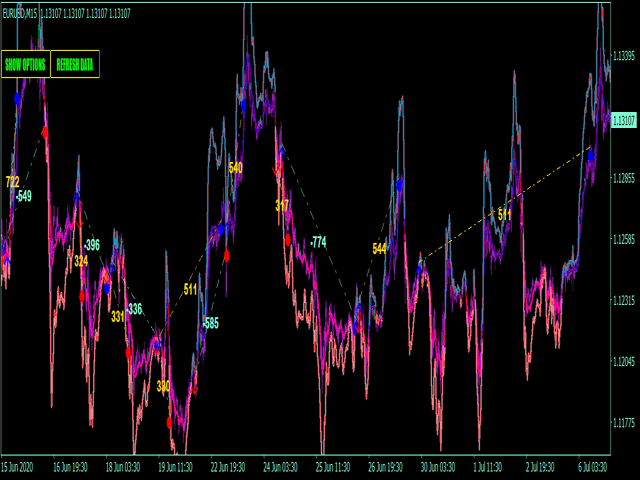
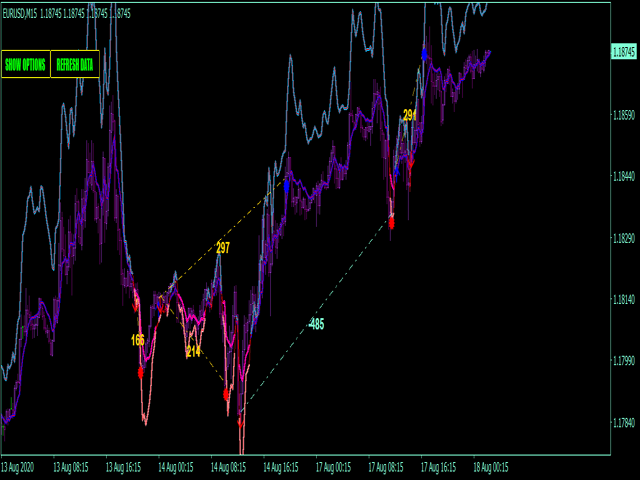
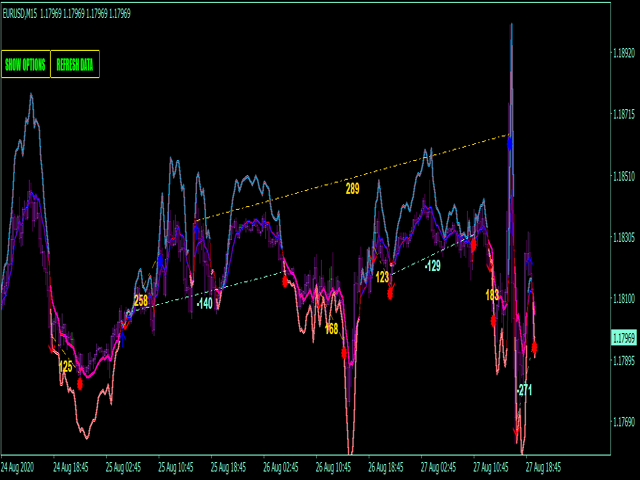
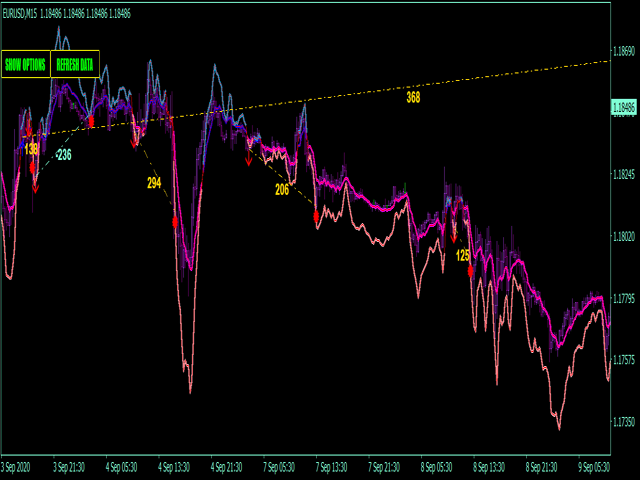
TPM Cross (trend power moving cross) - is a trend following strategy based on custom signal points.
Indicator consists from main custom moving chart line and trend power line. Indicator defines up and down movements by it's trend power and custom moving direction. When current market's trend looses it's power and opposite trend starts - power trend line
crosses moving and indicator plots an arrow.
Main indicator's adjustable inputs :
- movingPeriod - period of moving line
- trendPeriod - period of trend line (as a rule bigger than movingPeriod)
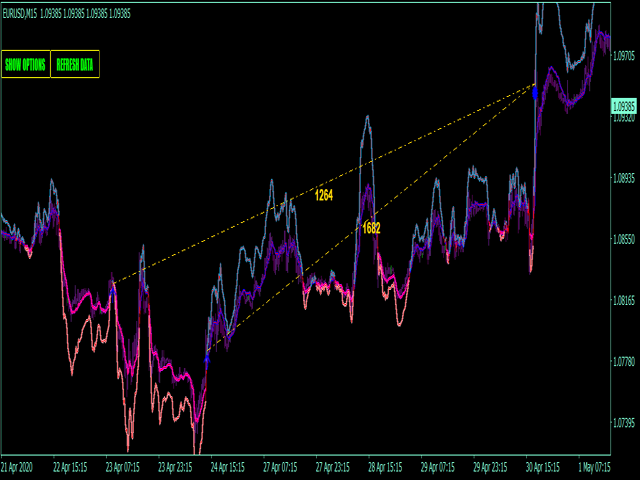
Main Indicator's Features
- Signals are not repaint, late or disappear;
- Every signal comes at the open of new bar(system uses only confirmed signals);
- Indicator has Alerts, Mail and Push notifications(allow to trade out of PC, from smartphone/mobile app);
- Indicator has profit/loss targets;
Recommendations for trading
- Volatility popular markets with low spread;
- Best timeframes - intraday timeframe up to H1-H4 timeframe;